The data in this collection can be viewed as georeferenced information using viewers developed at the Lamont-Doherty Earth Observatory of Columbia University for the exploration and visualization of earth science data. GeoMapApp - a 2D visualization tool for geoscience data, and Virtual Ocean is a 3D visualization tool for USGS geoscience data. Both applications use a similar interface, so these instructions will focus on the GeoMapApp interface.
Click on a tab to see the instructions for each data type.
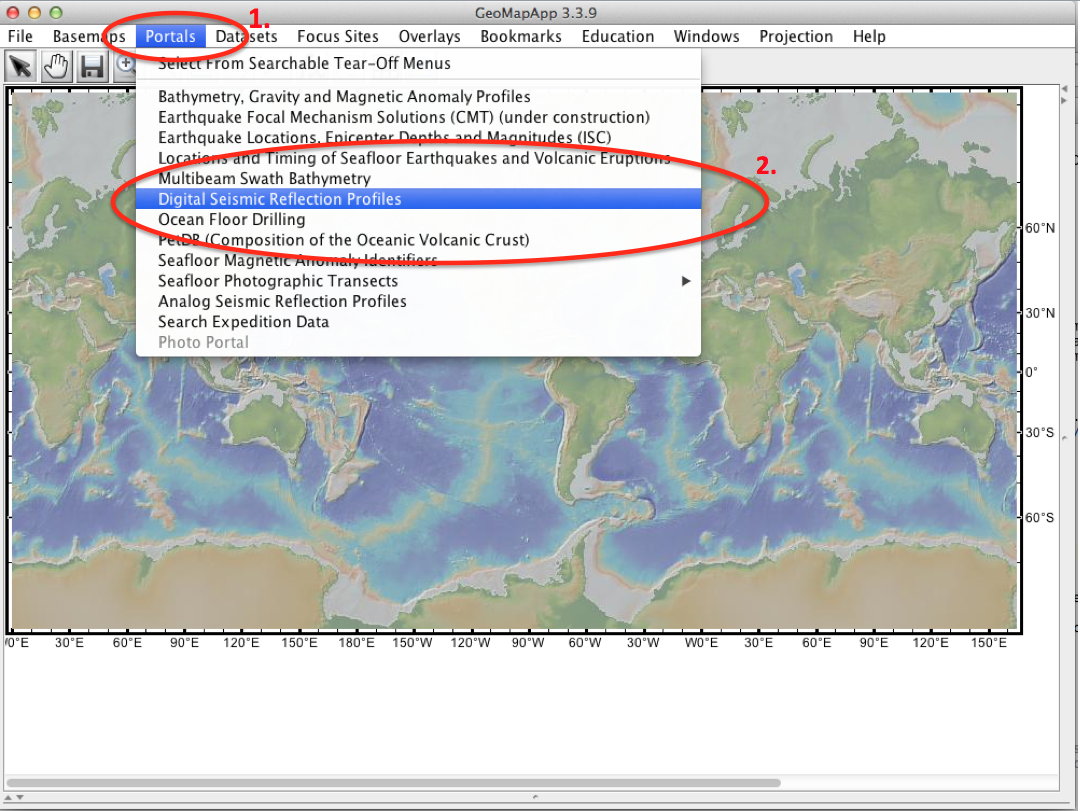
USGS seismic data can be accessed by selecting 'Digital Seismic Reflection Profiles' from the 'Portals' tab of the main menu.
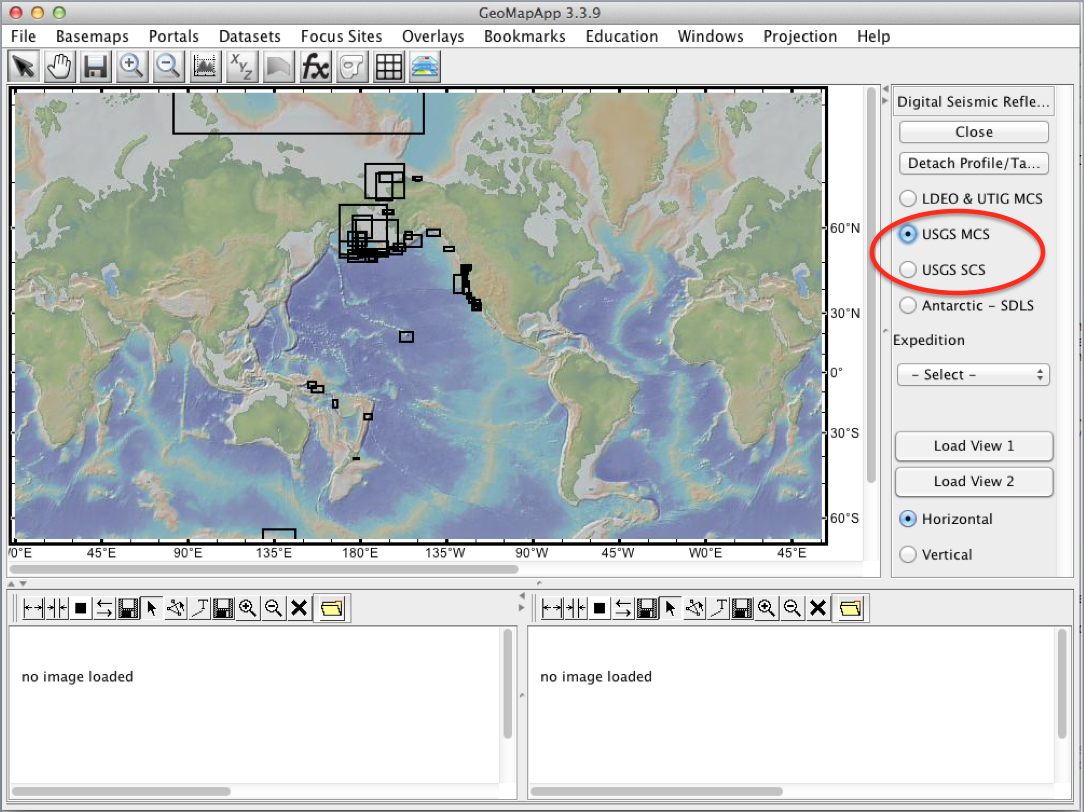
Select either the USGS MCS button for multichannel seismic data, or select the USGS SCS button for single channel seismic data. The display will change to show boxes that represent the bounding coordinates of the USGS data.
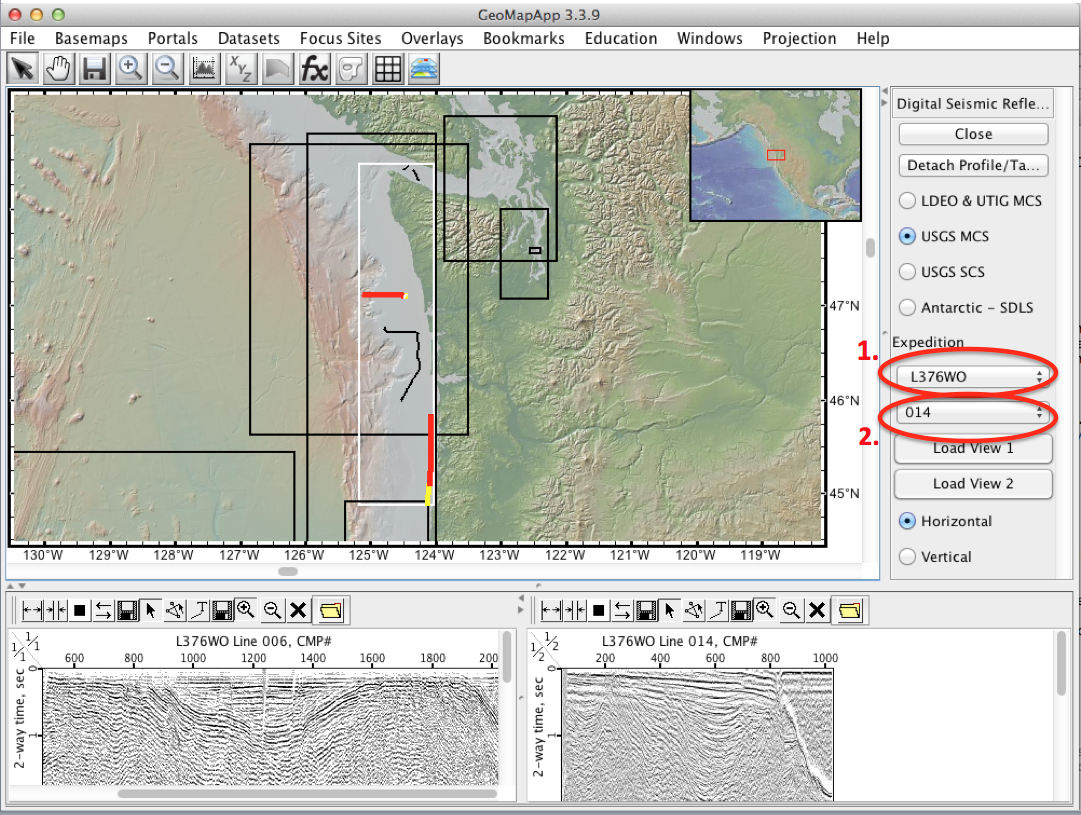
The data set can be selected by either clicking on the bounding box that is drawn on the map, or selected by clicking on the field activity number on the Expedition drop down selector. Once selected the bounding box will turn white and display the various track lines of the data. The track line can be selected by either clicking on the track line displayed on the map, or selected by clicking on the track line number on the Expedition second drop down selector. Once the track is selected, the data can be viewed by selecting either the 'Load View 1' or the 'Load View 2' buttons.
These USGS data can be accessed by selecting 'Bathymetry, Gravity, and Magnetic Anomaly Data Profiles' from the 'Portals' tab of the main menu.
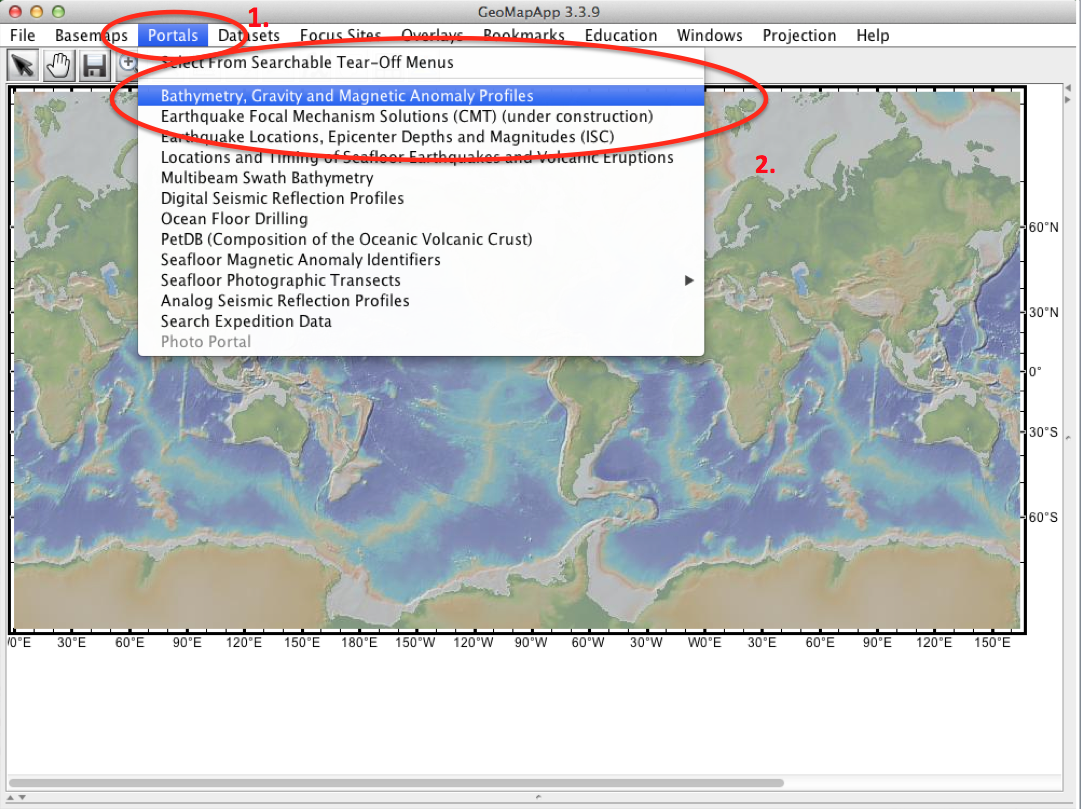
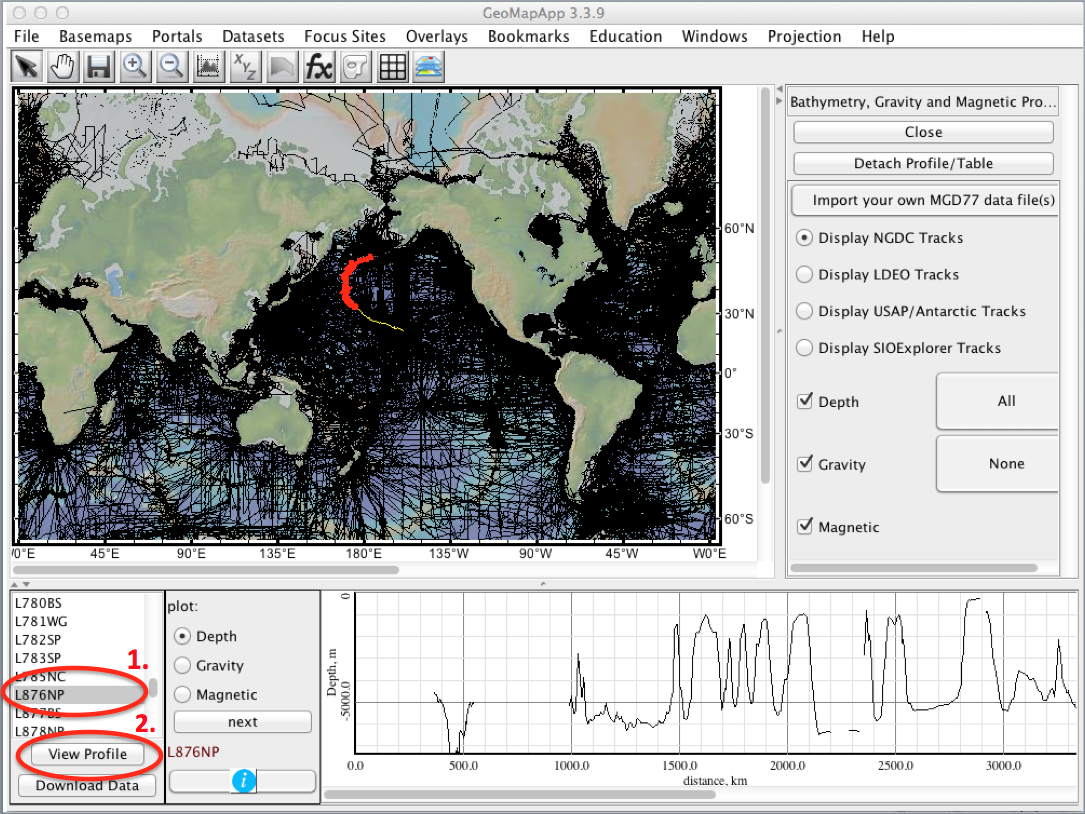
Unfortunately, there is no method of separating out the USGS data from this collection. If a specific USGS data set is desired, the Field Activity Number will have to be determined and then selected from the selector on the bottom, left corner. The display will change to highlight the track line in white. Click the view profile button to display the data from this line.
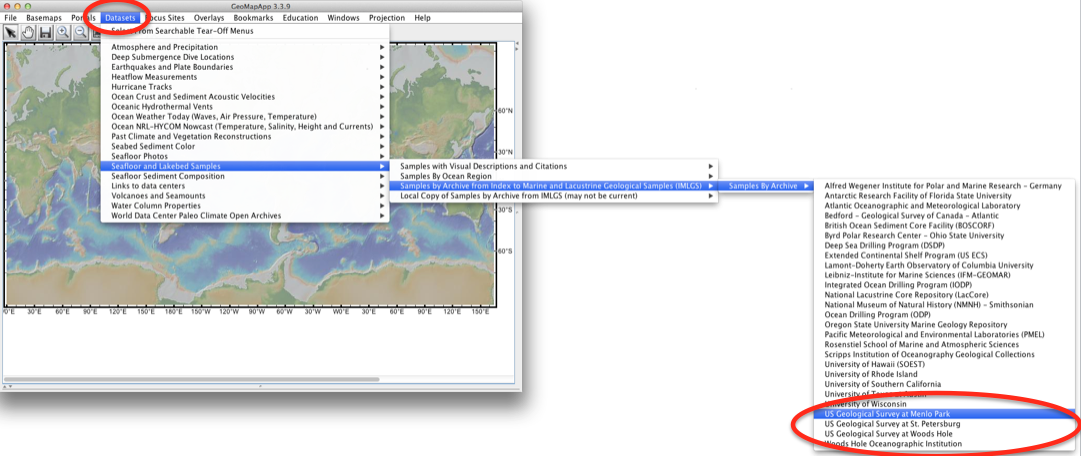
USGS samples data can be accessed by first selecting the 'Datasets' tab of the main menu. This is followed by selecting the 'Seafloor and Lakebed Samples', then 'Samples by Archive from Index to Marine and Lacustrine Geologic Samples (IMLGS)', then 'Samples by Archive', and finally select one of the 3 USGS sites. Repeat the process to include more that one site. The display will change to show points that represent the locations of the USGS sample data.
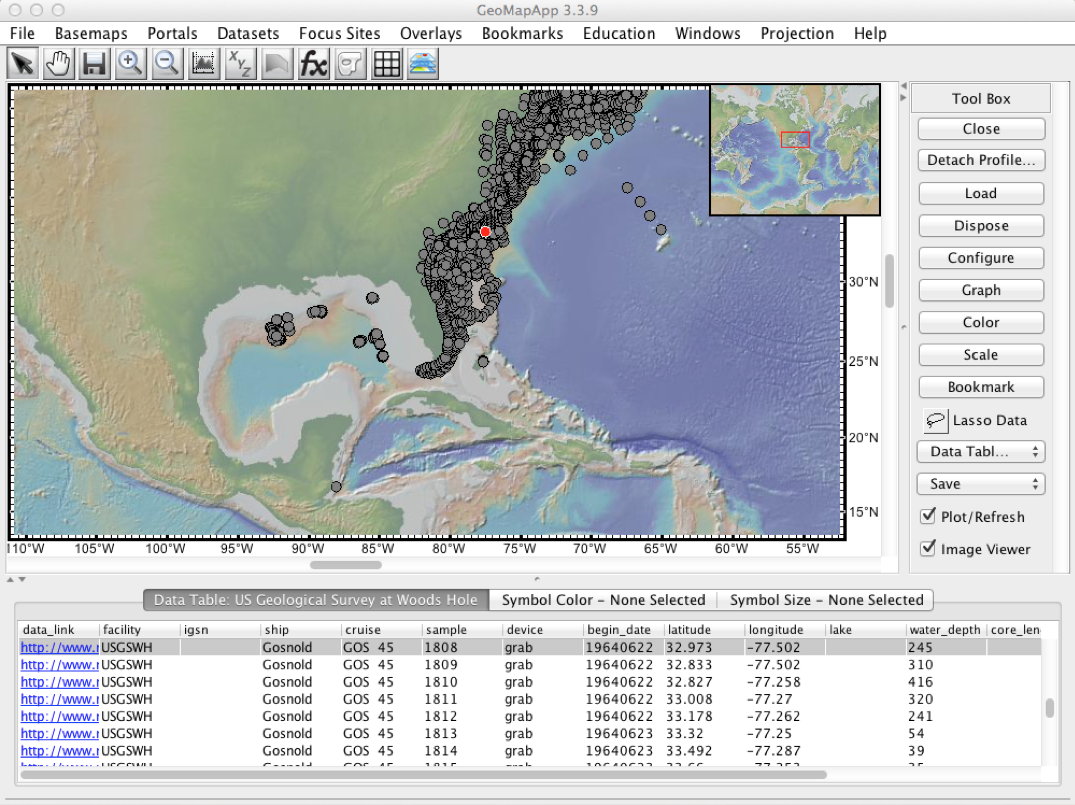
The data set can be selected by either clicking one of the points that is drawn on the map, or selected by clicking on the information line that is displayed at the bottom of the map.
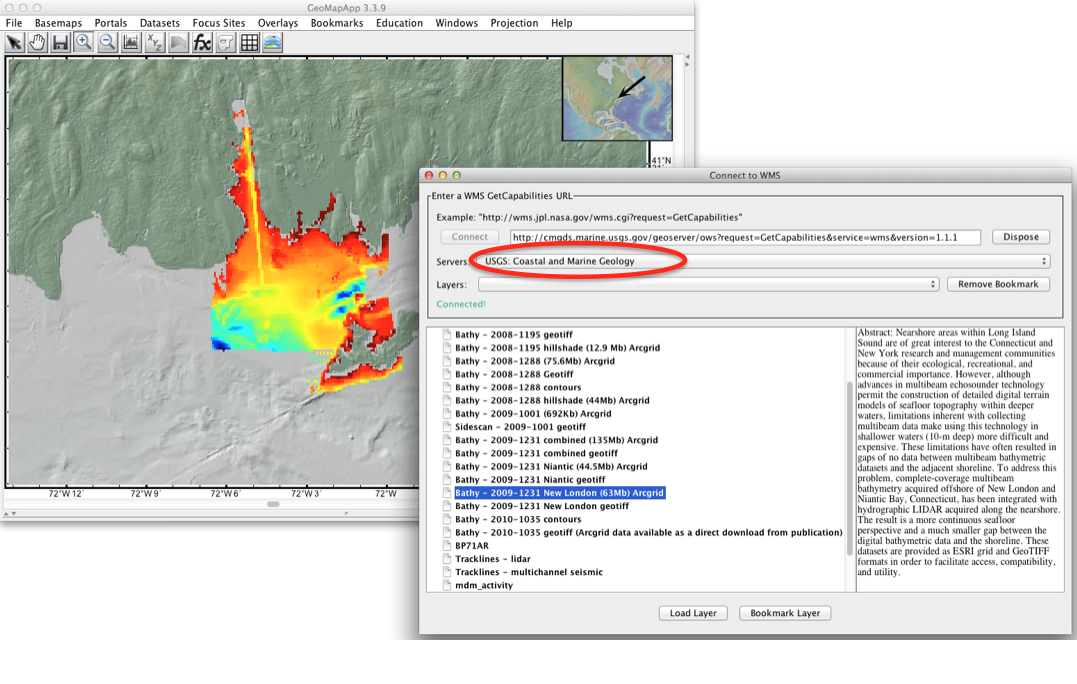
USGS data using WMS can be accessed by first selecting the 'File' tab of the main menu. This is followed by selecting the 'Import Image from web Mapping Service (WMS)'. The display will change to show a WMS selection menu.
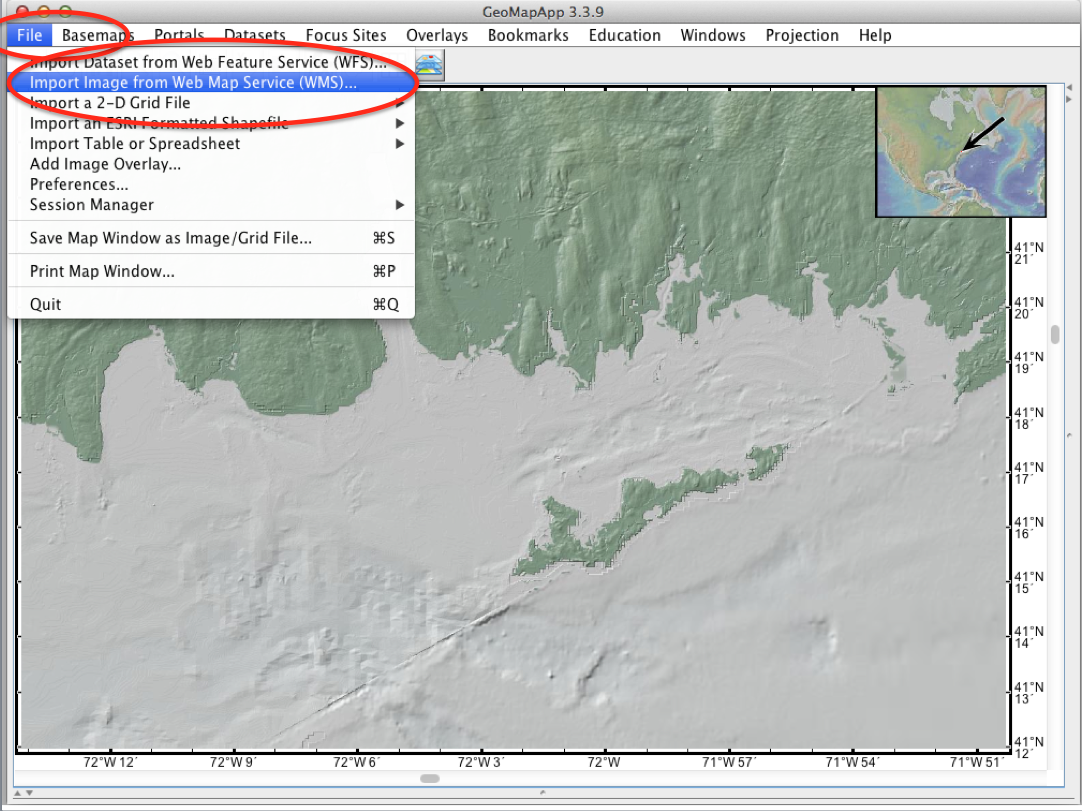
Just select one of the USGS Marine Geology links from the selection drop down and click on 'Connect'. The available datasets will appear after the connection is made. Select the desired dataset to display on the map and adjust the map accordingly.