Online Links:
Online Links:
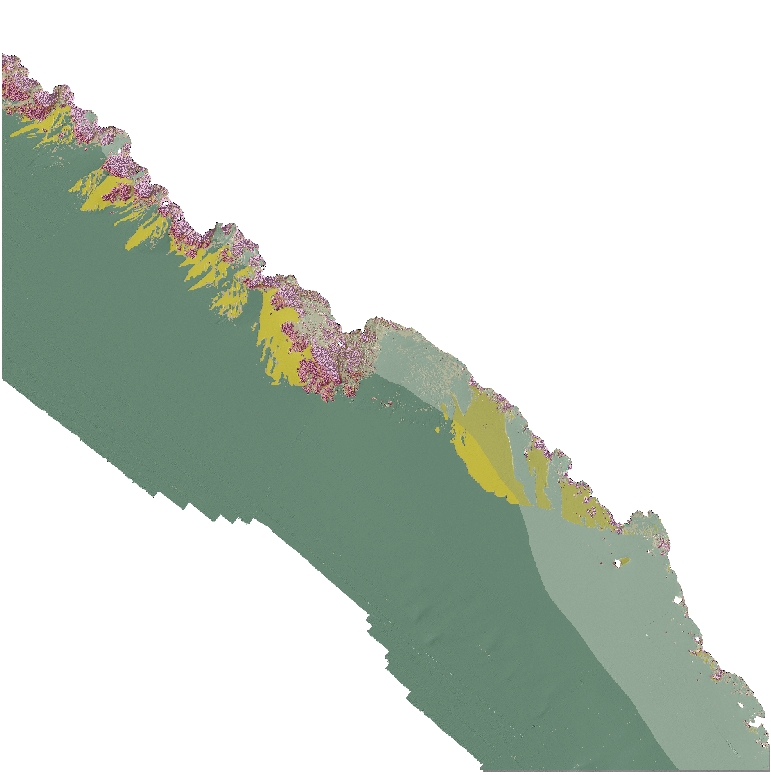
| Range of values | |
|---|---|
| Minimum: | 1 |
| Maximum: | 63 |
| Units: | Integers 1 - 63 representing seafloor character. classes |
| Range of values | |
|---|---|
| Minimum: | 21554 |
| Maximum: | 19661939 |
| Units: | Integers 21554 - 19661939 pixel count. |
| Range of values | |
|---|---|
| Minimum: | 1 |
| Maximum: | 2 |
| Units: | Integer value 1 and 2 representing slope classes as described above. |
| Range of values | |
|---|---|
| Minimum: | 2 |
| Maximum: | 3 |
| Units: | Integer values 2-3 representing slope classes as described above. |
| Range of values | |
|---|---|
| Minimum: | 1 |
| Maximum: | 4 |
| Units: | Integer values 1-4 representing substrate classes as described above. |
Online Links:
Online Links:
Online Links:
Online Links:
| Access_Constraints | none |
|---|---|
| Use_Constraints | USGS-authored or produced data and information are in the public domain from the U.S. Government and are freely redistributable with proper metadata and source attribution. Please recognize and acknowledge the U.S. Geological Survey as the originator(s) of the dataset and in products derived from these data. This information is not intended for navigation purposes. |
| Data format: | The .zip file for the TIFF image includes the image (.tif), the world registration file (.tfw), and FGDC-compliant metadata. in format GeoTiff (version ArcMap (version 10.0, ESRI, 2011)) Raster data layer is registered TIFF image in the UTM Zone 10 coordinate system. Size: 1.0 |
|---|---|
| Network links: |
https://pubs.usgs.gov/ds/781/OffshoreFortRoss/data/SeafloorCharacter_OffshoreFortRoss.zip https://pubs.usgs.gov/ds/781/OffshoreFortRoss/data_catalog_OffshoreFortRoss.html https://doi.org/10.3133/ds781 |