Backscatter B [USGS]--Offshore of Ventura, California

Metadata also available as - [Outline] - [Parseable text] - [XML]

Frequently anticipated questions:


What does this data set describe?

Title: Backscatter B [USGS]--Offshore of Ventura, California
Abstract:
This part of DS 781 presents acoustic-backscatter data for the Offshore of Ventura map area, California. The raster data file is included in "BackscatterB_USGS_OffshoreVentura.zip," which is accessible from https://pubs.usgs.gov/ds/781/OffshoreVentura/data_catalog_OffshoreVentura.html. These data accompany the pamphlet and map sheets of Johnson, S.Y., Dartnell, P., Cochrane, G.R., Golden, N.E., Phillips, E.L., Ritchie, A.C., Kvitek, R.G., Greene, H.G., Krigsman, L.M., Endris, C.A., Seitz, G.G., Gutierrez, C.I., Sliter, R.W., Erdey, M.D., Wong, F.L., Yoklavich, M.M., Draut, A.E., and Hart, P.E. (S.Y. Johnson and S.A. Cochran, eds.), 2013, California State Waters Map Series—Offshore of Ventura, California: U.S. Geological Survey Scientific Investigations Map 3254, pamphlet 42 p., 11 sheets, scale 1:24,000, https://doi.org/10.3133/sim3254.
The acoustic-backscatter map of the Offshore Ventura map area, California, was generated from backscatter data collected by California State University, Monterey Bay, Seafloor Mapping Lab (CSUMB) and by the U.S. Geological Survey (USGS). These metadata describes the acoustic-backscatter data collected by the USGS (see "BackscatterA_CSUMB_OffshoreVentura_metadata.txt" metadata for a description of the acoustic-backscatter data collected by CSUMB). The seafloor west of Ventura Harbor was mapped by the USGS in 2006 and 2010, using 117-kHz (2006) and 234.5-kHz (2010) SEA (AP) Ltd. SWATHplus-M phase-differencing sidescan sonars. These mapping missions collected acoustic-backscatter data from about the 10-m isobath to beyond the 3-nautical-mile limit of California's State Waters. Within the acoustic-backscatter imagery, brighter tones indicate higher backscatter intensity, and darker tones indicate lower backscatter intensity. The intensity represents a complex interaction between the acoustic pulse and the seafloor, as well as characteristics within the shallow subsurface, providing a general indication of seafloor texture and sediment type. Backscatter intensity depends on the acoustic source level; the frequency used to image the seafloor; the grazing angle; the composition and character of the seafloor, including grain size, water content, bulk density, and seafloor roughness; and some biological cover. Harder and rougher bottom types such as rocky outcrops or coarse sediment typically return stronger intensities (high backscatter, lighter tones), whereas softer bottom types such as fine sediment return weaker intensities (low backscatter, darker tones).
Supplemental_Information:
Additional information about the USGS field activities from which these data were derived is available online at:
https://cmgds.marine.usgs.gov/fan_info.php?fan=Z206SC https://cmgds.marine.usgs.gov/fan_info.php?fan=SW109SC
Any use of trade, product, or firm names is for descriptive purposes only and does not imply endorsement by the U.S. Government.
Although this Federal Geographic Data Committee-compliant metadata file is intended to document the data set in nonproprietary form, as well as in Esri format, this metadata file may include some Esri-specific terminology.
  1. How might this data set be cited?
    Dartnell, Peter, Kvitek, Rikk G., Phillips, Eleyne L., and Cochrane, Guy R., 2013, Backscatter B [USGS]--Offshore of Ventura, California: Data Series DS 781, U.S. Geological Survey, Reston, VA.

    Online Links:

    This is part of the following larger work.

    Golden, Nadine E., 2013, California State Waters Map Series Data Catalog: Data Series DS 781, U.S. Geological Survey, Reston, VA.

    Online Links:

  2. What geographic area does the data set cover?
    West_Bounding_Coordinate: -119.44
    East_Bounding_Coordinate: -119.25
    North_Bounding_Coordinate: 34.38
    South_Bounding_Coordinate: 34.22
  3. What does it look like?
    https://pubs.usgs.gov/ds/781/OffshoreVentura/images/BackscatterB_USGS_OffshoreVentura.jpg (JPEG)
    Acoustic backscatter imagery of the Offshore of Ventura map area.
  4. Does the data set describe conditions during a particular time period?
    Beginning_Date: 2006
    Ending_Date: 2009
    Currentness_Reference:
    ground condition
  5. What is the general form of this data set?
    Geospatial_Data_Presentation_Form: GeoTiff
  6. How does the data set represent geographic features?
    1. How are geographic features stored in the data set?
      This is a Raster data set. It contains the following raster data types:
      • Dimensions, type Grid Cell
    2. What coordinate system is used to represent geographic features?
      Grid_Coordinate_System_Name: Universal Transverse Mercator
      Universal_Transverse_Mercator:
      UTM_Zone_Number: 11
      Transverse_Mercator:
      Scale_Factor_at_Central_Meridian: 0.9996
      Longitude_of_Central_Meridian: -117.00000
      Latitude_of_Projection_Origin: 0.00000
      False_Easting: 500000.0
      False_Northing: 0.00
      Planar coordinates are encoded using coordinate pair
      Abscissae (x-coordinates) are specified to the nearest 2.0
      Ordinates (y-coordinates) are specified to the nearest 2.0
      Planar coordinates are specified in Meters
      The horizontal datum used is WGS84.
      The ellipsoid used is WGS84.
      The semi-major axis of the ellipsoid used is 6378137.00.
      The flattening of the ellipsoid used is 1/298.257223563.
  7. How does the data set describe geographic features?
    Entity_and_Attribute_Overview:
    The USGS 2006 backscatter grid was originally archived as an ESRI grid with the following attributes:
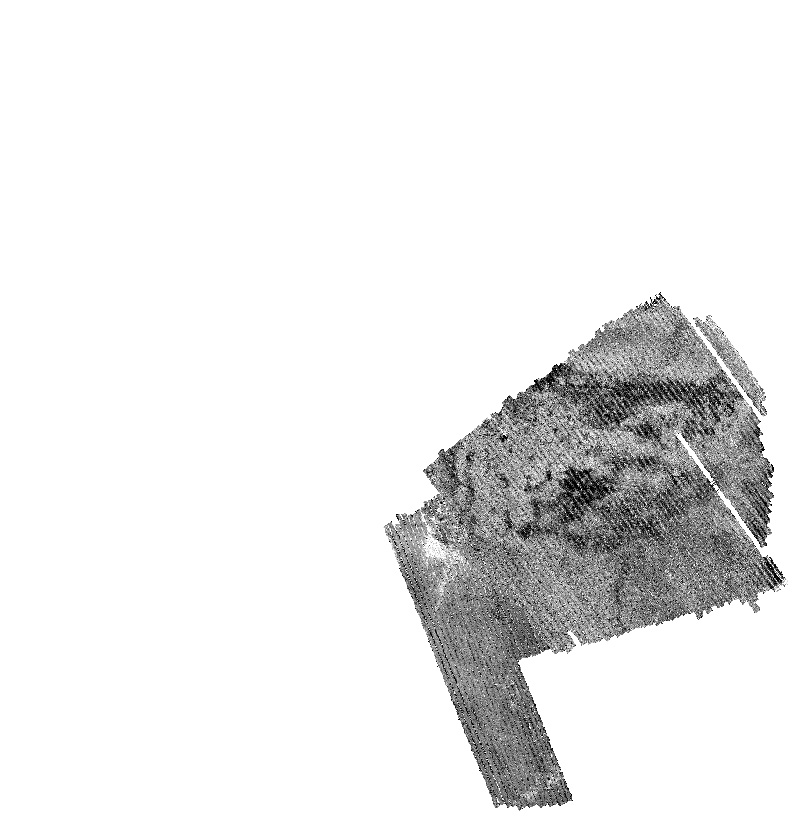
    Cell size = 2.0
    Number of rows = 3623
    Number of columns = 3643
    
    Data type = floating point
    
    Boundary
    Xmin = 284123.00
    Xmax = 291409.00
    Ymin = 3787799.00
    Ymax = 3795045.00
    
    Statistics
    Minimum value = 0
    Maximum value = 255
    Mean = 194.32
    Standard deviation = 62.68
    
    Coordinate system description
    Projection  UTM
    Zone  11
    Datum  WGS84
    Units  meter
    
    The USGS 2010 backscatter grid was originally archived as an ESRI grid with the following attributes:
    Cell size = 2.0
    Number of rows = 3235
    Number of columns = 1995
    
    Data type = floating point
    
    Boundary
    Xmin = 283431.00
    Xmax = 287421.00
    Ymin = 3784973.00
    Ymax = 3791443.00
    
    Statistics
    Minimum value = 0
    Maximum value = 254
    Mean = 118.11
    Standard deviation = 33.31
    
    Coordinate system description
    Projection  UTM
    Zone  11
    Datum  WGS84
    Units  meter
    
    Entity_and_Attribute_Detail_Citation: none

Who produced the data set?

  1. Who are the originators of the data set? (may include formal authors, digital compilers, and editors)
    • Peter Dartnell
    • Rikk G. Kvitek
    • Eleyne L. Phillips
    • Guy R. Cochrane
  2. Who also contributed to the data set?
  3. To whom should users address questions about the data?
    U.S. Geological Survey, Pacific Coastal and Marine Science Center
    Attn: PCMSC Science Data Coordinator
    2885 Mission Street
    Santa Cruz, CA
    US

    831-427-4747 (voice)
    pcmsc_data@usgs.gov

Why was the data set created?

To expand geologic mapping to the seafloor within the California's State Waters, to update coastal geologic mapping, and to contribute to a uniform regional geologic database, which can be used geographic information systems. Additionally, to provide a geologic map for the public and geoscience community to aid in assessments and mitigation of geologic hazards in the Ventura coastal region and to provide sufficient geologic information for land-use and land-management decisions both onshore and offshore. These data are intended for science researchers, students, policy makers, and the general public. These data can be used with geographic information systems or other software. This information is not intended for navigational purposes.

How was the data set created?

  1. From what previous works were the data drawn?
  2. How were the data generated, processed, and modified?
    Date: 2011 (process 1 of 6)
    USGS acoustic-backscatter data were collected in 2006 and 2010, using 117-kHz (2006) and 234.5-kHz (2010) SEA (AP) Ltd. SWATHplus-M phase-differencing sidescan sonars aboard the USGS R/V Parke Snavely. The survey vessel was equipped with a CodaOctopus F180 attitude and position system. This system combines differential GPS data (2006) and real time kinematic GPS data (2-centimeter error ellipse) (2010) with inertial motion measurements so that high-precision position and attitude corrections are fed in real-time to the sonar acquisition equipment. Up to 10 pings per second are transmitted, each ping consisting of 2,048 samples per side (port and starboard). The returned samples are projected to the seafloor using a ray-tracing algorithm working with the previously measured sound-velocity profiles. A series of statistical filters are applied to the raw samples that discriminate the seafloor returns from other unintended targets in the water column. The raw 16-bit backscatter data recorded simultaneously with bathymetry by the SWATHplus was georeferenced and gain-normalized by the program SXPEGN, software written by the USGS to enhance the backscatter of the SWATHplus system. The program normalizes for time-varying signal loss and beam-directivity differences. The resulting normalized-amplitude values are rescaled to 16-bit and gridded into a GeoJPEG image using GRID Processor Software supplied by SEA. The GeoJPEG was imported into a GRID using ESRI GIS software and clipped to the Offshore of Ventura map area boundary. Person who carried out this activity:
    Pete Dartnell
    U.S. Geological Survey, Pacific Coastal and Marine Science Center
    Physical Scientist
    2885 Mission St.
    Santa Cruz, CA
    USA

    (831) 460-7415 (voice)
    pdartnell@usgs.gov
    Date: 05-Oct-2017 (process 2 of 6)
    Added Distribution_Information section to metadata to facilitate data download. Person who carried out this activity:
    U.S. Geological Survey
    Attn: Alan O. Allwardt
    Contractor -- Information Specialist
    2885 Mission Street
    Santa Cruz, CA

    831-460-7551 (voice)
    831-427-4748 (FAX)
    aallwardt@usgs.gov
    Date: 05-Oct-2017 (process 3 of 6)
    Keywords section of metadata optimized for discovery in USGS Coastal and Marine Geology Data Catalog. Person who carried out this activity:
    U.S. Geological Survey
    Attn: Alan O. Allwardt
    Contractor -- Information Specialist
    2885 Mission Street
    Santa Cruz, CA

    831-460-7551 (voice)
    831-427-4748 (FAX)
    aallwardt@usgs.gov
    Date: 26-Apr-2018 (process 4 of 6)
    Added keywords from Coastal and Marine Ecological Classification Standard (CMECS) to metadata. Person who carried out this activity:
    U.S. Geological Survey
    Attn: Alan O. Allwardt
    Contractor -- Information Specialist
    2885 Mission Street
    Santa Cruz, CA

    831-460-7551 (voice)
    831-427-4748 (FAX)
    aallwardt@usgs.gov
    Date: 19-Oct-2020 (process 5 of 6)
    Edited metadata to add keywords section with USGS persistent identifier as theme keyword. No data were changed. Person who carried out this activity:
    U.S. Geological Survey
    Attn: VeeAnn A. Cross
    Marine Geologist
    384 Woods Hole Road
    Woods Hole, MA

    508-548-8700 x2251 (voice)
    508-457-2310 (FAX)
    vatnipp@usgs.gov
    Date: 20-Mar-2023 (process 6 of 6)
    Metadata was modified to bring up to current USGS PCMSC standards. USGS Thesaurus and keywords were added, information for accompanying Open-File Report added to Abstract and Cross Reference sections, Point of Contact and Metadata Contact information was updated, and Process Steps were refined. Information about the data available for download and different Network Resource Name links and details were given in the Standard Order Process section. Minor typos were corrected. No data information was changed. The metadata available from a harvester may supersede metadata bundled within a download file. Users are advised to compare the metadata dates to determine which metadata file is most recent. Person who carried out this activity:
    Susan A Cochran
    U.S. Geological Survey, Pacific Coastal and Marine Science Center
    Geologist
    2885 Mission Street
    Santa Cruz, CA
    USA

    (831) 460-7545 (voice)
    scochran@usgs.gov
  3. What similar or related data should the user be aware of?
    Johnson, Samuel Y., Dartnell, Peter, Cochrane, Guy R., Golden, Nadine E., Phillips, Eleyne L., Ritchie, Andrew C., Kvitek, Rikk G., Greene, H. Gary, Krigsman, Lisa M., Endris, Charles A., Seitz, Gordon G., Gutierrez, Carlos I., Sliter, Ray W., Erdey, Mercedes D., Wong, Florence L., Yoklavich, Mary M., Draut, Amy E., Hart, Patrick E., and Cochran, Susan A., 2013, California State Waters Map Series--Offshore of Ventura, California: Scientific Investigations Map SIM 3254, U.S. Geological Survey, Reston, VA.

    Online Links:


How reliable are the data; what problems remain in the data set?

  1. How well have the observations been checked?
    Not applicable for raster data.
  2. How accurate are the geographic locations?
    Estimated to be no less than 2 m, owing to total propagated uncertainties of the mapping systems, which include sonar system, position and motion compensation system, and navigation, as well as data processing that includes sounding cleaning, gridding, and datum transformations.
  3. How accurate are the heights or depths?
    Not applicable
  4. Where are the gaps in the data? What is missing?
    Complete
  5. How consistent are the relationships among the observations, including topology?
    Unspecified

How can someone get a copy of the data set?

Are there legal restrictions on access or use of the data?
Access_Constraints None
Use_Constraints USGS-authored or produced data and information are in the public domain from the U.S. Government and are freely redistributable with proper metadata and source attribution. Please recognize and acknowledge the U.S. Geological Survey and California State University, Monterey Bay, Seafloor Mapping Lab (CSUMB) as the originator(s) of the dataset and in products derived from these data. This information is not intended for navigation purposes.
  1. Who distributes the data set? (Distributor 1 of 1)
    U.S. Geological Survey
    345 Middlefield Rd
    Menlo Park, CA
    USA

    (650) 329-4309 (voice)
  2. What's the catalog number I need to order this data set? The .zip file (https://pubs.usgs.gov/ds/781/OffshoreVentura/data/BackscatterB_USGS_OffshoreVentura.zip) includes the .tfw, .tif, .tif.aux.xml, and .tif.ovr, files, as well as FGDC-compliant metadata for the BackscatterB_USGS data layer in the Offshore of Ventura map area of California.
  3. What legal disclaimers am I supposed to read?
    Unless otherwise stated, all data, metadata and related materials are considered to satisfy the quality standards relative to the purpose for which the data were collected. Although these data and associated metadata have been reviewed for accuracy and completeness and approved for release by the U.S. Geological Survey (USGS), no warranty expressed or implied is made regarding the display or utility of the data on any other system or for general or scientific purposes, nor shall the act of distribution constitute any such warranty.
  4. How can I download or order the data?

Who wrote the metadata?

Dates:
Last modified: 20-Mar-2023
Metadata author:
U.S. Geological Survey, Pacific Coastal and Marine Science Center
Attn: PCMSC Science Data Coordinator
2885 Mission Street
Santa Cruz, CA
US

831-427-4747 (voice)
pcmsc_data@usgs.gov
Metadata standard:
Content Standard for Digital Geospatial Metadata (FGDC-STD-001-1998)

This page is <https://cmgds.marine.usgs.gov/catalog/pcmsc/SeriesReports/DS_DDS/DS_781/Ventura/BackscatterB_USGS_OffshoreVentura_metadata.faq.html>
Generated by mp version 2.9.51 on Tue Mar 21 18:02:07 2023