Archive of Digital Chirp Subbottom Profile Data Collected During USGS Cruises 13BIM02 and 13BIM07 Offshore of the Chandeleur Islands, Louisiana, 2013

Metadata also available as - [Outline] - [Parseable text] - [XML]

Frequently anticipated questions:


What does this data set describe?

Title:
Archive of Digital Chirp Subbottom Profile Data Collected During USGS Cruises 13BIM02 and 13BIM07 Offshore of the Chandeleur Islands, Louisiana, 2013
Abstract:
On July 5–19 (13BIM02) and August 22–September 1 (13BIM07) of 2013, the U.S. Geological Survey (USGS) conducted geophysical surveys to investigate the geologic controls on barrier island evolution and medium-term and interannual sediment transport along the oil spill mitigation sand berm constructed at the north end and offshore of the Chandeleur Islands, La. This investigation is part of a broader USGS study, which seeks to understand barrier island evolution better over medium time scales (months to years). This report serves as an archive of unprocessed, digital chirp subbottom data, trackline maps, navigation files, Geographic Information System (GIS) information, and formal Federal Geographic Data Committee (FGDC) metadata. Gained digital images of the seismic profiles are provided. The archived trace data are in standard Society of Exploration Geophysicists (SEG) SEG Y revision 0 format (Barry and others, 1975) and may be downloaded and processed with commercial or public domain software such as Seismic Unix (SU). Examples of SU processing scripts and USGS software for viewing the SEG Y files (Zihlman, 1992) are provided. These data are available for viewing using GeoMapApp (<http://www.geomapapp.org/>) and Virtual Ocean (<http://www.virtualocean.org/>) multi-platform open source software. In addition, the SEG Y files can also be downloaded from the USGS Coastal and Marine Geoscience Data System (<http://cmgds.marine.usgs.gov>).
Supplemental_Information:
The USGS Saint Petersburg Coastal and Marine Science Center (SPCMSC) - St. Petersburg, Fla., assigns a unique identifier to each cruise or field activity. For example, 13BIM02 indicates the data were collected in 2013 during the second field activity for that project in that calendar year. Refer to <http://walrus.wr.usgs.gov/infobank/programs/html/definition/activity.html> for a detailed description of the method used to assign the cruise ID. The naming convention used for each subbottom line is as follows: yye##a, where 'yy' are the last two digits of the year in which the data were collected, 'e' is a 1-letter abbreviation for the equipment type (for example, c for 424 chirp), '##' is a 2-digit number representing a specific track, and 'a' is a letter representing a section of the line if recording was prematurely terminated or rerun for quality or acquisition problems. All Chirp systems use a signal of continuously varying frequency; the system used during this survey produces high-resolution, shallow-penetration (typically less than 75-milliseconds (ms)) profile images of sub-seafloor stratigraphy. The towfish contains a transducer that transmits and receives acoustic energy and is typically towed 1–2 meters (m) below the sea's surface. As transmitted acoustic energy intersects density boundaries, such as the seafloor or sub-surface sediment layers, energy is reflected back toward the transducer, received, and recorded by a PC-based seismic acquisition system. This process is repeated at regular intervals (for example, 0.125 seconds (s)) and returned energy is recorded for a specific duration (for example, 50 ms). In this way, a two-dimensional (2-D) vertical image of the shallow geologic structure beneath the towfish is produced. The seismic source utilized during 13BIM02 and 13BIM07 consisted of an EdgeTech SB-424 towfish running Discover v. 3.51 acquisition software and towed 2 m behind the Global Positioning System (GPS) antenna. The data were acquired using a frequency sweep of 4–20 kilohertz (kHz), a 43 kHz sample frequency, and a recording length of approximately 65 ms. Based on survey speeds of 3.5 knots, the shot spacing was about 0.450 m. The binary portion of the unprocessed seismic data is stored in SEG Y rev. 0 (Barry and others, 1975), IBM float format, which is a standard digital format that can be read and manipulated by most seismic processing software packages; the first 3,200 bytes of the file header are in American Standard Code for Information Interchange (ASCII) format instead of Extended Binary Coded Decimal Interchange Code (EBCDIC) format. The SEG Y formatted trace files have a .sgy extension. The SEG Y files may be downloaded and processed with commercial or public domain software such as Seismic Unix (SU) (Cohen and Stockwell, 2010). Also provided are examples of SU scripts that allow users to remove navigation fixes from the SEG Y headers, along with the fix provided for every 1,000 shots, and produce a printable Graphics Interface Format (GIF) image of each profile. The printable profiles provided are GIF images gained using SU software. Refer to the Software page of this report for links to example SU processing scripts and USGS software for viewing the SEG Y files (Zihlman, 1992).
  1. How might this data set be cited?
    Forde, Arnell S., Miselis, Jennifer L., Flocks, James G., Bernier, Julie C., and Wiese, Dana S., 2014, Archive of Digital Chirp Subbottom Profile Data Collected During USGS Cruises 13BIM02 and 13BIM07 Offshore of the Chandeleur Islands, Louisiana, 2013: U.S. Geological Survey Data Series 897, U.S. Geological Survey, St. Petersburg, Fla..

    Online Links:

  2. What geographic area does the data set cover?
    West_Bounding_Coordinate: -88.911767
    East_Bounding_Coordinate: -88.832483
    North_Bounding_Coordinate: 30.085831
    South_Bounding_Coordinate: 30.017011
  3. What does it look like?
    <http://pubs.usgs.gov/ds/0897/maps/13bim02_07_studyarea.jpg> (JPEG)
    Figure 1. Location map of all digital chirp subbottom data collected during USGS Field Activities 13BIM02 and 13BIM07. This map was created at a scale of 1:100,000.
    <http://pubs.usgs.gov/ds/0897/maps/13bim02_location.jpg> (JPEG)
    Figure 3. Detailed trackline map of digital chirp subbottom data collected during USGS Field Activity 13BIM02. This map was created at a scale of 1:50,000.
    <http://pubs.usgs.gov/ds/0897/maps/13bim07_location.jpg> (JPEG)
    Figure 4. Detailed trackline map of digital chirp subbottom data collected during USGS Field Activity 13BIM07. This map was created at a scale of 1:50,000.
  4. Does the data set describe conditions during a particular time period?
    Beginning_Date: 05-Jul-2013
    Ending_Date: 01-Sep-2013
    Currentness_Reference:
    Data collection interval
  5. What is the general form of this data set?
    Geospatial_Data_Presentation_Form: Tabular, vector, and raster digital data
  6. How does the data set represent geographic features?
    1. How are geographic features stored in the data set?
      Indirect_Spatial_Reference:
      Horizontal X and Y locations (latitude and longitude in Zone 16 UTM coordinates) for each shot are provided as ASCII text files, along with the date and time (Universal Coordinated Time (UTC)) the shot was recorded.
    2. What coordinate system is used to represent geographic features?
      Horizontal positions are specified in geographic coordinates, that is, latitude and longitude. Latitudes are given to the nearest 0.0197885540. Longitudes are given to the nearest 0.0227288676. Latitude and longitude values are specified in Decimal Degrees. The horizontal datum used is D WGS 84.
      The ellipsoid used is WGS 1984.
      The semi-major axis of the ellipsoid used is 6378137.0.
      The flattening of the ellipsoid used is 1/298.257223563.
  7. How does the data set describe geographic features?
    13bim02.txt, 13bim07.txt, s13bim02.txt, s13bim07.txt, 13bim02_s.txt and 13bim07_s.txt
    Shotpoint navigation files (Source: SEG Y headers (<http://www.seg.org/publications/tech-stand>).)
    FID*
    Internal feature number. (Source: Esri) Sequential unique whole numbers that are automatically generated.
    Shape*
    Feature geometry. (Source: Esri) Coordinates defining the features.
    UTMX
    UTM-X coordinate (Zone 16) (Source: Universal Transverse Mercator Geographic Coordinate System)
    Range of values
    Minimum:322674
    Maximum:323285
    Units:meters
    UTMY
    UTM-Y coordinate (Zone 16) (Source: Universal Transverse Mercator Geographic Coordinate System)
    Range of values
    Minimum:3322649
    Maximum:3323733
    Units:meters
    Line
    Trackline number (Source: U.S. Geological Survey) The naming convention used for each subbottom line is as follows: yye##a, where 'yy' are the last two digits of the year in which the data were collected, 'e' is a 1-letter abbreviation for the equipment type (for example, c for Chirp), '##' is a 2-digit number representing a specific track, and 'a' is a letter representing a section of the line if recording was prematurely terminated or rerun for quality or acquisition problems.
    Shot
    Shotpoint number (Source: U.S. Geological Survey)
    Range of values
    Minimum:1
    Maximum:11000
    Lon
    Longitude (decimal degrees) (Source: World Geodetic System 1984 Geographic Coordinate System)
    Range of values
    Minimum:-88.839000
    Maximum:-88.832483
    Units:decimal degrees
    Lat
    Latitude (decimal degrees) (Source: World Geodetic System 1984 Geographic Coordinate System)
    Range of values
    Minimum:30.022103
    Maximum:30.031792
    Units:decimal degrees
    YEAR
    Year (Source: U.S. Geological Survey)
    Range of values
    Minimum:2013
    Maximum:2013
    DOY:HR:MIN:SEC
    Day of year:hour:minute:second (Source: U.S. Geological Survey) Day of year, hour, minute and second of data acquisition
    Entity_and_Attribute_Overview:
    Binary data file: Trace data are available as binary files in SEG Y format. These files have a .sgy extension and range in size from 2.5 to 123 MB. These data can be found by going to <http://cmgds.marine.usgs.gov>.
    Entity_and_Attribute_Overview:
    Graphic image file: Printable versions of the subbottom profiles are available as GIF images; links to these images can be found on the Profiles page of this report or by going to <http://pubs.usgs.gov/ds/0897/profiles/printable/>.
    Entity_and_Attribute_Overview:
    Navigation file: Navigation files are available as ASCII text files. Provided are raw (unprocessed) shotpoint navigation files (13c**.txt), processed shotpoint navigation (13bim02.txt and 13bim07.txt), processed 1,000-shot-interval locations (s13bim02.txt and s13bim07.txt), and start of line files (13bim02_s.txt and 13bim07_s.txt). Attributes [FID, Shape] marked above with an asterisk (*) were created by Esri ArcGIS and are used exclusively by the shapefiles created with ArcMap; these attributes are not included in the original navigation files. All remaining attributes listed above, under the Detailed_Description section, that do not have an accompanying asterisk are found in the processed navigation files. Raw and processed navigation data files can be found by going to <http://pubs.usgs.gov/ds/0897/nav/>.
    Entity_and_Attribute_Overview:
    GIS file: The GIS data is provided as a .zip file composed of Esri map documents, shapefiles, and metadata.
    Entity_and_Attribute_Detail_Citation: Information is derived from SEG Y headers.

Who produced the data set?

  1. Who are the originators of the data set? (may include formal authors, digital compilers, and editors)
    • Arnell S. Forde
    • Jennifer L. Miselis
    • James G. Flocks
    • Julie C. Bernier
    • Dana S. Wiese
  2. Who also contributed to the data set?
    Funding and (or) support for this study was provided by the USGS Coastal and Marine Geology Program. We thank Research Vessel (R/V) Sallenger captains Patrick Dickhudt of the USGS Woods Hole Coastal and Marine Science Center (WHCMSC) and B.J. Reynolds (SPCMSC) for their assistance in data collection and Will Pfeiffer for his assistance with bathymetry data processing. This document was improved by reviews from Mark Hansen and Stanley Locker of the USGS - St. Petersburg, Fla. Disc Image Credit: Schmaltz, Jeff, MODIS Rapid Response Team at the National Aeronautics and Space Administration Goddard Space Flight Center, 2004, UnitedStates.A2004106.1855.500m.jpg. Also available on-line at <http://eoimages.gsfc.nasa.gov/ve/6886/UnitedStates.A2004106.1855.500m.jpg>
  3. To whom should users address questions about the data?
    Arnell S. Forde
    U.S. Geological Survey
    Geologist
    600 4th Street South
    Saint Petersburg, FL
    USA

    (727) 502-8000 (voice)
    aforde@usgs.gov

Why was the data set created?

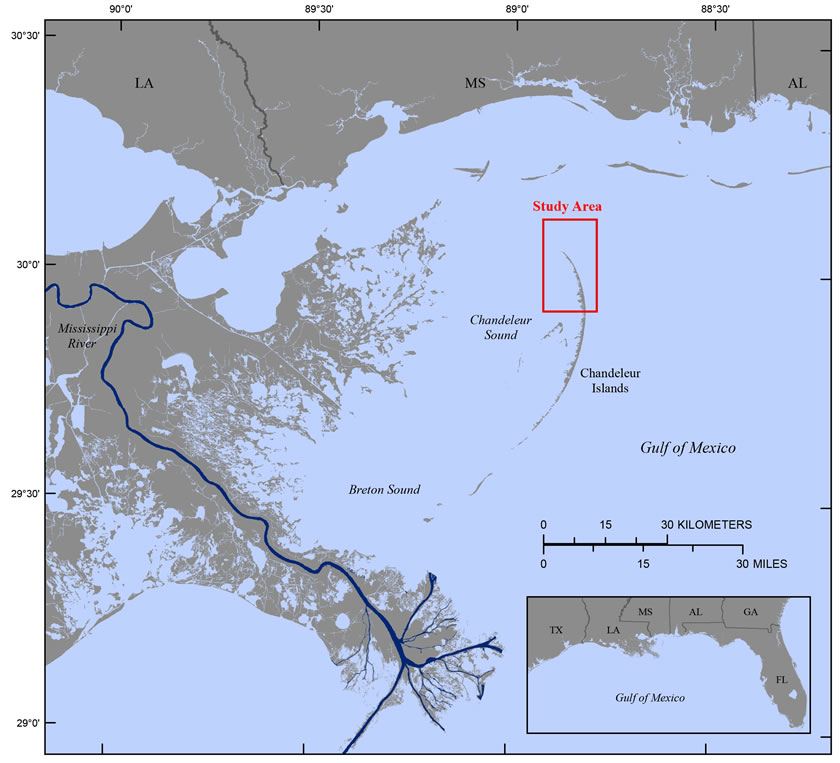
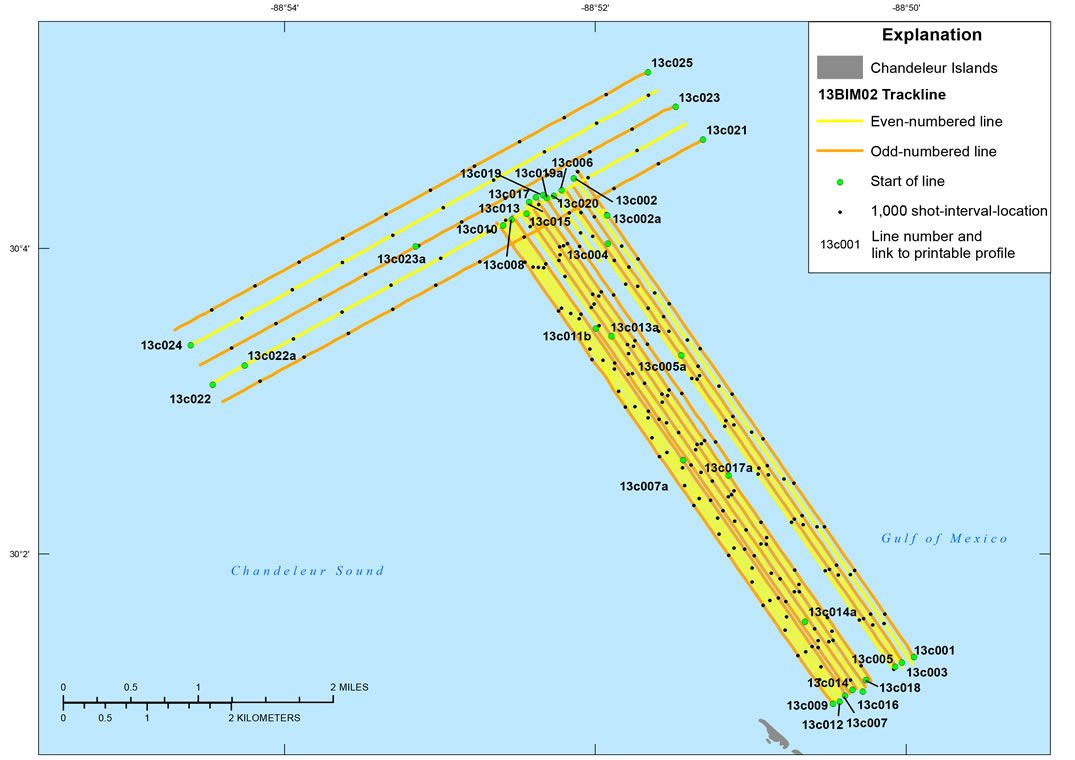
To archive all digital chirp subbottom profile data and associated files collected during cruises 13BIM02 and 13BIM07.

How was the data set created?

  1. From what previous works were the data drawn?
  2. How were the data generated, processed, and modified?
    Date: 2013 (process 1 of 6)
    Chirp processing: The SEG Y data were processed with Seismic Unix software to produce gained GIF images of the subbottom profiles included in this report. A representative chirp data processing sequence consisted of (1) removing navigation data for each shot and converting it to SU format, (2) applying automatic gain control, (3) generating a PostScript image of the traces, and (4) converting the PostScript image to a GIF image. For additional SU processing and script details, please refer to <http://pubs.usgs.gov/ds/0897/software/su/readme.txt>. Person who carried out this activity:
    Arnell S. Forde
    U.S. Geological Survey
    Geologist
    600 4th Street South
    St. Petersburg, FL

    (727) 502-8000 (voice)
    aforde@usgs.gov
    Data sources used in this process:
    • SEG Y
    Data sources produced in this process:
    • printable/SEG Y.gif
    Date: 2013 (process 2 of 6)
    Navigation processing: Shotpoint navigation, start of line, and 1,000-shot-interval location files were extracted using Seismic Unix software and output as ASCII text files; they were then processed with PROJ.4.7.0 (<http://trac.osgeo.org/proj/>) software to generate Universal Transverse Mercator (UTM) coordinates (WGS84, Zone 16, meters) from latitude and longitude coordinates. Text files for each seismic line were concatenated into comma-delimited text files (for use with Esri (Environmental Systems Research Institute) software); one containing unique shotpoint positions (13bim02.txt), another containing the 1,000-shot-interval locations (s13bim02.txt), and the last containing start-of-line locations (13bim02_s); which can be viewed within the nav folder. This process was repeated for 13BIM07 navigation data. Person who carried out this activity:
    Arnell S. Forde
    U.S. Geological Survey
    Geologist
    600 4th Street South
    St. Petersburg, FL

    (727) 502-8000 (voice)
    aforde@usgs.gov
    Data sources used in this process:
    • 13c**.txt
    Data sources produced in this process:
    • 13bim02.txt and 13bim07.txt
    • s13bim02.txt and s13bim07.txt
    • 13bim02_s.txt and 13bim07_s.txt
    Date: 2013 (process 3 of 6)
    All 6 concatenated, comma-delimited text files were imported into ArcGIS and saved as either a point or polyline file (in Esri's shapefile format) and used in the maps presented in this archive. Trackline map creation: the trackline maps were created using Esri ArcGIS 10.2.1 software. The processed navigation files, 13bim02.txt and 13bim07.txt, were imported into ArcMap 10.2.1 and processed using the ArcScript "Points to Lines" to create a line shapefile of the cruise tracklines (13bim02_trkln and 13bim07_trkln). The 1,000-shot-interval files, s13bim02.txt and s13bim07.txt, and the start-of-line files, 13bim02_s.txt and 13bim07_s.txt, were imported into ArcMap and saved as point shapefiles 13bim02_shots, 13bim07_shots, 13bim02_sol and 13bim07_sol. Please refer to the shapefile metadata included in the ArcGIS map document in the Software section of this archive for additional details. All maps were exported to Adobe Illustrator v. 14 for further editing and converted into JPEG format with Adobe Dreamweaver v. 12 Build 5861. The maps are unprojected (geographic coordinates, WGS84). The USGS is the originator of all layers used. Please see the ArcGIS readme file for detailed information about the GIS files used in this report. Person who carried out this activity:
    Arnell S. Forde
    U.S. Geological Survey
    Geologist
    600 4th Street South
    St. Petersburg, FL

    (727) 502-8000 (voice)
    aforde@usgs.gov
    Data sources used in this process:
    • 13bim02.txt and 13bim07.txt
    • s13bim02.txt and s13bim07.txt
    • 13bim02_s.txt and 13bim07_s.txt
    Data sources produced in this process:
    • 13bim02_trkln.shp and 13bim07_trkln.shp
    • 13bim02_shots.shp and 13bim07_shots.shp
    • 13bim02_sol.shp and 13bim07_sol.shp
    Date: 2014 (process 4 of 6)
    Data Series preparation: In addition to the process steps described above, the following steps were taken to produce this Data Series report: the handwritten cruise logs were scanned and saved as a PDF file, digital logs were created by J. Bernier using the cruise logs and the personal accounts of crew members and saved as PDF files, and an HTML-based format was used to present the various parts of this archive. Person who carried out this activity:
    Arnell S. Forde
    U.S. Geological Survey
    Geologist
    600 4th Street South
    St. Petersburg, FL

    (727) 502-8000 (voice)
    aforde@usgs.gov
    Date: 24-Jan-2017 (process 5 of 6)
    Keywords section of metadata optimized for discovery in USGS Coastal and Marine Geology Data Catalog. Person who carried out this activity:
    U.S. Geological Survey
    Attn: Alan O. Allwardt
    Contractor -- Information Specialist
    2885 Mission Street
    Santa Cruz, CA

    831-460-7551 (voice)
    831-427-4748 (FAX)
    aallwardt@usgs.gov
    Date: 13-Oct-2020 (process 6 of 6)
    Added keywords section with USGS persistent identifier as theme keyword. Person who carried out this activity:
    U.S. Geological Survey
    Attn: VeeAnn A. Cross
    Marine Geologist
    384 Woods Hole Road
    Woods Hole, MA

    508-548-8700 x2251 (voice)
    508-457-2310 (FAX)
    vatnipp@usgs.gov
  3. What similar or related data should the user be aware of?
    Cohen, J.K., and Stockwell, J.W., Jr., CWP/SU, 2010, Seismic Unix Release 41: A free package for seismic research and processing, Center for Wave Phenomena, Colorado School of Mines.

    Online Links:

    Zihlman, F.N., USGS, 1992, DUMPSEGY V1.0: A program to examine the contents of SEG Y disk-image seismic data: U.S. Geological Survey Open-File Report 92-590.

    Online Links:

    Other_Citation_Details: 28 pages
    Barry, K.M., Cavers, D.A., and Kneale, C.W., 1975, Recommended standards for digital tape formats: Geophysics v. 40, no. 2.

    Online Links:

    Other_Citation_Details: pages 344–352

How reliable are the data; what problems remain in the data set?

  1. How well have the observations been checked?
    The validity or accuracy of marine subbottom profiles is highly qualitative and dependent on equipment and operating condition variables. Visual inspection of the images rendered from the data did not show major anomalies.
  2. How accurate are the geographic locations?
    As the subbottom data were acquired, the position of the vessel was continuously calculated by a CodaOctopus F190 DGPS [Digital Global Positioning System] and subsequently sent to Hypack 2010 navigation software to ensure consistent grid spacing during data collection. Positions were recorded and written to trace headers in latitude and longitude coordinates every 1 s using navigation from the CodaOctopus F190 receiver with OmniSTAR High Performance (HP) correction (accurate to within 20 centimeters (cm)). The approximate 5-m offset between the chirp shot and ship's GPS was not accounted for during acquisition, nor have the ASCII navigation files and or trackline maps been corrected to reflect the offset.
  3. How accurate are the heights or depths?
    These data are not to be used for bathymetry. Two-way travel (TWT) times shown on the printable profile images are relative to the chirp towfish position, not to the sea surface.
  4. Where are the gaps in the data? What is missing?
    These data are collected along tracklines (2-D) and are therefore inherently incomplete.
  5. How consistent are the relationships among the observations, including topology?
    These datasets are from two field activities with consistent instrument calibrations.

How can someone get a copy of the data set?

Are there legal restrictions on access or use of the data?
Access_Constraints: None. These data are held in the public domain.
Use_Constraints:
The U.S. Geological Survey requests to be acknowledged as originator of the data in future products or derivative research.
  1. Who distributes the data set? (Distributor 1 of 1)
    Arnell Forde
    U.S. Geological Survey
    Geologist
    600 4th Street South
    St. Petersburg, FL
    USA

    (727) 502-8000 (voice)
    aforde@usgs.gov
    Contact_Instructions:
    All of this report is available online. The SEG Y files are downloadable from the Coastal and Marine Geoscience Data System (<http://cmgds.marine.usgs.gov>).
  2. What's the catalog number I need to order this data set? U.S. Geological Survey Data Series 897
  3. What legal disclaimers am I supposed to read?
    This DVD publication was prepared by an agency of the United States Government. Although these data were processed successfully on a computer system at the U.S. Geological Survey, no warranty expressed or implied is made regarding the display or utility of the data on any other system, nor shall the act of distribution imply any such warranty. The U.S. Geological Survey shall not be held liable for improper or incorrect use of the data described and (or) contained herein. Reference herein to any specific commercial product, process, or service by trade name, trademark, manufacturer, or otherwise does not constitute or imply its endorsement, recommendation, or favoring by the United States Government or any agency thereof.
  4. How can I download or order the data?
    • Availability in digital form:
      Data format: The SEG Y rev. 0 format (Barry and others, 1975) presented here consists of the following: a 3,600-byte reel identification header, with the first 3,200 bytes consisting of an ASCII header block followed by a 400-byte binary header block, both of which include information specific to line and reel number; a trace data block that follows the reel identification header, with the first 240 bytes of each trace block consisting of the binary trace identification header; and seismic data samples that follow the trace identification header. in format SEG Y rev. 0 Size: 3,598
      Media you can order: DVD (format ISO 9660)
      Note: Unix, Linux, DOS, Macintosh
      Data format: The GIS data is composed of map documents, shapefiles, and metadata. Map documents were created with Esri ArcGIS 10.2.1 software. The shapefiles provided may also be viewed using other versions of Esri desktop software including their free software or ArcGIS Explorer (<http://www.esri.com/software/arcgis/explorer/index.html>). in format map document, shapefile, metadata Size: 33
      Network links: http://pubs.usgs.gov/ds/0897/software/arc/arc.zip
    • Cost to order the data: None, if obtained online; otherwise, prices vary.

    • Special instructions:
      Publications are available from USGS Information Services, Box 25286, Federal Center, Denver, CO 80225-0046 (telephone: 1-888-ASK-USGS, e-mail: infoservices@usgs.gov).
  5. What hardware or software do I need in order to use the data set?
    Use of SEG Y data requires specialized seismic processing software, such as public domain software Seismic Unix (<http://www.cwp.mines.edu/cwpcodes/index.html>).

Who wrote the metadata?

Dates:
Last modified: 13-Oct-2020
Metadata author:
Arnell Forde
U.S. Geological Survey
Geologist
600 4th Street South
St. Petersburg, FL
USA

(727) 502-8000 (voice)
aforde@usgs.gov
Metadata standard:
Content Standard for Digital Geospatial Metadata (FGDC-STD-001-1998)

This page is <https://cmgds.marine.usgs.gov/catalog/spcmsc/13BIM02-07_chirp-met.faq.html>
Generated by mp version 2.9.50 on Tue Sep 21 18:18:29 2021