Archive of Digital Boomer and CHIRP Seismic Reflection Data Collected During USGS Field Activity 08LCA03 in Lake Panasoffkee, Florida, May 2008

Metadata also available as - [Outline] - [Parseable text] - [XML]

Frequently anticipated questions:


What does this data set describe?

Title:
Archive of Digital Boomer and CHIRP Seismic Reflection Data Collected During USGS Field Activity 08LCA03 in Lake Panasoffkee, Florida, May 2008
Abstract:
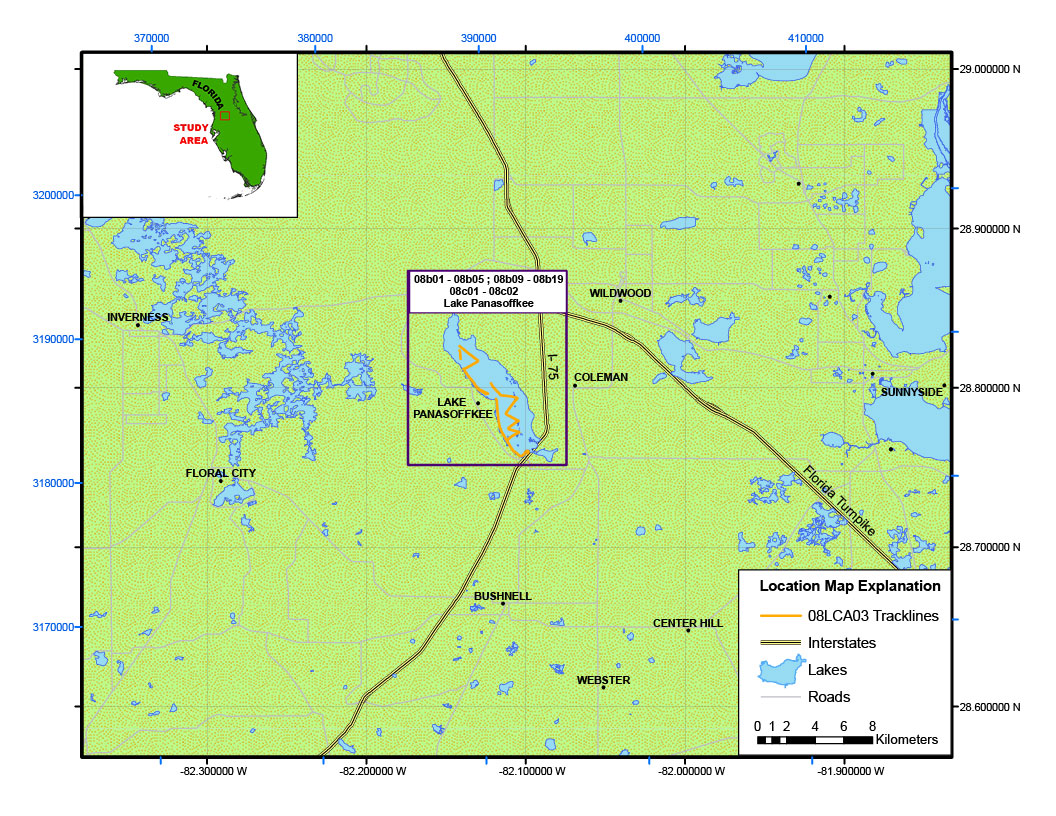
From May 13 to May 14 of 2008, the U.S. Geological Survey conducted geophysical surveys in Lake Panasoffkee, Florida. Thisreport serves as an archive of unprocessed digital boomer and CHIRP seismic reflection data, trackline maps, navigation files, GIS information, FACS logs, and formal FGDC metadata. Filtered and (or) gained digital images of the seismic profiles are also provided.
The archived trace data are in standard Society of Exploration Geophysicists (SEG) SEG-Y format (Barry and others, 1975) and may be downloaded and processed with commercial or public domain software such as Seismic Unix (SU). Example SU processing scripts and USGS software for viewing the SEG-Y files (Zihlman, 1992) are also provided.
For more information on the seismic surveys see http://walrus.wr.usgs.gov/infobank/j/j308fl/html/j-3-08-fl.meta.html
These data are also available via GeoMapApp (http://www.geomapapp.org/) and Virtual Ocean ( http://www.virtualocean.org/) earth science exploration and visualization applications.
Supplemental_Information:
The USGS Florida Integrated Science Center (FISC) - St. Petersburg assigns a unique identifier to each cruise or field activity. For example, 08LCA03 tells us the data were collected in 2008 for the Lakes and Coastal Aquifers (LCA) study and the data were collected during the third field activity for that study in that calendar year. Refer to 
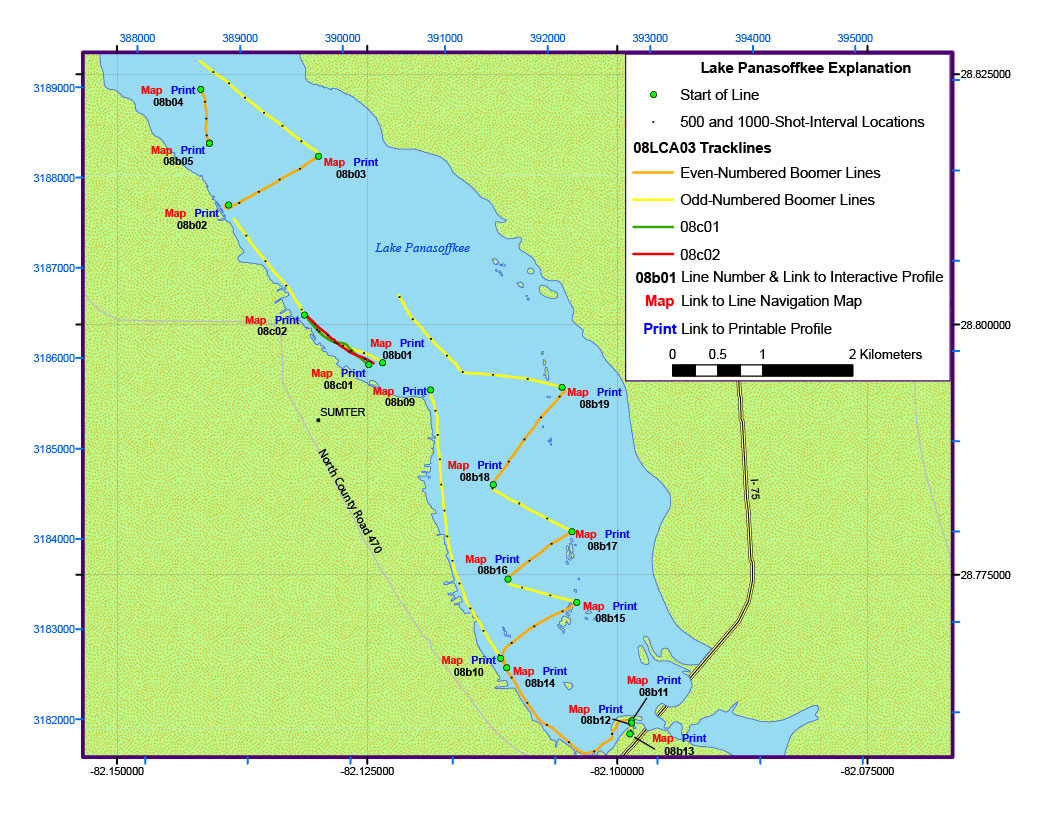
http://walrus.wr.usgs.gov/infobank/programs/html/definition/activity.html for a detailed description of the method used to assign the cruise or field activity ID. The naming convention used for each seismic line is as follows: yye##a, where 'yy' are the last two digits of the year in which the data were collected, 'e' is a 1-letter abbreviation for the equipment type (for example, b for boomer and c for CHIRP), '##' is a 2-digit number representing a specific track, and 'a' is a letter representing the section of a line if recording was prematurely terminated or rerun for quality or acquisition problems. The boomer plate is an acoustic energy source that consists of capacitors charged to a high voltage and discharged through a transducer in the water. The transducer is towed on a sled at the sea surface and, when discharged, emits a short acoustic pulse, or shot, that propagates through the water, sediment column, or rock beneath. The acoustic energy is reflected at density boundaries (such as the seafloor, sediment, or rock layers beneath the seafloor), detected by the receiver, and recorded by a PC-based seismic acquisition system. This process is repeated at timed intervals (for example, 0.5 s) and recorded for specific intervals of time (for example, 100 ms). In this way, a two-dimensional (2-D) vertical image of the shallow geologic structure beneath the ship track is produced. A C-Products C-Boom Low Voltage Boomer System contained a power supply, which provided 100 J per shot. Reflected energy was received by a Teledyne Instruments SDS-55 array and recorded by Chesapeake Technology, Inc. (CTI) SonarWiz.SBP and Triton Elics Delph Seismic v. 2.7 acquisition software. Lines 08b01 - 08b07 were collected using SonarWiz software, and all associated SEG-Y files have a .sgy file extension extension; lines 08b09 - 08b19 used Delph Seismic and have a .tra extension. The streamer contains 10 hydrophones evenly spaced every 1.5 m. During data acquisition, all phones were used. The streamer was positioned approximately 8 m behind the research vessel and laterally separated from the boomer sled by about 3 m. Refer to figures 1 and 2 included with this archive (Data Series 420) for a diagram of the acquisition geometries. The sample frequency of the data was 20 kHz, and record length was 100 ms. Based on survey speeds of approximately 2.5 knots and a shot rate of every 0.500 s, shot spacing was about 0.6425 m. The CHIRP system uses a signal of continuously varying frequency. The towfish is a sound source and receiver, which is typically towed 2 - 5 m above the seafloor. The acoustic energy is reflected at density boundaries (such as the seafloor or sediment layers beneath the seafloor), detected by a receiver, and recorded by a PC-based seismic acquisition system. This process is repeated at timed intervals (for example, 0.125 s) and recorded for specific intervals of time (for example, 50 ms). Likewise, the resulting profiles are two-dimensional vertical images of the shallow geologic structure beneath the ship track. The seismic source employed for CHIRP data collection consisted of an EdgeTech SB-424 towfish running Triton Imaging SB Logger (FSSB) v. 1.6.421 acquisition software and towed about 3 m behind the GPS antenna. The CHIRP SEG-Y data files have a .sgy file extension. The frequency range for line 08c01 was between 4 and 16 kHz and 4 and 24 kHz for line 08c02. Sample frequency of the data was 25 kHz, the shot rate was every 0.250 s, and the record length was approximately 50 ms. Shot spacing was approximately 0.3213 m. For each recorded shot of the CHIRP data, three channels of trace data are collected. Channel 2 is the "real," or in-phase component of the signal, channel 1 is the "imaginary," or quadrature component of the signal, and channel 0 is the "envelope," or product of channels 1 and 2. Only channel 0 was used to produce the profiles presented here. However, all channels are included in the SEG-Y data files. The unprocessed seismic data are stored in SEG-Y, integer, Motorola format, which is a standard digital format that can be read and manipulated by most seismic processing software packages (Barry and others, 1975). The SEG-Y formatted trace files have a .sgy or .tra extension. Additional recording parameters for each trace file can also be found in the .par file associated with each boomer .tra file. However, the .par files included here are only needed to process or display the data with Delph Seismic software. Also provided are example Seismic Unix scripts that allow the user to strip off navigation fixes from the SEG-Y headers, along with a fix for every 500 or 1000 shots, and produce a filtered and (or) gained GIF image of each profile. The printable profiles provided here are GIF images that were filtered and (or) gained using Seismic Unix software. The processed SEG-Y data were exported to Chesapeake Technology, Inc. (CTI) SonarWeb software to produce interactive profiles that allow the user to obtain a geographic location and depth for a cursor position on the profile. This information is displayed in the status bar of the browser. NOTE: The only supported Web browsers that properly display all features of the interactive profiles are Internet Explorer 6 or greater for Windows and Firefox 1.5 or greater for all platforms. For all browsers, the status bar and JavaScript must be enabled. Firefox also requires "Change status bar text" to be checked under Advanced JavaScript Options. If using Internet Explorer 7, you must disable Active Content/Active X controls. To do this, right-click the information bar (found at the top of the page), left-click "Allow Blocked Content...", and then select "Yes." Use of other browsers may result in spurious or no information given in the status window. Firefox may be downloaded at http://www.mozilla.org/products/firefox.
  1. How might this data set be cited?
    Harrison, Arnell S., Dadisman, Shawn V., McBride, W. Scott, Flocks, James G., and Wiese, Dana S., 2009, Archive of Digital Boomer and CHIRP Seismic Reflection Data Collected During USGS Field Activity 08LCA03 in Lake Panasoffkee, Florida, May 2008: U.S. Geological Survey Data Series 420, U.S. Geological Survey, St. Petersburg, FL.

    Online Links:

  2. What geographic area does the data set cover?
    West_Bounding_Coordinate: -82.141740
    East_Bounding_Coordinate: -82.098478
    North_Bounding_Coordinate: 28.826330
    South_Bounding_Coordinate: 28.757145
  3. What does it look like?
    http://pubs.usgs.gov/ds/420/maps/cruisenav/08lca03_location.jpg (JPEG)
    Location map of all digital boomer and CHIRP seismic reflection data collected during USGS field activity 08LCA03. This map was created at a scale of 1:263,700. Refer to the Lineage section below for the trackline map creation process and other details.
    http://pubs.usgs.gov/ds/420/maps/cruisenav/08lca03_panasoffkee.jpg (JPEG)
    Trackline map of digital boomer and CHIRP seismic reflection data collected in Lake Panasoffkee (refer to Lake Panasoffkee area on the location map) during USGS field activity 08LCA03. This map was created at a scale of 1:42,000.
  4. Does the data set describe conditions during a particular time period?
    Beginning_Date: 13-May-2008
    Ending_Date: 14-May-2008
    Currentness_Reference:
    Data collection interval
  5. What is the general form of this data set?
    Geospatial_Data_Presentation_Form: Seismic Reflection Profile Section
  6. How does the data set represent geographic features?
    1. How are geographic features stored in the data set?
      Indirect_Spatial_Reference:
      Horizontal X and Y locations (latitude and longitude coordinates and Zone 17 UTM coordinates) for each shot are provided as ASCII text files, along with the day of year and time (UTC) the shot was recorded.
      This is a Point data set.
    2. What coordinate system is used to represent geographic features?
      Horizontal positions are specified in geographic coordinates, that is, latitude and longitude. Latitudes are given to the nearest 0.0000027. Longitudes are given to the nearest 0.0000027. Latitude and longitude values are specified in Decimal degrees. The horizontal datum used is WGS84.
      The ellipsoid used is Geodetic Reference System 80.
      The semi-major axis of the ellipsoid used is 6378137.
      The flattening of the ellipsoid used is 1/298.257.
  7. How does the data set describe geographic features?
    Entity_and_Attribute_Overview:
    Binary data file: Trace data are available as binary files in SEG-Y format. These files have a .sgy and .tra extension and range in size from 2 to 46 MB (boomer) and 93 to 142 MB (CHIRP).
    Entity_and_Attribute_Overview:
    Graphic image file: Printable profiles are available as GIF images. Interactive profiles are available as HTML pages with accompanying JPEG images. The line navigation maps and trackline maps are JPEG images. The trackline maps contain links to the seismic profiles and line navigation maps.
    Entity_and_Attribute_Overview:
    Navigation file: Navigation files are available as ASCII text files. Provided are raw (unprocessed) shotpoint navigation files, processed shotpoint navigation files, and processed 500- (boomer) and 1000-shot-interval (CHIRP) location files.
    Entity_and_Attribute_Overview:
    GIS file: The GIS project used to create the trackline maps is provided as a .zip file composed of ESRI map documents, shapefiles, and metadata.
    Entity_and_Attribute_Detail_Citation:
    Barry, K.M., Cavers, D.A., and Kneale, C.W., 1975, Recommended standards for digital tape formats: Geophysics, v. 40, no. 2, p. 344-352. Also available on-line at: http://www.seg.org/publications/tech-stand.
    Entity_and_Attribute_Detail_Citation:
    Cohen, J.K., and Stockwell, J.W., Jr., 2005, CWP/SU: Seismic Unix Release 39: A free package for seismic research and processing: Golden, CO, Center for Wave Phenomena, Colorado School of Mines. Available on-line at http://www.cwp.mines.edu/cwpcodes/index.html.
    Entity_and_Attribute_Detail_Citation:
    Zihlman, F.N., 1992, DUMPSEGY V.1.0: A program to examine the contents of SEG-Y disk-image seismic data: U.S. Geological Survey Open-File Report 92-590, 28 p. Also available on-line at http://pubs.er.usgs.gov/usgspubs/ofr/ofr92590.

Who produced the data set?

  1. Who are the originators of the data set? (may include formal authors, digital compilers, and editors)
    • Arnell S. Harrison
    • Shawn V. Dadisman
    • W. Scott McBride
    • James G. Flocks
    • Dana S. Wiese
  2. Who also contributed to the data set?
    Funding for this study was provided by the USGS Water Resources Discipline and Coastal and Marine Geology Program. This document was improved by the reviews of Jordan Sanford (USGS) and Xan Yates (Jacobs Technology Inc.) at the FISC - St. Petersburg, FL.
  3. To whom should users address questions about the data?
    W. Scott McBride
    USGS
    Hydrologist
    10500 University Center Drive, Suite 215
    Tampa, FL
    USA

    (813) 975-8620 (voice)
    wmcbride@usgs.gov

Why was the data set created?

The data archived here were collected as part of the USGS Lakes and Coastal Aquifers (LCA) study.

How was the data set created?

  1. From what previous works were the data drawn?
  2. How were the data generated, processed, and modified?
    Date: 2008 (process 1 of 6)
    Boomer processing: The SEG-Y data were processed with Seismic Unix to produce GIF images of the seismic profiles included in this report. A representative boomer processing sequence consisted of (1) running a bandpass filter of 300-500-2500-3000 Hz, (2) applying a scalar and automatic gain control, (3) displaying PostScript, and (4) converting of PostScript image to a GIF image. CHIRP processing: The SEG-Y data were also processed with Seismic Unix to produce GIF images of the seismic profiles included in this report. A representative CHIRP data processing sequence consisted of (1) stripping off channel 0 for each shot and converting to SU format, (2) applying automatic gain control, (3) displaying PostScript, and (4) converting of PostScript image to a GIF image. All the processed SEG-Y data were then exported to CTI SonarWeb software to produce an interactive version of each profile that allows the user to obtain a geographic location and depth from the profile for a cursor position. Refer to the Supplemental Information section above for details on how to use the interactive profiles.
    Date: 2008 (process 2 of 6)
    Navigation processing: Shotpoint navigation files, 500-shot-interval location files, and 1000-shot-interval location files were extracted from the trace headers of each line using Seismic Unix software. These files were then processed with PROJ.4 software (http://trac.osgeo.org/proj/) to generate UTM coordinates from latitude and longitude coordinates and reformatted for use with Environmental Systems Research Institute (ESRI) GIS software.
    Date: 2008 (process 3 of 6)
    Trackline map creation: The trackline maps provided in this archive were created using the Points to Lines ArcScript (D. Rathert, http://arcscripts.esri.com/details.asp?dbid=12702) along with ESRI ArcGIS 9.2 software and then exported to Adobe Illustrator for further editing. The maps were later converted into JPEG format by Adobe GoLive. The maps are unprojected (geographic coordinates, NAD83). The florida_cities, florida_interstates, and florida_roads layers used on the trackline maps were created by the Florida Division of Emergency, U.S. Census Bureau, and Geographic Data Technology, respectively. The USGS is the originator of all other layers used. A map of trackline navigation for each seismic profile was also produced with CTI SonarWeb software.
    Date: 2008 (process 4 of 6)
    Data Series preparation: In addition to the process steps described above, the following steps were taken to produce this Data Series: the handwritten logs were scanned and saved as PDF files, digital FACS logs were created using the handwritten logs and personal accounts of the crew members and saved as PDF files, and an HTML-based format was used to present the various parts of this archive.
    Date: 24-Jan-2017 (process 5 of 6)
    Keywords section of metadata optimized for discovery in USGS Coastal and Marine Geology Data Catalog. Person who carried out this activity:
    U.S. Geological Survey
    Attn: Alan O. Allwardt
    Contractor -- Information Specialist
    2885 Mission Street
    Santa Cruz, CA

    831-460-7551 (voice)
    831-427-4748 (FAX)
    aallwardt@usgs.gov
    Date: 13-Oct-2020 (process 6 of 6)
    Added keywords section with USGS persistent identifier as theme keyword. Person who carried out this activity:
    U.S. Geological Survey
    Attn: VeeAnn A. Cross
    Marine Geologist
    384 Woods Hole Road
    Woods Hole, MA

    508-548-8700 x2251 (voice)
    508-457-2310 (FAX)
    vatnipp@usgs.gov
  3. What similar or related data should the user be aware of?

How reliable are the data; what problems remain in the data set?

  1. How well have the observations been checked?
    The validity or accuracy of marine seismic reflection profiles is highly qualitative and depends on equipment and operating condition variables. Visual inspection of the images rendered from the data did not show any major anomalies; however, no data were collected for trackline 08b08, so no data exist for this line in this archive.
  2. How accurate are the geographic locations?
    As the seismic reflection data were acquired, the position of the vessel was continuously determined by a Garmin GPS 18 WAAS receiver, which is accurate within 3 - 5 m. Positions were recorded and written to the trace headers in latitude and longitude coordinates about every 1 s. NOTE: A mechanical malfunction caused the recording of duplicate navigation points for each navigation fix during data collection of lines 08b05 - 08b07; repetitive trackline data are listed for each line. The ASCII navigation files and trackline maps have not been corrected to reflect the approximately 8-m offset between the boomer and GPS antenna and about 4-m offset between the CHIRP and GPS antenna. Refer to figures 1 and 2 included with this archive for a diagram of the acquisition geometries, including the GPS offset measurements. Line navigation maps and interactive profiles generated with CTI SonarWeb software have been corrected for the GPS offset.
  3. How accurate are the heights or depths?
    These boomer and CHIRP data are relative to lake level. However, varying recorded static shifts of the data have been known to occur. Therefore, these data are not to be used for bathymetry. Depths shown on the CHIRP profiles are relative to the depth of the towfish, not to lake level.
  4. Where are the gaps in the data? What is missing?
    These data are collected along tracklines (2-D) and are therefore inherently incomplete. Geologic details between lines must be inferred.
  5. How consistent are the relationships among the observations, including topology?
    This data set is from one field activity with consistent instrument calibrations.

How can someone get a copy of the data set?

Are there legal restrictions on access or use of the data?
Access_Constraints: None. These data are held in the public domain.
Use_Constraints:
The U.S. Geological Survey requests to be acknowledged as originator of the data in future products or derivative research.
  1. Who distributes the data set? (Distributor 1 of 1)
    Arnell Harrison
    U.S. Geological Survey
    Geologist
    600 4th Street South
    St. Petersburg, FL
    USA

    (727) 803-8747, ext. 3111 (voice)
    aharrison@usgs.gov
    Contact_Instructions:
    Data may be available on-line only by special arrangement with the distributor above.
  2. What's the catalog number I need to order this data set? U.S. Geological Survey Data Series 420
  3. What legal disclaimers am I supposed to read?
    This CD publication was prepared by an agency of the United States Government. Although these data have been processed successfully on a computer system at the U.S. Geological Survey, no warranty expressed or implied is made regarding the display or utility of the data on any other system, nor shall the act of distribution imply any such warranty. The U.S. Geological Survey shall not be held liable for improper or incorrect use of the data described and (or) contained herein. Reference herein to any specific commercial product, process, or service by trade name, trademark, manufacturer, or otherwise does not constitute or imply its endorsement, recommendation, or favoring by the United States Government or any agency thereof.
  4. How can I download or order the data?
    • Availability in digital form:
      Data format: The SEG-Y standard format (Barry and others, 1975) consists of the following: a 3,600-byte reel identification header, with the first 3,200 bytes consisting of an ASCII header block followed by a 400-byte binary header block, both of which include information specific to line and reel number; a trace data block that follows the reel identification header, with the first 240 bytes of each trace block consisting of the binary trace identification header; and seismic data samples that follow the trace identification header. in format SEG-Y Size: 570
      Media you can order: CD (format ISO 9660)
      Note: UNIX, Linux, DOS, Macintosh
      Data format: The GIS project used to create the trackline maps is composed of map documents, shapefiles, and metadata. Map documents were created with ESRI ArcGIS 9.2 software. The shapefiles provided may also be viewed using other versions of ArcView, ArcGIS, or public domain software ArcExplorer (http://www.esri.com/software/arcexplorer/index.html). in format map document, shapefile, metadata Size: 25.0
      Network links: http://pubs.usgs.gov/ds/420/software/arc/arc.zip
      Data format: The SEG-Y standard format (Barry and others, 1975) consists of the following: a 3,600-byte reel identification header, with the first 3,200 bytes consisting of an ASCII header block followed by a 400-byte binary header block, both of which include information specific to line and reel number; a trace data block that follows the reel identification header, with the first 240 bytes of each trace block consisting of the binary trace identification header; and seismic data samples that follow the trace identification header. in format Download SEGY data Size: 570
      Network links: http://pubs.usgs.gov/ds/420/segy/
    • Cost to order the data: Prices vary.

    • Special instructions:
      Publications are available from USGS Information Services, Box 25286, Federal Center, Denver, CO 80225-0046 (telephone: 1-888-ASK-USGS, e-mail: infoservices@usgs.gov).
  5. What hardware or software do I need in order to use the data set?
    Use of SEG-Y data requires specialized seismic processing software, such as public domain software Seismic Unix (http://www.cwp.mines.edu/cwpcodes/index.html).

Who wrote the metadata?

Dates:
Last modified: 13-Oct-2020
Metadata author:
Arnell Harrison
U.S. Geological Survey
Geologist
600 4th Street South
St. Petersburg, FL
USA

(727) 803-8747, ext. 3111 (voice)
aharrison@usgs.gov
Metadata standard:
Content Standard for Digital Geospatial Metadata (FGDC-STD-001-1998)

This page is <https://cmgds.marine.usgs.gov/catalog/spcmsc/ds-420metadata.faq.html>
Generated by mp version 2.9.50 on Tue Sep 21 18:18:53 2021