Archive of Digitized Analog Boomer Seismic Reflection Data Collected from the Mississippi-Alabama-Florida shelf During Cruises Onboard the R/V Kit Jones, June 1990 and July 1991

Metadata also available as - [Outline] - [Parseable text] - [XML]

Frequently anticipated questions:


What does this data set describe?

Title:
Archive of Digitized Analog Boomer Seismic Reflection Data Collected from the Mississippi-Alabama-Florida shelf During Cruises Onboard the R/V Kit Jones, June 1990 and July 1991
Abstract:
In June of 1990 and July of 1991, the U.S. Geological Survey (USGS) conducted geophysical surveys to investigate the shallow geologic framework of the Mississippi-Alabama-Florida shelf in the northern Gulf of Mexico, from Mississippi Sound to the Florida Panhandle. Work was done onboard the Mississippi Mineral Resources Institute R/V Kit Jones as part of a project to study coastal erosion and offshore sand resources. This report is part of a series to digitally archive the legacy analog data collected from the Mississippi-Alabama SHelf (MASH). The MASH data rescue project is a cooperative effort by the USGS and the Minerals Management Service (MMS). This report serves as an archive of high-resolution scanned Tagged Image File Format (TIFF) and Graphics Interchange Format (GIF) images of the original boomer paper records, navigation files, trackline maps, Geographic Information System (GIS) files, cruise logs, and formal Federal Geographic Data Committee (FGDC) metadata.
Supplemental_Information:
A standardized naming convention was established to allow for better management of scanned trackline images within the MASH data rescue project. Each cruise received a unique field activity identification (ID) based on the year the data were collected, the first two digits of the survey vessel name, and the number of cruises made (to date) by that vessel that year (for example, 91KI2 represents the second cruise made by the R/V Kit Jones in 1991.) The new field activity IDs 90KI1, 90KI2, and 91KI2 presented in this report were originally referred to as Kit Jones 90-1, Kit Jones 90-2, and Kit Jones 91-2 at the USGS in St. Petersburg, FL, and 90013 and 91020 at the USGS in Woods Hole, MA. A table showing the naming convention lineage for cruise IDs in the MASH data rescue series is included as a Portable Data Format (PDF) file. This report serves as an archive of high resolution scanned Tagged Image File Format (TIFF) and Graphics Interchange Format (GIF) images of the original boomer paper records, navigation files, trackline maps, Geographic Information System (GIS) files, cruise logs, and formal Federal Geographic Data Committee (FGDC) metadata for cruises 90KI1, 90KI2, and 91KI2.The boomer system uses an acoustic energy source called a plate, which consists of capacitors charged to a high voltage and discharged through a transducer in the water. The source is towed on a sled, at sea level and when discharged emits a short acoustic pulse, or shot, which propagates through the water and sediment column. The acoustic energy is reflected at density boundaries (such as the seafloor or sediment layers beneath the seafloor), detected by the hydrophone receiver, and the amplitude of the reflected energy is recorded by an Edward P. Curley Lab (EPC) thermal plotter. This process is repeated at timed intervals (for example, 0.5 seconds (s)) and recorded for specific intervals of time (for example, 100 milliseconds (ms)). The timed intervals are also referred to as the shot interval or fire rate. On analog records, the recorded interval is referred to as the sweep, which is the amount of time the recorder stylus takes to sweep from the top of the record to the bottom of the record, thereby recording the amplitude of the reflected energy of one shot. In this way, consecutive recorded shots produce a two-dimensional (2-D) vertical image of the shallow geologic structure beneath the ship track.
  1. How might this data set be cited?
    Sanford, Jordan M., Harrison, Arnell S., Wiese, Dana S., and Flocks, James G., 2009, Archive of Digitized Analog Boomer Seismic Reflection Data Collected from the Mississippi-Alabama-Florida shelf During Cruises Onboard the R/V Kit Jones, June 1990 and July 1991: U.S. Geological Survey Data Series 429.

    Online Links:

  2. What geographic area does the data set cover?
    West_Bounding_Coordinate: -89.200
    East_Bounding_Coordinate: -86.170
    North_Bounding_Coordinate: 30.450
    South_Bounding_Coordinate: 29.159
  3. What does it look like?
    http://pubs.usgs.gov/ds/429//maps/cruisenav/StudyArea_90KI1_91KI2.jpg (JPEG)
    Boundary box of study area for USGS cruises 90KI1, 90KI2, and 91KI2. This map was created at a scale of 1:4,000,000. Refer to the Lineage section below for the trackline map creation process.
    http://pubs.usgs.gov/ds/429//maps/cruisenav/90KI1_91KI2_Location_Map.jpg (JPEG)
    Trackline map of all analog boomer seismic reflection survey tracklines from USGS cruises 90KI1, 90KI2, and 91KI2, with CI-87 vibracore locations. This map was created at a scale of 1:1,450,000. Refer to the Lineage section below for the trackline map creation process.
    http://pubs.usgs.gov/ds/429//maps/cruisenav/90KI1_Location_Map.jpg (JPEG)
    Trackline map of all analog boomer seismic reflection survey tracklines from USGS cruises 90KI1 and 90KI2 with CI-87 vibracore locations. This map was created at a scale of 1:800,000. Refer to the Lineage section below for the trackline map creation process.
    http://pubs.usgs.gov/ds/429//maps/cruisenav/90KI1_Map_1.jpg (JPEG)
    Trackline map of all analog boomer seismic reflection survey tracklines in Map 1 (refer to the 90KI1 and 90KI2 Location map) from USGS cruises 90KI1 and 90KI2, with CI-87 vibracore locations. This map was created at a scale of 1:600,000. Refer to the Lineage section below for the trackline map creation process.
    http://pubs.usgs.gov/ds/429//maps/cruisenav/90KI1_Map_2.jpg (JPEG)
    Trackline map of all analog boomer seismic reflection survey tracklines in Map 2 (refer to the 90KI1 and 90KI2 Location map) from USGS cruises 90KI1 and 90KI2, with CI-87 vibracore locations. This map was created at a scale of 1:600,000. Refer to the Lineage section below for the trackline map creation process.
    http://pubs.usgs.gov/ds/429//maps/cruisenav/91KI2_Location_Map.jpg (JPEG)
    Trackline map of all analog boomer seismic reflection survey tracklines from USGS cruise 91KI2. This map was created at a scale of 1:1,100,000. Refer to the Lineage section below for the trackline map creation process.
    http://pubs.usgs.gov/ds/429//maps/cruisenav/91KI2_Map_A.jpg (JPEG)
    Trackline map of all analog boomer seismic reflection survey tracklines in Map A (refer to the 91KI2 Location map) from USGS cruise 91KI2. This map was created at a scale of 1:600,000. Refer to the Lineage section below for the trackline map creation process.
    http://pubs.usgs.gov/ds/429//maps/cruisenav/91KI2_Map_B.jpg (JPEG)
    Trackline map of all analog boomer seismic reflection survey tracklines in Map B (refer to the 91KI2 Location map) from USGS cruise 91KI2. This map was created at a scale of 1:500,000. Refer to the Lineage section below for the trackline map creation process.
    http://pubs.usgs.gov/ds/429//maps/cruisenav/91KI2_Map_C.jpg (JPEG)
    Trackline map of all analog boomer seismic reflection survey tracklines in Map C (refer to the 91KI2 Location map) from USGS cruise 91KI2. This map was created at a scale of 1:420,000. Refer to the Lineage section below for the trackline map creation process.
  4. Does the data set describe conditions during a particular time period?
    Beginning_Date: 21-Jun-1990
    Ending_Date: 27-Jul-1991
    Currentness_Reference:
    Data collection interval
  5. What is the general form of this data set?
    Geospatial_Data_Presentation_Form: Seismic Reflection Profile Section
  6. How does the data set represent geographic features?
    1. How are geographic features stored in the data set?
      Indirect_Spatial_Reference:
      Horizontal X and Y locations (latitude and longitude) for each shot are provided as text and Microsoft Excel files, and include the date and time (UTC or Local) the shot was recorded.
    2. What coordinate system is used to represent geographic features?
      Horizontal positions are specified in geographic coordinates, that is, latitude and longitude. Latitudes are given to the nearest 0.0000027. Longitudes are given to the nearest 0.0000027. Latitude and longitude values are specified in decimal degrees. The horizontal datum used is WGS84.
      The ellipsoid used is WGS84.
      The semi-major axis of the ellipsoid used is 6378137.
      The flattening of the ellipsoid used is 1/298.257.
  7. How does the data set describe geographic features?

Who produced the data set?

  1. Who are the originators of the data set? (may include formal authors, digital compilers, and editors)
    • Jordan M. Sanford
    • Arnell S. Harrison
    • Dana S. Wiese
    • James G. Flocks
  2. Who also contributed to the data set?
    Funding and (or) support for this study was provided by the USGS Coastal and Marine Geology Program. Funding for the data rescue effort was provided by Minerals Management Service (MMS). Original survey personnel included Jack Kindinger, Mark Byrnes, Randy McBride, Ralph (Monty) Simmons, Jerry Taft, Chuck O'Hara, Ken Parolski, Dana Wiese, Douglas Lockhart, Tom Shelton, and Brian Blanchard. This document was improved by the reviews of Chandra Dreher (Jacobs Technology Inc.) and Shawn Dadisman (USGS) at the FISC in St. Petersburg, FL.
  3. To whom should users address questions about the data?
    James G. Flocks
    U.S. Geological Survey
    Geologist
    600 4th Street South
    St. Petersburg, FL
    USA

    (727) 803-8747, ext. 3012 (voice)
    jflocks@usgs.gov

Why was the data set created?

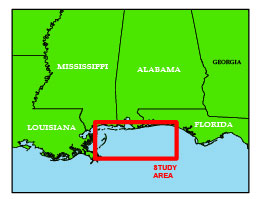
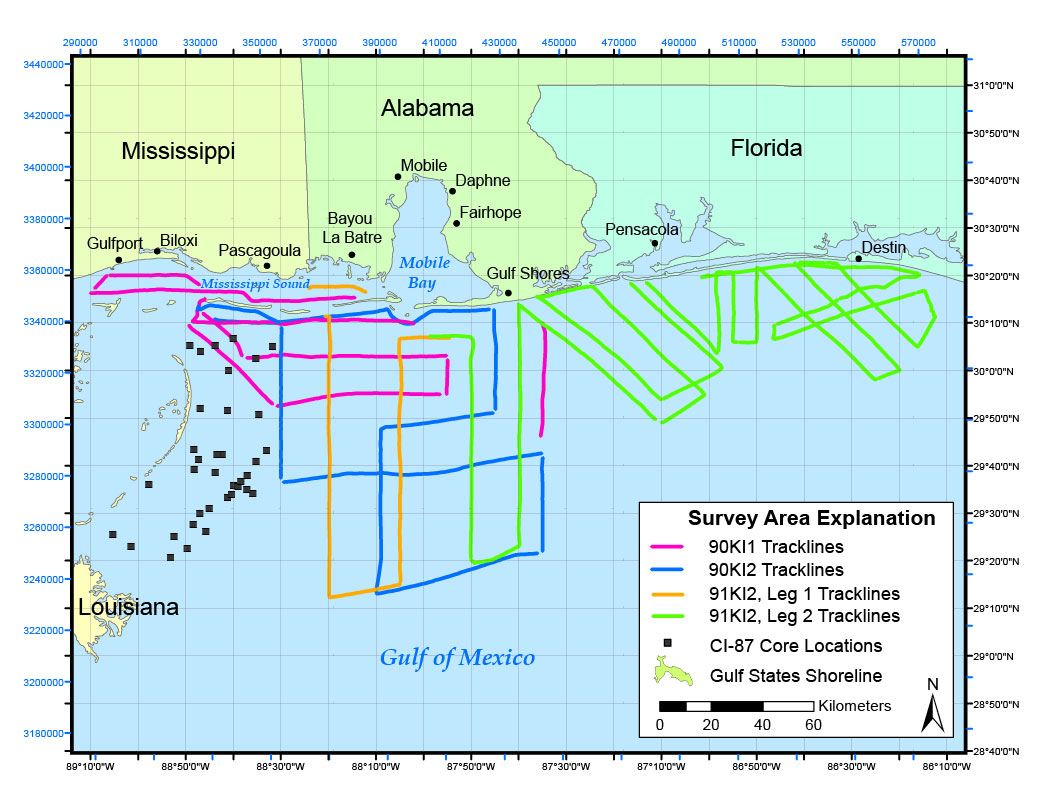
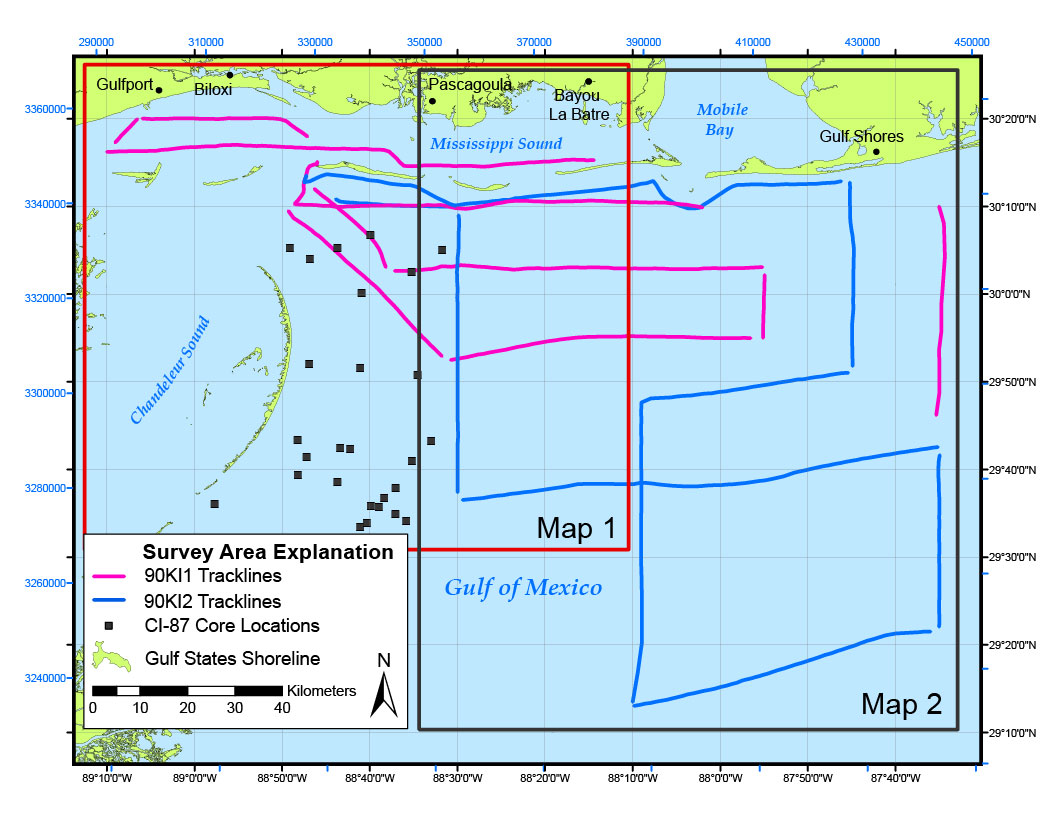
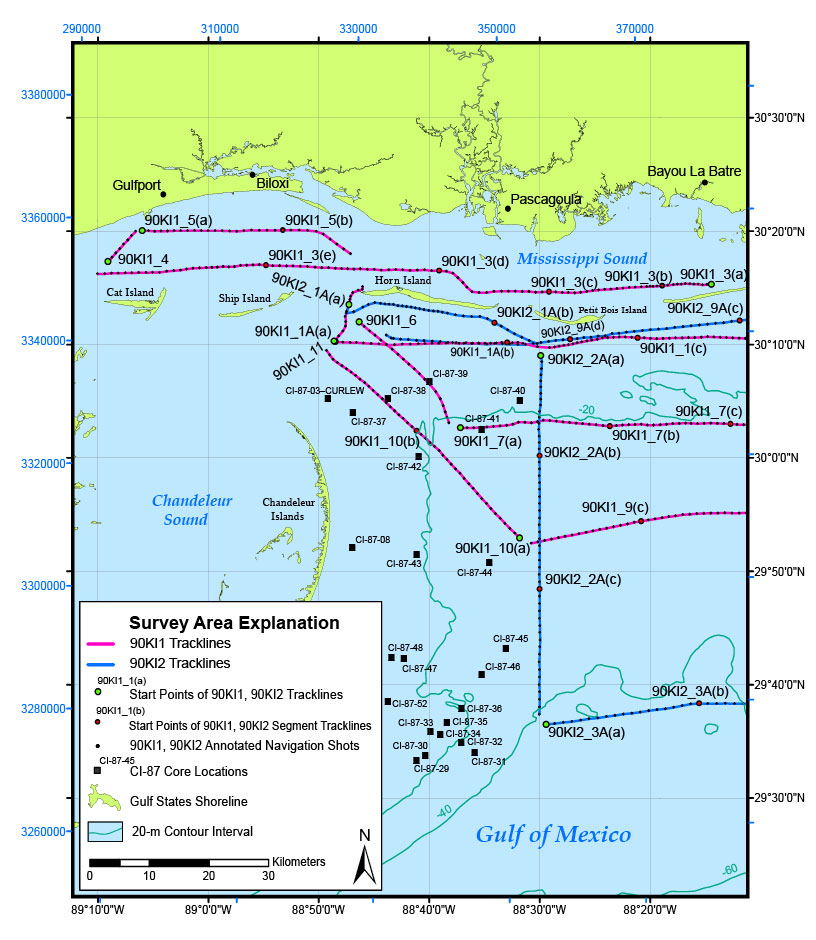
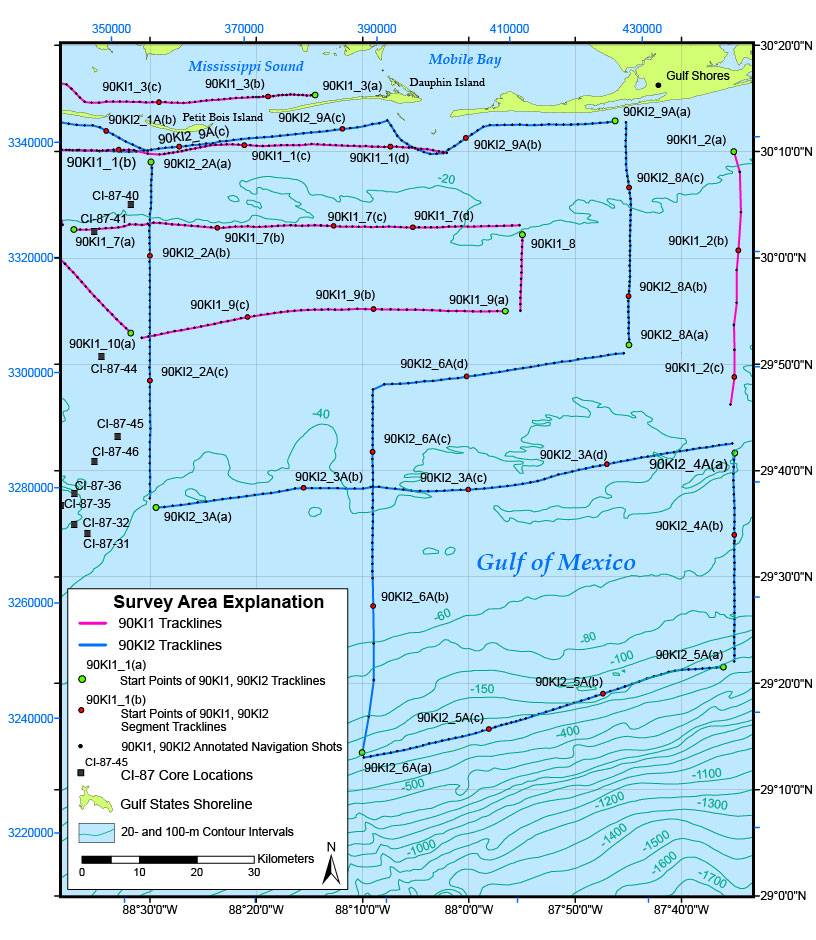
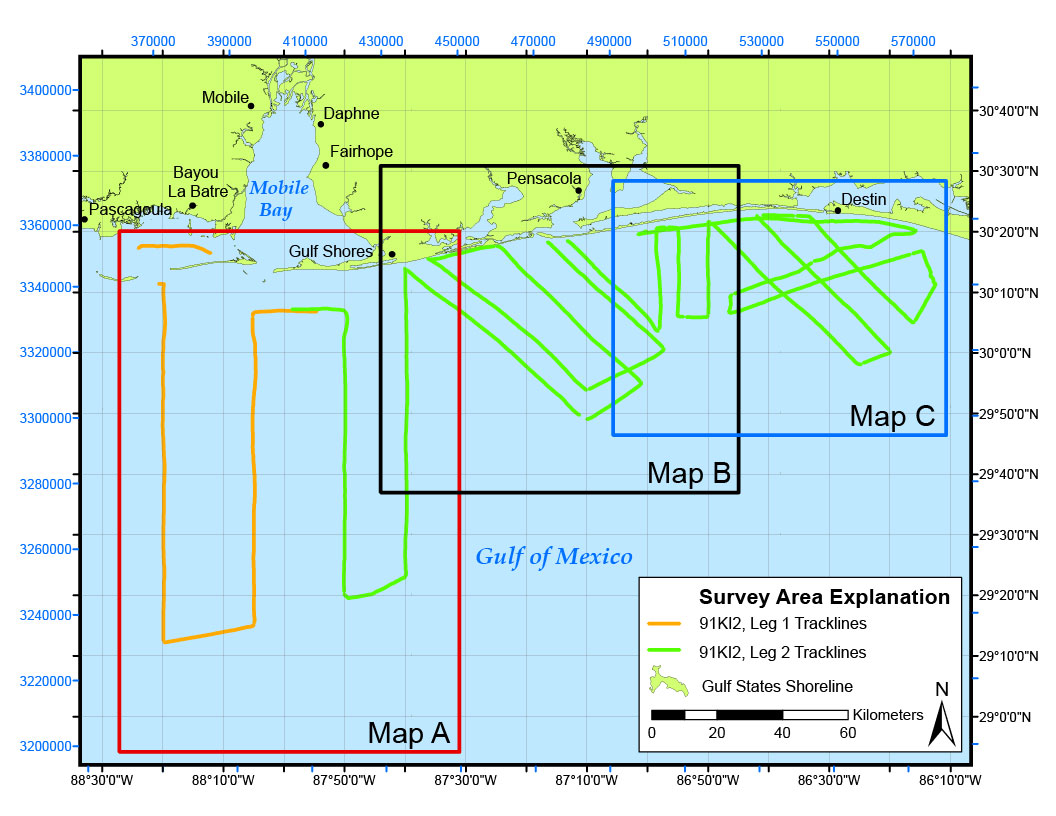
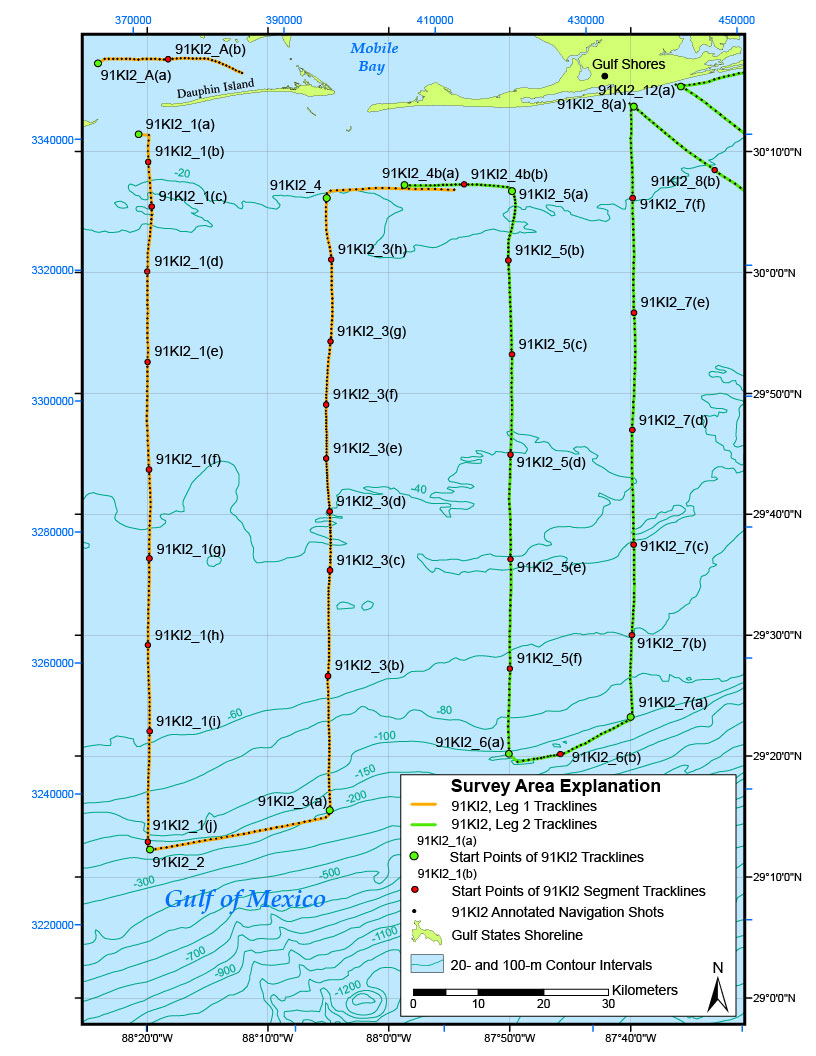
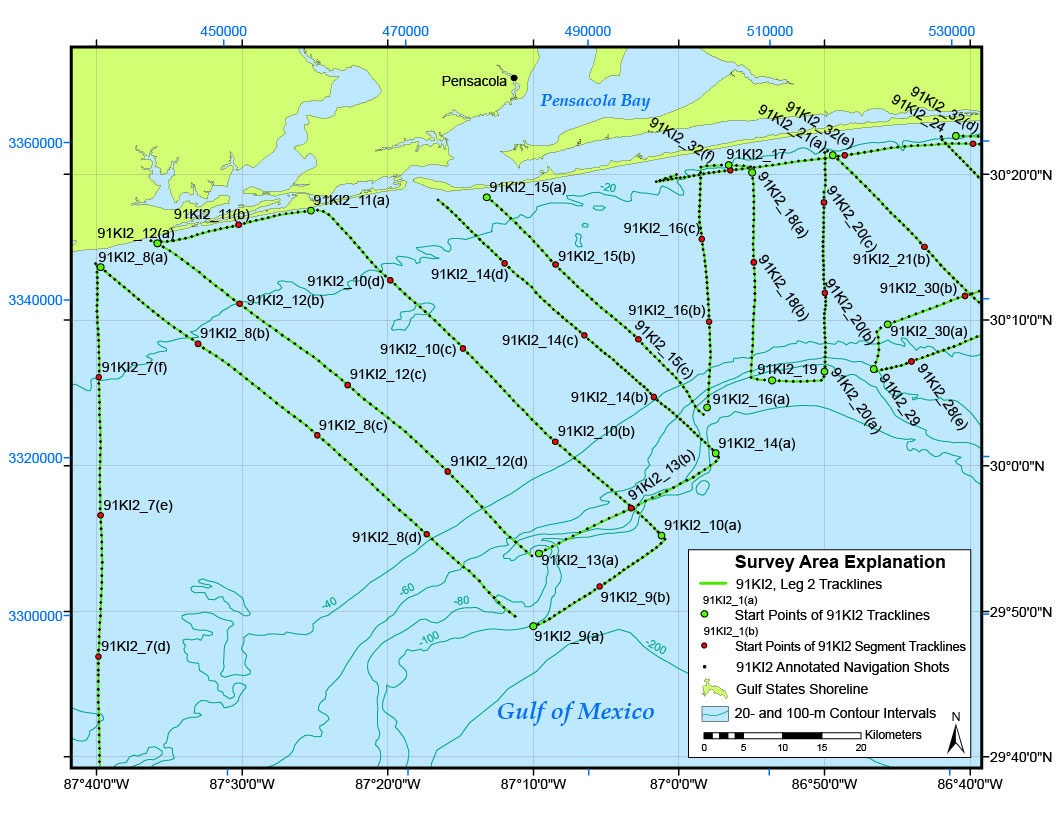
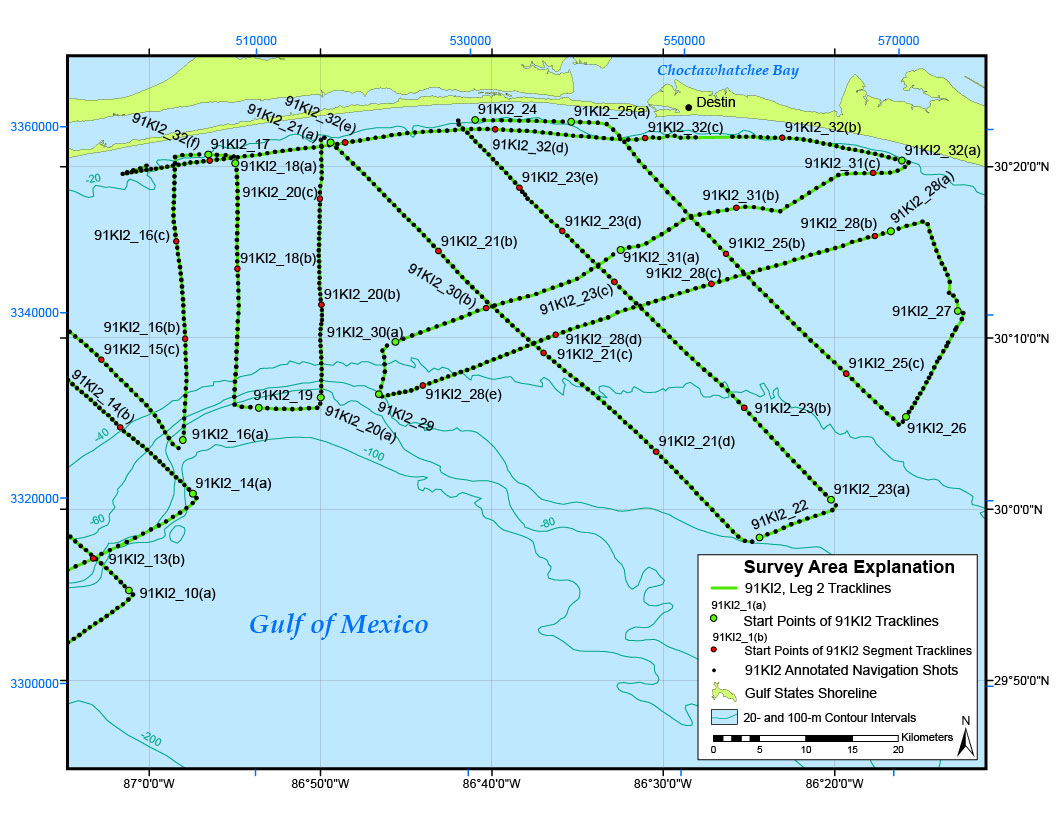
The data archived here were collected as part of a project to develop a geologic interpretation of the Mississippi-Alabama-Florida shelf, study coastal erosion, and identify offshore sand resources.

How was the data set created?

  1. From what previous works were the data drawn?
  2. How were the data generated, processed, and modified?
    Date: 2008 (process 1 of 6)
    Analog seismic processing: Paper records were scanned at 200 dots per inch (dpi) using an IDEAL/Contex Crystal TX 40-inch (1394) large-format scanner and converted to TIFF format using WIDEimage software (version 2.8.1) in the black and white adaptive mode. Whole roll TIFF images of multiple lines were manually cropped into individual survey lines using WIDEimage. Line images longer than 30,000 pixels were separated into smaller segments for editing with Adobe Photoshop Creative Suite 2 (CS2), where a metadata header file was appended to each survey line or line segment. Images of individual survey lines were named by combining the MASH cruise ID with the survey line (or trackline) number using an underscore, for example, 90KI1_2. If survey lines were longer than 30,000 pixels the split segments were identified by appending a letter in alphabetical order to the line name, for example, 90KI1_5(a). The metadata header file appended to each line or line segment was created in Adobe Illustrator CS2. These header-merged images were then converted to grayscale, flattened, and saved as TIFFs with lossless (LZW) image compression. To facilitate easy viewing or printing of the scanned profiles on any computing platform using Web browser software, TIFF images were scaled to 25% (with constrained proportions and bicubic resampling) in Photoshop and saved as GIF images.
    Date: 2008 (process 2 of 6)
    Navigation processing: Raw shotpoint navigation data were formatted for use with ESRI ArcGIS 9.2 software and projected in WGS84 to visually inspect shotpoint accuracy. Point locations were checked against written notes made on the paper records and in the cruise logbooks. Any errors were identified, reviewed, and rectified. Hour and minute values were not altered from the format in the original data files. Attribute information was updated to include the USGS-Woods Hole field activity ID and the new USGS-St. Petersburg MASH cruise ID, and to identify if the survey had been continuous or split into legs.
    Date: 2007 (process 3 of 6)
    Trackline map creation: Three point-shapefile layers were created: all navigation shots (90KI1 and 91KI2_POINTS.shp), start-of-line shots (90KI1 and 91KI2_FIRST.shp), and start-of-segment shots (90KI1 and 91KI2_SEGMENT.shp). A trackline shapefile (90KI1 and 91KI2_LINES.shp) was generated from the POINTS.shp files using the 'locations to paths' function in Hawth's Analysis Tools (free for download at www.spatialecology.com). It should be noted that the ship's track between points is assumed to be a straight line. The attribute tables of the LINES.shp files were manually updated with information for CRUISE and LEG.The trackline maps provided in this archive were created using ESRI ArcGIS 9.2 software and then exported to Adobe Illustrator CS2 for further editing. See the readme.txt file in the ARC folder for more details. The maps were later converted into JPEG format by Adobe GoLive. The Gulf States shoreline polygon was derived from a 1:70,000 vector coastline map of the United States originated by NOAA, 1994. The bathymetry line layer, with 100 m contours supplemented by 20 m contours on the continental shelf, was originated by NOAA, date unknown. The USGS is the originator of all other layers used. These images can be accessed through the links provided below or from within the CRUISENAV folder.
    Date: 2008 (process 4 of 6)
    Data Series preparation: In addition to the process steps described above, the following steps were taken to produce this Data Series report: the handwritten cruise logs were scanned and saved as PDF files, and an HTML-based format was used to present the various parts of this archive.
    Date: 24-Jan-2017 (process 5 of 6)
    Keywords section of metadata optimized for discovery in USGS Coastal and Marine Geology Data Catalog. Person who carried out this activity:
    U.S. Geological Survey
    Attn: Alan O. Allwardt
    Contractor -- Information Specialist
    2885 Mission Street
    Santa Cruz, CA

    831-460-7551 (voice)
    831-427-4748 (FAX)
    aallwardt@usgs.gov
    Date: 13-Oct-2020 (process 6 of 6)
    Added keywords section with USGS persistent identifier as theme keyword. Person who carried out this activity:
    U.S. Geological Survey
    Attn: VeeAnn A. Cross
    Marine Geologist
    384 Woods Hole Road
    Woods Hole, MA

    508-548-8700 x2251 (voice)
    508-457-2310 (FAX)
    vatnipp@usgs.gov
  3. What similar or related data should the user be aware of?

How reliable are the data; what problems remain in the data set?

  1. How well have the observations been checked?
    The validity or accuracy of marine seismic reflection profiles is highly qualitative and depends on equipment and operating condition variables. Visual inspection of the images rendered from the data did not show any major anomalies. All scanned images contain handwritten and plotter-generated annotations.
  2. How accurate are the geographic locations?
    As the seismic reflection data were acquired, the position of the vessel was recorded using GPS and LOng RAnge Navigation (LORAN)-C systems; a description of the navigation acquistion system (1,445-KB PDF) has been provided in the RAW subfolder located within the NAVIGATION folder. The accuracy of the LORAN-C varied from 528 to 1,320 ft, with repeatable accuracy between 60 and 300 ft (http://www.navcen.uscg.gov/loran/handbook/h-book.htm.)Positions were recorded in latitude and longitude coordinates every 5 min and appear on the seismic profiles as incremental, hand-annotated vertical event marks. Navigation data were obtained as .dat files, opened using Notepad, and saved as tab-deliminated text files.
  3. How accurate are the heights or depths?
    Boomer data are relative to sea level. However, varying recorded static shifts of the data have been known to occur. Therefore, these data are not to be used for bathymetry.
  4. Where are the gaps in the data? What is missing?
    These data are collected along tracklines (2-D) and are therefore inherently incomplete. Geologic details between lines must be inferred.
  5. How consistent are the relationships among the observations, including topology?
    This data set is from two cruises with consistent instrument calibrations.

How can someone get a copy of the data set?

Are there legal restrictions on access or use of the data?
Access_Constraints: None. These data are held in the public domain.
Use_Constraints:
The U.S. Geological Survey requests to be acknowledged as originator of the data in future products or derivative research.
  1. Who distributes the data set? (Distributor 1 of 1)
    James G. Flocks
    U.S. Geological Survey
    Geologist
    600 4th Street South
    St. Petersburg, FL
    USA

    (727) 803-8747, ext. 3012 (voice)
    jflocks@usgs.gov
    Contact_Instructions: This report is available on DVD.
  2. What's the catalog number I need to order this data set? U.S. Geological Survey Data Series 429
  3. What legal disclaimers am I supposed to read?
    This DVD publication was prepared by an agency of the United States Government. Although these data have been processed successfully on a computer system at the U.S. Geological Survey, no warranty expressed or implied is made regarding the display or utility of the data on any other system, nor shall the act of distribution imply any such warranty. The U.S. Geological Survey shall not be held liable for improper or incorrect use of the data described and (or) contained herein. Reference herein to any specific commercial product, process, or service by trade name, trademark, manufacturer, or otherwise does not constitute or imply its endorsement, recommendation, or favoring by the United States Government or any agency thereof.
  4. How can I download or order the data?
    • Availability in digital form:
      Data format: The uncompressed TIFF image files of the whole survey line or line segment (if greater than 30,000 pixels) are stored in the ORIGINALS folder as .zip files. Metadata header files, in Adobe Illustrator format, can be found in the HEADERS folder. Compressed line images with headers attached are stored in the PRINTABLE folder in both TIFF and GIF formats. in format TIFF Size: 2420
      Media you can order: DVD (format ISO 9660)
      Note: UNIX, Linux, DOS, Macintosh
      Data format: The GIS project used to create the trackline maps is composed of map documents, shapefiles, and metadata. Map documents were created with ESRI ArcGIS 9.2 software. The shapefiles provided may also be viewed using other versions of ArcView, ArcGIS, or public domain software ArcExplorer (http://www.esri.com/software/arcexplorer/index.html). in format map document, shapefile, metadata Size: 19.0
      Network links: http://pubs.usgs.gov/ds/429/profiles/originals/
    • Cost to order the data: Prices vary.

    • Special instructions:
      Publications are available from USGS Information Services, Box 25286, Federal Center, Denver, CO 80225-0046 (telephone: 1-888-ASK-USGS, e-mail: infoservices@usgs.gov).

Who wrote the metadata?

Dates:
Last modified: 13-Oct-2020
Metadata author:
Jordan M. Sanford
U.S. Geological Survey
Physical Scientist
600 4th Street South
St. Petersburg, FL
USA

(727) 803-8747, ext. 3025 (voice)
jsanford@usgs.gov
Metadata standard:
Content Standard for Digital Geospatial Metadata (FGDC-STD-001-1998)

This page is <https://cmgds.marine.usgs.gov/catalog/spcmsc/ds-429metadata.faq.html>
Generated by mp version 2.9.50 on Tue Sep 21 18:18:53 2021