Archive of Digital Boomer Sub-bottom Data Collected During USGS Field Activities 97LCA01, 97LCA02, and 97LCA03, West-Central and East Coast Florida, February through July 1997

Metadata also available as - [Outline] - [Parseable text] - [XML]

Frequently anticipated questions:


What does this data set describe?

Title:
Archive of Digital Boomer Sub-bottom Data Collected During USGS Field Activities 97LCA01, 97LCA02, and 97LCA03, West-Central and East Coast Florida, February through July 1997
Abstract:
From February through July of 1997, the U.S. Geological Survey conducted geophysical surveys of Lakes Dosson, Halfmoon and Round, Sebastian Inlet, and Indian River Lagoon, within west-central and offshore of the eastern Florida coast. Field activity 97LCA01 was conducted in cooperation with the Southwest Florida Water Management District (SWFWMD), and field activities 97LCA02 and 97LCA03 were conducted in cooperation with the St. Johns River Water Management District (SJRWMD). This report serves as an archive of unprocessed digital boomer sub-bottom data, trackline maps, navigation files, GIS information, cruise log, and formal FGDC metadata. Filtered and gained digital images of the seismic profiles are also provided. The archived trace data are in standard Society of Exploration Geophysicists (SEG) SEG-Y format (Barry and others, 1975) and may be downloaded and processed with commercial or public domain software such as Seismic Unix (SU). Example SU processing scripts and USGS software for viewing the SEG-Y files (Zihlman, 1992) are also provided. For detailed information about the hydrologic setting of Lakes Dosson, Halfmoon and Round and the interpretation of some of these sub-bottom data, see Metz and Sacks (2002) at http://fl.water.usgs.gov/PDF_files/wri02_4032_metz.pdf.
Supplemental_Information:
The USGS Saint Petersburg Coastal and Marine Science Center (SPCMSC) - St. Petersburg, FL, assigns a unique identifier to each cruise or field activity. For example, 97LCA01 tells us the data were collected in 1997 for the Lakes and Coastal Aquifers (LCA) project and the data were collected during the first field activity for that project in that calendar year. Refer to http://walrus.wr.usgs.gov/infobank/programs/html/definition/activity.html for a detailed description of the method used to assign the cruise ID. The naming convention used for each seismic line is as follows: xx#a, where xx is an abbreviation of the survey area the data were collected in, # is a number representing a specific track, and a is a letter representing the section of a line if recording was prematurely terminated or rerun for quality or acquisition problems.The boomer sub-bottom processing system consists of an acoustic energy source that is made up of capacitors charged to a high voltage and discharged through a transducer in the water. The transducer is towed on a sled floating on the water surface and when discharged emits a short acoustic pulse, or shot, that propagates through the water and sediment column. The acoustic energy is reflected at density boundaries (such as the seafloor or sediment layers beneath the lake bottom), detected by the receiver (hydrophone streamer), and recorded by a PC-based seismic acquisition system. This process is repeated at timed intervals (for example, 0.5 s) and recorded for specific intervals of time (for example, 100 ms). In this way, a 2-D vertical image of the shallow geologic structure beneath the ship track is produced.An ORE GeoPulse power supply provided 105 Joules of energy per shot for field activity 97LCA01 and varied between 280/455 Joules for 97LCA03; 97LCA02 used a Huntec ESU-PSU power supply, which provided 480 Joules per shot. Reflected energy, for all three activities, was received by an Innovative Transducers, Inc. (ITI) ST-5 streamer and recorded by Delph Seismic or Delph Win acquisition software. The streamer contains 10 hydrophones evenly spaced every 0.610 m. Phones 4 - 8 (97LCA01); 4 - 9 (97LCA02); and 3 - 8 (97LCA03) were used for all lines, with the exception of 97LCA03, which used phones 3 - 6 on July 15. The streamer was positioned either directly behind the boomer sled, or directly behind the research vessel (parallel to the boomer sled), with a lateral separation of approximately 4 m. Refer to figure 1 included with this archive for a diagram of the acquisition geometries. The sample frequency of the data varied between 12 and 16 kHz, and record lengths between 50 and 100 ms. The shot spacing was highly variable, however, based on survey speeds of 2 knots and a shot rate of every 0.5 s, shot spacing was about 0.514 m.The unprocessed seismic data are stored in SEG-Y, integer, Motorola format, which is a standard digital format that can be read and manipulated by most seismic processing software packages (Barry and others, 1975). The SEG-Y formatted trace files have a .tra extension. Additional recording parameters for each trace file can also be found in the .par file associated with each .tra file. However, the .par files included here are only needed to process or display the data with Delph Seismic software. Also provided are example Seismic Unix scripts that allow the user to strip off navigation fixes from the SEG-Y headers, along with a fix for every 500 shots, and produce a filtered and gained GIF image of each profile. NOTE: Navigation data were recorded to two different sections of the SEG-Y trace headers, creating two navigation datasets. For details, see the Horizontal Positional Accuracy Report under the Data Quality Information section below.The printable profiles provided here are GIF images that were filtered and gained using Seismic Unix software.
  1. How might this data set be cited?
    Forde, Arnell S., Dadisman, Shawn V., Metz, Patricia A., Tihansky, Ann B., Davis, Jeffrey B., and Wiese, Dana S., 2011, Archive of Digital Boomer Sub-bottom Data Collected During USGS Field Activities 97LCA01, 97LCA02, and 97LCA03, West-Central and East Coast Florida, February through July 1997: U.S. Geological Survey Data Series 582, U.S. Geological Survey, St. Petersburg, FL.

    Online Links:

  2. What geographic area does the data set cover?
    West_Bounding_Coordinate: -82.550219
    East_Bounding_Coordinate: -82.400021
    North_Bounding_Coordinate: 28.125013
    South_Bounding_Coordinate: 27.625532
  3. What does it look like?
    http://pubs.usgs.gov/ds/582/maps/97lca01_location.jpg (JPEG)
    Location map of digital boomer sub-bottom data collected during USGS Field Activity 97LCA01. This map was created at a scale of 1:34,000. Refer to the Lineage section below for the trackline map creation process.
    http://pubs.usgs.gov/ds/582/maps/97lca02_03_location.jpg (JPEG)
    Location map of digital boomer sub-bottom data collected during USGS Field Activities 97LCA02 and 97LCA03. This map was created at a scale of 1:264,000.
    http://pubs.usgs.gov/ds/582/maps/dosson.jpg (JPEG)
    Trackline map of digital boomer sub-bottom data collected in Lake Dosson during USGS Field Activity 97LCA01. This map was created at a scale of 1:2,600.
    http://pubs.usgs.gov/ds/582/maps/halfmoon.jpg (JPEG)
    Trackline map of digital boomer sub-bottom data collected in Lake Halfmoon during USGS Field Activity 97LCA01. This map was created at a scale of 1:3,200.
    http://pubs.usgs.gov/ds/582/maps/round.jpg (JPEG)
    Trackline map of digital boomer sub-bottom data collected in Lake Round during USGS Field Activity 97LCA01. This map was created at a scale of 1:2,200.
    http://pubs.usgs.gov/ds/582/maps/indian_river.jpg (JPEG)
    Trackline map of digital boomer sub-bottom data collected in Indian River Lagoon during USGS Field Activity 97LCA03. This map was created at a scale of 1:154,250.
    http://pubs.usgs.gov/ds/582/maps/indian_river2.jpg (JPEG)
    Detailed trackline map showing digital boomer sub-bottom data collected in Indian River Lagoon during USGS Field Activity 97LCA03. This map was created at a scale of 1:48,200.
    http://pubs.usgs.gov/ds/582/maps/sebastian_inlet.jpg (JPEG)
    Trackline map of digital boomer sub-bottom data collected in Sebastian Inlet during USGS Field Activity 97LCA02. This map was created at a scale of 1:113,700.
    http://pubs.usgs.gov/ds/582/maps/sebastian_inlet2.jpg (JPEG)
    Detailed trackline map showing digital boomer sub-bottom data collected in Sebastian Inlet during USGS Field Activity 97LCA02. This map was created at a scale of 1:15,600.
    http://pubs.usgs.gov/ds/582/profiles/printable/ (GIF)
    Directory containing printable images of all sub-bottom profiles.
  4. Does the data set describe conditions during a particular time period?
    Beginning_Date: 24-Feb-1997
    Ending_Date: 15-Jul-1997
    Currentness_Reference:
    Data collection interval
  5. What is the general form of this data set?
    Geospatial_Data_Presentation_Form: Sub-bottom Profile Section
  6. How does the data set represent geographic features?
    1. How are geographic features stored in the data set?
      Indirect_Spatial_Reference:
      Horizontal X and Y locations (latitude and longitude and Zone 17 UTM coordinates) for each shot are provided as ASCII text files, along with the date and time (UTC) the shot was recorded.
      This is a Point data set.
    2. What coordinate system is used to represent geographic features?
      Horizontal positions are specified in geographic coordinates, that is, latitude and longitude. Latitudes are given to the nearest 0.000001. Longitudes are given to the nearest 0.000001. Latitude and longitude values are specified in Decimal degrees. The horizontal datum used is WGS84.
      The ellipsoid used is WGS_1984.
      The semi-major axis of the ellipsoid used is 6378137.000000.
      The flattening of the ellipsoid used is 1/298.25722210100002.
  7. How does the data set describe geographic features?
    97lca01.txt, s97lca01.txt, and 97lca01_s.txt; 97lca02.txt, s97lca02.txt, and 97lca02_s.txt; 97lca03.txt, s97lca03.txt, and 97lca03_s.txt
    Shotpoint navigation files (Source: Society of Exploration Geophysicists (SEG)-Y headers (http://www.seg.org/publications/tech-stand).)
    FID*
    Internal feature number. (Source: ESRI) Sequential unique whole numbers that are automatically generated.
    Shape*
    Feature geometry. (Source: ESRI) Coordinates defining the features.
    UTMX
    UTM-X coordinate (Zone 17) (Source: Universal Transverse Mercator Geographic Coordinate System)
    Range of values
    Minimum:361865
    Maximum:347744
    UTMY
    UTM-Y coordinate (Zone 17) (Source: Universal Transverse Mercator Geographic Coordinate System)
    Range of values
    Minimum:3056504
    Maximum:3112021
    Line
    Trackline number (Source: U.S. Geological Survey)
    Range of values
    Minimum:dosson1
    Maximum:sb_6
    Shot
    Shotpoint number (Source: U.S. Geological Survey)
    Range of values
    Minimum:1
    Maximum:20000
    Lon
    Longitude (decimal degrees) (Source: World Geodetic System 1984 Geographic Coordinate System)
    Range of values
    Minimum:-82.400021
    Maximum:-82.550219
    Lat
    Latitude (decimal degrees) (Source: World Geodetic System 1984 Geographic Coordinate System)
    Range of values
    Minimum:28.125013
    Maximum:27.625532
    YEAR
    Year (Source: U.S. Geological Survey)
    Range of values
    Minimum:1997
    Maximum:1997
    DOY:HR:MIN:SEC
    Day of year:hour:minute:second (Source: U.S. Geological Survey) Day of year, hour, minute and second of data acquisition
    Entity_and_Attribute_Overview:
    Binary data file: Trace data are available as binary files in SEG-Y format. These files have a .tra extension and range in size from 0.4 to 306 MB.
    Entity_and_Attribute_Overview:
    Graphic image file: Printable versions of the sub-bottom profiles are available as GIF images, links to these images can be found on the trackline maps.
    Entity_and_Attribute_Overview:
    Navigation file: Navigation files are available as ASCII text files. Provided are raw (unprocessed) shotpoint navigation files, processed shotpoint navigation files, and processed 1,000-shot-interval location files. Fields/Attributes [FID, Shape] marked above with an asterisk (*) were created by ESRI ArcGIS and are used exclusively by the shapefiles created from the aforementioned .txt files; these fields are not included in the original navigation files. All remaining attributes listed in the above section that do not have an accompanying asterisk are found in 97lca01.txt, s97lca01.txt, and 97lca01_s.txt; 97lca02.txt, s97lca02.txt, and 97lca02_s.txt; 97lca03.txt, s97lca03.txt, and 97lca03_s.txt.
    Entity_and_Attribute_Overview:
    GIS file: The GIS project used to create the trackline maps is provided as a .zip file composed of ESRI map documents, shapefiles, and metadata.
    Entity_and_Attribute_Detail_Citation:
    Barry, K.M., Cavers, D.A., and Kneale, C.W., 1975, Recommended standards for digital tape formats: Geophysics, v. 40, no. 2, p. 344-352. Also available on-line at http://www.seg.org/publications/tech-stand/.
    Entity_and_Attribute_Detail_Citation:
    Metz, P.A., and Sacks, L.A., 2002, Comparison of the hydrogeology and water quality of a ground-water augmented lake with two non-augmented lakes in northwest Hillsborough County, Florida: U.S. Geological Survey Water-Resources Investigations Report 02-4032, 74 p. Also available online at http://fl.water.usgs.gov/PDF_files/wri02_4032_metz.pdf.
    Entity_and_Attribute_Detail_Citation:
    Zihlman, F.N., 1992, DUMPSEGY V1.0: A program to examine the contents of SEG-Y disk-image seismic data: U.S. Geological Survey Open-File Report 92-590, 28 p. Also available on-line at http://pubs.er.usgs.gov/usgspubs/ofr/ofr92590.

Who produced the data set?

  1. Who are the originators of the data set? (may include formal authors, digital compilers, and editors)
    • Arnell S. Forde
    • Shawn V. Dadisman
    • Patricia A. Metz
    • Ann B. Tihansky
    • Jeffrey B. Davis
    • Dana S. Wiese
  2. Who also contributed to the data set?
    Funding and (or) support for this study were provided by the USGS Water Resources Discipline (current name is the Water Mission Area), Coastal and Marine Geology Program, SWFWMD, and SJRWMD. This document was improved by the reviews of Rob Wertz (USGS) and Kyle Kelso (Jacobs Technology Inc.) of the USGS - St. Petersburg, FL.Disc Image Credit: Schmaltz, Jeff, MODIS Rapid Response Team at the NASA Goddard Space Flight Center, 2004, UnitedStates.A2004106.1855.500m.jpg. Also available on-line at http://veimages.gsfc.nasa.gov//6886/UnitedStates.A2004106.1855.500m.jpg
  3. To whom should users address questions about the data?
    Patricia A. Metz
    U.S. Geological Survey
    Hydrologist
    10500 University Center Drive, Suite 215
    Tampa, FL
    USA

    (813) 975-8620, ext. 129 (voice)
    pmetz@usgs.gov

Why was the data set created?

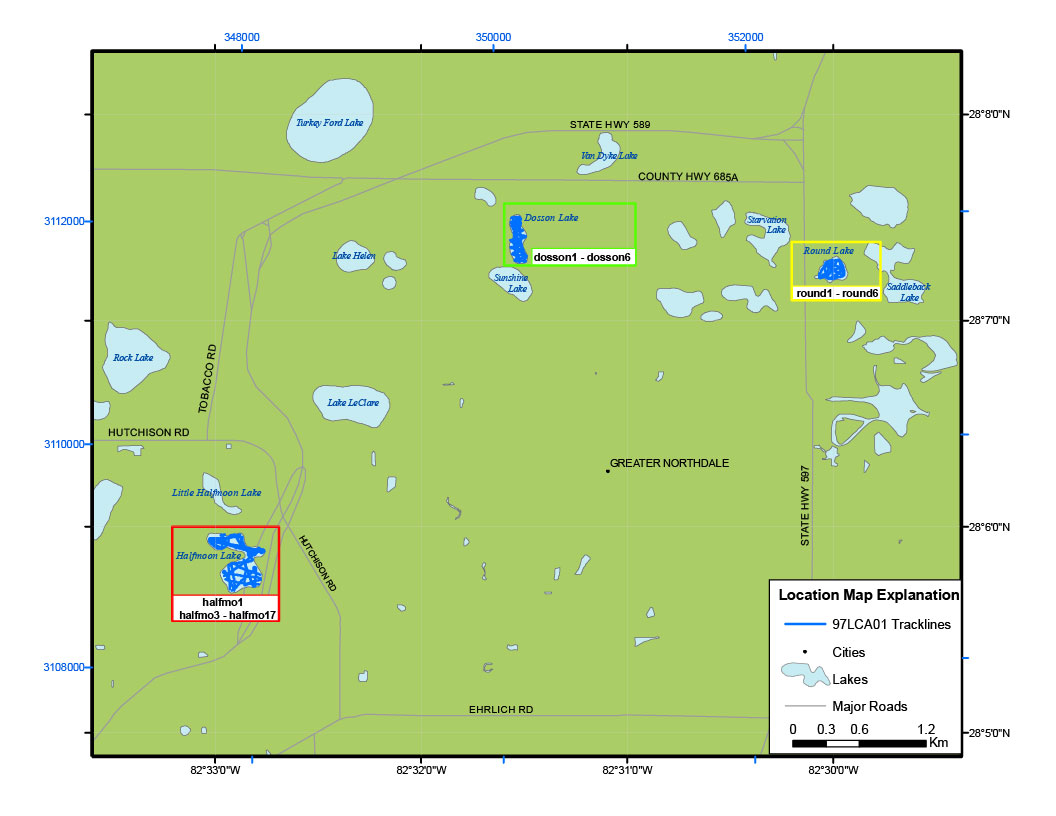
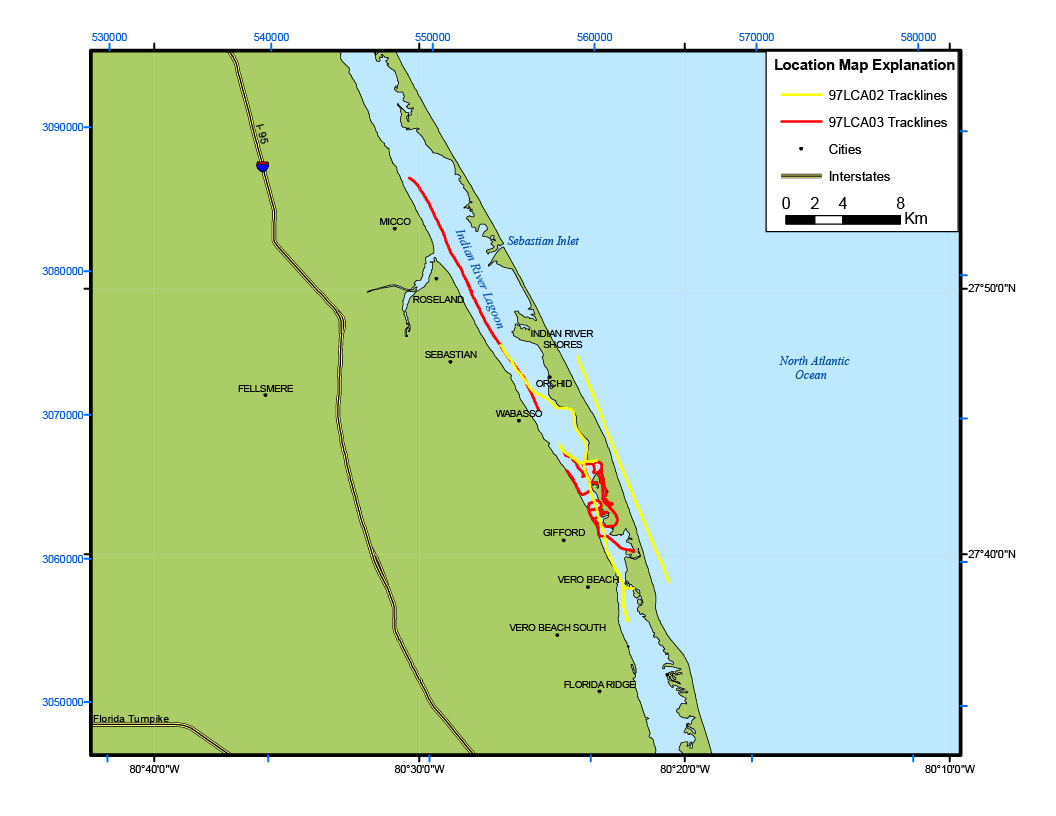
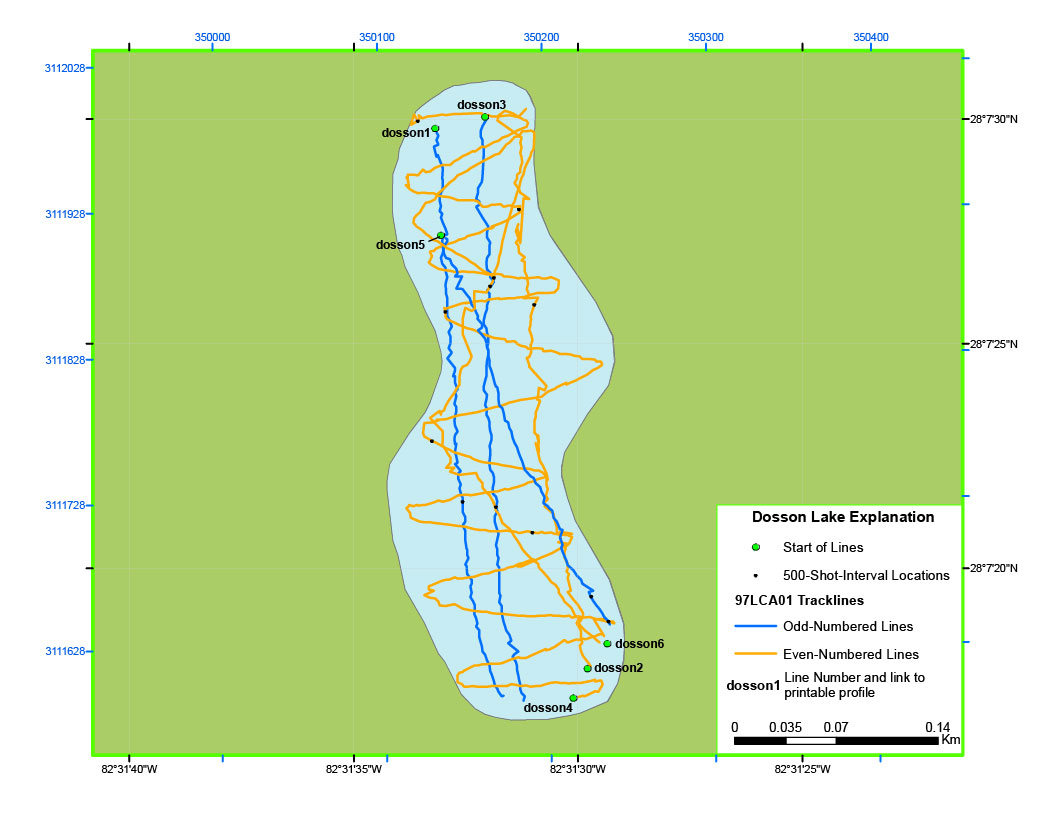
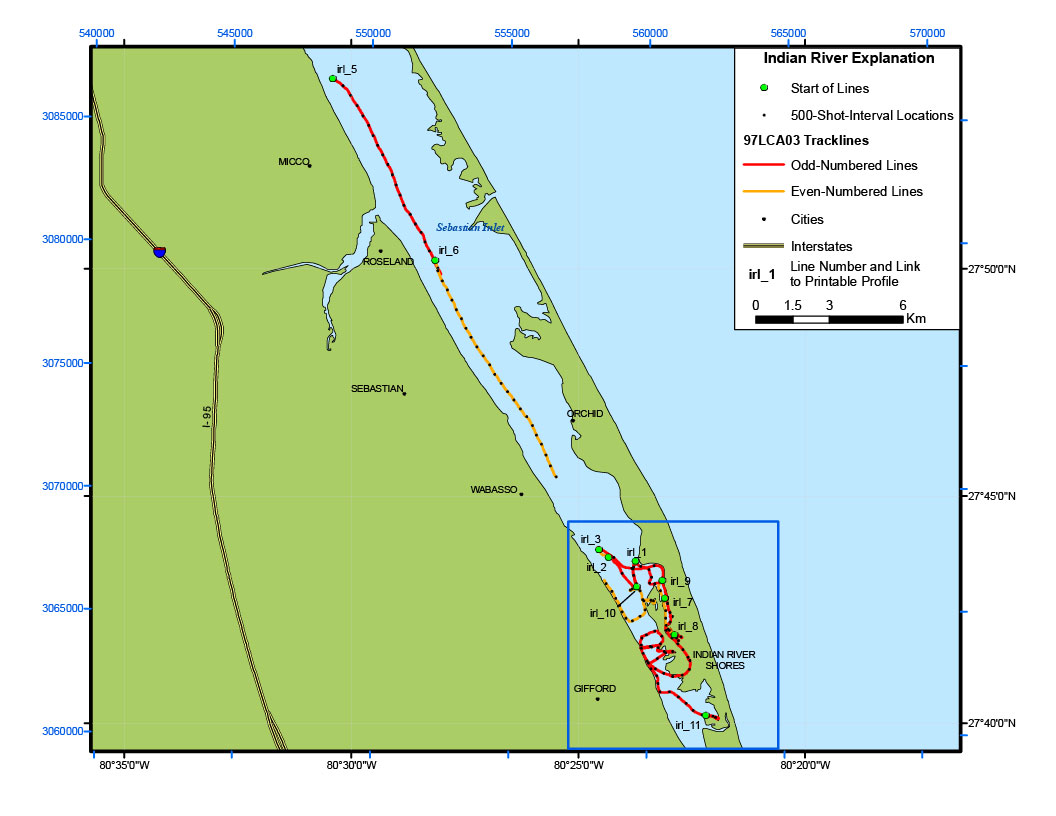
The data archived here were collected as part of the USGS Lakes and Coastal Aquifers (LCA) study.

How was the data set created?

  1. From what previous works were the data drawn?
  2. How were the data generated, processed, and modified?
    Date: 2009 (process 1 of 7)
    Boomer processing: These data were originally recorded in Delph Seismic format onto Iomega Jazz Disk. They were later converted to SEG-Y format using Delph Seismic processing software and archived onto compact disc. The original trace files for line sb_2 were each divided into two or more trace files (for example, sb_2 became sb_2_a and sb_2_b) because the original total number of traces exceeded the maximum allowed by the processing software. The SEG-Y data were processed with Seismic Unix to produce GIF images of the seismic profiles included in this report. A representative boomer processing sequence consisted of (1) running a bandpass filter of 300-500-2500-3000 Hz, (2) applying automatic gain control, (3) displaying PostScript, and (4) converting of PostScript image to a GIF image. Person who carried out this activity:
    Arnell S. Forde
    U.S. Geological Survey
    Geologist
    600 4th Street South
    St. Petersburg, FL

    (727) 803-8747, ext. 3111 (voice)
    aharrison@usgs.gov
    Date: 2009 (process 2 of 7)
    Navigation processing: Shotpoint navigation, start of line, and 1,000-shot-interval location files were extracted using Seismic Unix software and output as ASCII text files; they were then processed with PROJ.4.7.0 (http://trac.osgeo.org/proj/) to generate UTM coordinates from latitude and longitude coordinates. Text files for each seismic line were concatenated into two comma-delimited text files (for use with ESRI software), one containing unique shotpoint positions (97lca01.txt, 97lca02.txt, and 97lca03.txt) and another containing the 1,000 shot interval locations (s97lca01.txt, s97lca02.txt, and s97lca03.txt); both can be viewed within the nav folder, refer to the Browse_Graphic section above for details.
    Date: 2009 (process 3 of 7)
    All concatenated, comma-delimited text files were imported into ArcGIS and saved as either a point or polyline file in the ESRI shapefile format.
    Date: 2009 (process 4 of 7)
    Trackline map creation: The trackline maps provided in this archive were created using the Points to Lines ArcScript (D. Rathert, http://arcscripts.esri.com/details.asp?dbid=12702) along with ESRI ArcGIS 9.3 software and then exported to Adobe Illustrator for further editing. The maps were later converted into JPEG format by Adobe GoLive. Please see the ArcGIS readme file for detailed information about the GIS files used in this report.
    Date: 2009 (process 5 of 7)
    Data Series preparation: In addition to the process steps described above, the following steps were taken to produce this Data Series report: the handwritten cruise logs were scanned and saved as a PDF file, digital logs were created by A. Forde using the cruise logs and personal accounts of the crew members and saved as PDF files, and an HTML-based format was used to present the various parts of this archive.
    Date: 24-Jan-2017 (process 6 of 7)
    Keywords section of metadata optimized for discovery in USGS Coastal and Marine Geology Data Catalog. Person who carried out this activity:
    U.S. Geological Survey
    Attn: Alan O. Allwardt
    Contractor -- Information Specialist
    2885 Mission Street
    Santa Cruz, CA

    831-460-7551 (voice)
    831-427-4748 (FAX)
    aallwardt@usgs.gov
    Date: 13-Oct-2020 (process 7 of 7)
    Added keywords section with USGS persistent identifier as theme keyword. Person who carried out this activity:
    U.S. Geological Survey
    Attn: VeeAnn A. Cross
    Marine Geologist
    384 Woods Hole Road
    Woods Hole, MA

    508-548-8700 x2251 (voice)
    508-457-2310 (FAX)
    vatnipp@usgs.gov
  3. What similar or related data should the user be aware of?

How reliable are the data; what problems remain in the data set?

  1. How well have the observations been checked?
    The validity or accuracy of seismic reflection profiles is highly qualitative and depends on equipment and operating condition variables. Visual inspection of the images rendered from the data did not show any major anomalies.
  2. How accurate are the geographic locations?
    As the sub-bottom data were acquired, the position of the vessel was continuously determined by a Rockwell Collins PLGR GPS receiver, which is accurate to within 3 to 5 m. Positions were recorded and written to the trace headers in latitude and longitude coordinates about every 60 s. The ASCII navigation files and trackline maps have not been corrected to reflect the varing offsets between the boomer and GPS antenna. Refer to figure 1 included with this archive for a diagram of the acquisition geometries, including the GPS offset measurements. NOTE: The navigation data written to the "Source coordinates" SEG-Y trace headers (bytes 73 - 80) are only accurate within 1 s of arc, or 31 m. Additional navigation data were recorded more accurately (between 3 - 5 m) to the "Unassigned" trace headers (bytes 181 - 240) by the Delph Seismic acquisition software, these data were used to produce the trackline maps. Please see the SEG-Y Format page for a detailed description of the SEG-Y data format including byte number assignments and header value descriptions. The Delph Seismic navigation data can be accessed from the Navigation page under the Raw Shotpoint Navigation section.
  3. How accurate are the heights or depths?
    Boomer data are relative to lake and sea level. However, varying recorded static shifts of the data have been known to occur. Therefore, these data are not to be used for bathymetry.
  4. Where are the gaps in the data? What is missing?
    These data are collected along tracklines (2-D) and are therefore inherently incomplete. Geologic details between lines must be inferred. Line halfmo1 was terminated early due to a software malfunction and no data were recorded for line halfmo2. No data were recorded for line irl_4; therefore, it is not included in this archive.
  5. How consistent are the relationships among the observations, including topology?
    These data are from different cruises conducted on different vessels with different acquisition equipment and acquisition geometries; however, for most purposes, the profile data are comparable for all cruises.

How can someone get a copy of the data set?

Are there legal restrictions on access or use of the data?
Access_Constraints: None. These data are held in the public domain.
Use_Constraints:
The U.S. Geological Survey and St. Johns River Water Management District (SJRWMD) request to be acknowledged as originators of the data in future products or derivative research.
  1. Who distributes the data set? (Distributor 1 of 1)
    Arnell Forde
    U.S. Geological Survey
    Geologist
    600 4th Street South
    St. Petersburg, FL
    USA

    (727) 803-8747, ext. 3111 (voice)
    aharrison@usgs.gov
    Contact_Instructions: All of this report is available on-line.
  2. What's the catalog number I need to order this data set? U.S. Geological Survey Data Series 582
  3. What legal disclaimers am I supposed to read?
    This DVD publication was prepared by an agency of the United States Government. Although these data have been processed successfully on a computer system at the U.S. Geological Survey, no warranty expressed or implied is made regarding the display or utility of the data on any other system, nor shall the act of distribution imply any such warranty. The U.S. Geological Survey shall not be held liable for improper or incorrect use of the data described and (or) contained herein. Reference herein to any specific commercial product, process, or service by trade name, trademark, manufacturer, or otherwise does not constitute or imply its endorsement, recommendation, or favoring by the United States Government or any agency thereof.
  4. How can I download or order the data?
    • Availability in digital form:
      Data format: The SEG-Y standard format (Barry and others, 1975) consists of the following: a 3,600-byte reel identification header, with the first 3,200 bytes consisting of an ASCII header block followed by a 400-byte binary header block, both of which include information specific to line and reel number; a trace data block that follows the reel identification header, with the first 240 bytes of each trace block consisting of the binary trace identification header; and seismic data samples that follow the trace identification header. in format SEG-Y Size: 1200
      Network links: http://pubs.usgs.gov/ds/582/segy/97lca01/
      http://pubs.usgs.gov/ds/582/segy/97lca02/
      http://pubs.usgs.gov/ds/582/segy/97lca03/
      Media you can order: DVD (format ISO 9660)
      Note: Unix, Linux, DOS, Macintosh
      Data format: The GIS project used to create the trackline maps is composed of map documents, shapefiles, and metadata. Map documents were created with ESRI ArcGIS 9.3 software. The shapefiles provided may also be viewed using other versions of ESRI desktop software including their free software, ArcGIS Explorer (http://www.esri.com/software/arcgis/explorer/index.html), or GeoMapApp (http://www.geomapapp.org/). in format map document, shapefile, metadata Size: 45.9
      Network links: http://pubs.usgs.gov/ds/582/software/arc/arc.zip
    • Cost to order the data: Prices vary.

    • Special instructions:
      Publications are available from USGS Information Services, Box 25286, Federal Center, Denver, CO 80225-0046 (telephone: 1-888-ASK-USGS, e-mail: infoservices@usgs.gov).
  5. What hardware or software do I need in order to use the data set?
    Use of SEG-Y data requires specialized seismic processing software, such as public domain software Seismic Unix (http://www.cwp.mines.edu/cwpcodes/index.html).

Who wrote the metadata?

Dates:
Last modified: 13-Oct-2020
Metadata author:
Arnell Forde
U.S. Geological Survey
Geologist
600 4th Street South
St. Petersburg, FL
USA

(727) 803-8747, ext. 3111 (voice)
aharrison@usgs.gov
Metadata standard:
Content Standard for Digital Geospatial Metadata (FGDC-STD-001-1998)

This page is <https://cmgds.marine.usgs.gov/catalog/spcmsc/ds-582metadata.faq.html>
Generated by mp version 2.9.50 on Tue Sep 21 18:18:54 2021