Archive of Digital Chirp Subbottom Profile Data Collected During USGS Cruises 10CCT01, 10CCT02, and 10CCT03, Mississippi and Alabama Gulf Islands, March and April 2010

Metadata also available as - [Outline] - [Parseable text] - [XML]

Frequently anticipated questions:


What does this data set describe?

Title:
Archive of Digital Chirp Subbottom Profile Data Collected During USGS Cruises 10CCT01, 10CCT02, and 10CCT03, Mississippi and Alabama Gulf Islands, March and April 2010
Abstract:
In March and April of 2010 the U.S. Geological Survey (USGS), in cooperation with the U.S. Army Corps of Engineers (USACE), conducted geophysical surveys to investigate the geologic controls on island framework from just east of Cat Island, Mississippi, to Dauphin Island, Alabama, as part of a broader USGS study on Coastal Change and Transport (CCT). This report serves as an archive of unprocessed digital Chirp seismic reflection data, trackline maps, navigation files, Geographic Information System (GIS) files, Field Activity Collection System (FACS) logs, and formal Federal Geographic Data Committee (FGDC) metadata. Gained (showing a relative increase in signal amplitude) digital images of the subbottom profiles are also provided.
For more information on the seismic surveys see http://walrus.wr.usgs.gov/infobank/c/c110gm/html/c-1-10-gm.meta.html, http://walrus.wr.usgs.gov/infobank/m/m210gm/html/m-2-10-gm.meta.html, and http://walrus.wr.usgs.gov/infobank/i/i310gm/html/i-3-10-gm.meta.html
These data are also available via GeoMapApp (http://www.geomapapp.org/) and Virtual Ocean ( http://www.virtualocean.org/) earth science exploration and visualization applications.
Supplemental_Information:
The USGS St. Petersburg Coastal and Marine Science Center (SPCMSC) assigns a unique identifier to each cruise or field activity. For example, 10CCT01, 10CCT02, and 10CCT03 indicate the data were collected in 2010 to study Coastal Change and Transport (CCT) during the first, second, and third field activities for that study in that calendar year. Refer to http://walrus.wr.usgs.gov/infobank/programs/html/definition/activity.html for a detailed description of the method used to assign the field activity identification (ID). The naming convention used for each subbottom line is as follows: yye##a, where 'yy' are the last two digits of the year in which the data were collected, 'e' is a 1-letter abbreviation for the equipment type (for example, c or i for chirp), '##' is a 2-digit number representing a specific track, and 'a' is a letter representing the section of a line if recording was prematurely terminated or rerun for quality or acquisition problems. All Chirp systems use a signal of continuously varying frequency; the EdgeTech SB-512i and SB-424 Chirp systems used during these surveys produce high-resolution, shallow-penetration (less than 50-ms) profile images of sub-seafloor stratrigraphy. The towfish contains a transducer that transmits and receives acoustic energy and is typically towed 1 - 2 m below the sea surface. As transmitted acoustic energy intersects at density boundaries, such as the seafloor or sub-surface sediment layers, some energy is reflected back toward the transducer, received, and recorded by a PC-based seismic acquisition system. This process is repeated at regular time intervals (for example, 0.125 s) and returned energy is recorded for a specific duration (for example, 50 ms). In this way, a two-dimensional (2-D) vertical image of the shallow geologic structure beneath the towfish is produced. The seismic source employed during 10CCT01 consisted of an EdgeTech SB-424 towfish running EdgeTech's DISCOVER v. 3.51 acquisition software and towed about 3 m behind the GPS antenna. The data were acquired using a 4 - 16 kHz frequency sweep, a 43-kHz sample frequency, and approximately 100-ms record length. The source utilized during cruises 10CCT02 and 10CCT03 consisted of an EdgeTech SB-512i towfish also running DISCOVER v. 3.5.0 acquisition software, which was towed about 18 m and 6 m (respectively) behind the GPS antenna. The data were acquired using a 0.5 - 8 kHz frequency sweep, a 43-kHz sample frequency, and approximately 75-ms record length. The trace data are archived in standard SEG-Y rev. 0, IBM float format (Barry and others, 1975), with the first 3,200 bytes of the card image header in ASCII format instead of EBCDIC format. The SEG-Y files may be processed with commercial or public domain software such as Seismic Unix (SU) (Cohen and Stockwell, 2010). See the How To Download SEG-Y Data page for download instructions. The SEG-Y formatted trace files have a .sgy extension. Also provided in this archive are example SU scripts that allow the user to strip off navigation fixes from the SEG-Y headers, along with a fix for every 1,000 shots, and produce a printable, gained GIF image of each profile. The processed SEG-Y data were exported to Chesapeake Technology, Inc. (CTI) SonarWeb software to produce a geospatially interactive version of the profile that allows the user to obtain a geographic location and depth from the profile for a given cursor position; this information is displayed in the status bar of the browser. Please note that clicking on the profile image switches it to "Expanded View" (a compressed image of the entire line) and cursor tracking is not available in this mode. NOTE: The only supported Web browsers that properly display all features of the geospatial profiles are Internet Explorer 8 or greater for Windows and Firefox 3.6 or greater for all platforms. PC Instructions: For both browsers, the status bar and JavaScript must be enabled. Firefox also requires "Change status bar text" to be checked under Advanced JavaScript Options. If using Internet Explorer 8, you must disable scripts/Active X controls. To do this, right click the information bar (found at the top of the page), left click "Allow Blocked Content...", and then select "Yes". Use of other browsers may result in spurious or no information given in the status window. Firefox may be downloaded at http://www.mozilla.org/products/firefox. Macintosh Instructions (Firefox Only): From the Menu Bar go to Preferences > Content (tab) > Checkmark "Enable JavaScript"> Click Advanced... > Checkmark "Change Status Bar Text". Verify that the status bar is enabled by selecting View from the Menu Bar and looking for a checkmark next to "Status Bar"; if the check is missing, highlight and select the text to activate the bar.
  1. How might this data set be cited?
    Forde, Arnell S., Dadisman, Shawn V., Flocks, James G., Wiese, Dana S., DeWitt, Nancy T., Pfeiffer, William R., Kelso, Kyle W., Thompson, Phillip R., and U.S. Geological Survey, 2011, Archive of Digital Chirp Subbottom Profile Data Collected During USGS Cruises 10CCT01, 10CCT02, and 10CCT03, Mississippi and Alabama Gulf Islands, March and April 2010: U.S. Geological Survey Data Series 611, U.S. Geological Survey, St. Petersburg, FL.

    Online Links:

  2. What geographic area does the data set cover?
    West_Bounding_Coordinate: -89.566187894
    East_Bounding_Coordinate: -88.062282898
    North_Bounding_Coordinate: 30.951314195
    South_Bounding_Coordinate: 29.643773997
  3. What does it look like?
    http://pubs.usgs.gov/ds/611/maps/cruisenav/10cct01_03_location.jpg (JPEG)
    Location map (fig. 2) of all digital subbottom profile data collected during USGS field activities 10CCT01, 10CCT02, and 10CCT03. This map was created at a scale of 1:726,775.
    http://pubs.usgs.gov/ds/611/maps/cruisenav/10cct01_location.jpg (JPEG)
    Location map (fig. 3) of all digital subbottom profile data collected during USGS field activity 10CCT01. This map was created at a scale of 1:60,600.
    http://pubs.usgs.gov/ds/611/maps/cruisenav/10cct02_location.jpg (JPEG)
    Location map (fig. 4) of all digital subbottom profile data collected during USGS field activity 10CCT02. This map was created at a scale of 1:432,500.
    http://pubs.usgs.gov/ds/611/maps/cruisenav/10cct02_area1.jpg (JPEG)
    Detailed trackline map (fig. 5A) of digital subbottom profile data collected in Area 1 during USGS field activity 10CCT02 offshore from Cat Island to East Ship Island (refer to Area 1 on figure 4 for location). This map was created at a scale of 1:136,500.
    http://pubs.usgs.gov/ds/611/maps/cruisenav/10cct02_area2.jpg (JPEG)
    Detailed trackline map (fig. 5B) of digital subbottom profile data collected in Area 2 during USGS field activity 10CCT02 between Petit Bois and Dauphin Islands (refer to Area 2 on figure 4 for location). This map was created at a scale of 1:72,300.
    http://pubs.usgs.gov/ds/611/maps/cruisenav/10cct02_area3.jpg (JPEG)
    Detailed trackline map (fig. 5C) of digital subbottom profile data collected in Area 3 during USGS field activity 10CCT02, offshore of Horn Island (refer to Area 3 on figure 4 for location). This map was created at a scale of 1:86,500.
    http://pubs.usgs.gov/ds/611/maps/cruisenav/10cct02_area4.jpg (JPEG)
    Detailed trackline map (fig. 5D) of digital subbottom profile data collected in Area 4 during USGS field activity 10CCT02, offshore of Horn and Petit Bois Islands (refer to Area 4 on figure 4 for location). This map was created at a scale of 1:126,000.
    http://pubs.usgs.gov/ds/611/maps/cruisenav/10cct03_location.jpg (JPEG)
    Location map (fig. 6) of all digital subbottom profile data collected during USGS field activity 10CCT03. This map was created at a scale of 1:357,000.
    http://pubs.usgs.gov/ds/611/maps/cruisenav/10cct03_area1.jpg (JPEG)
    Detailed trackline map (fig. 7A) of digital subbottom profile data collected in Area 1 during USGS field activity 10CCT03, offshore of Dauphin Island (refer to Area 1 on figure 6 for location). This map was created at a scale of 1:81,500.
    http://pubs.usgs.gov/ds/611/maps/cruisenav/10cct03_area2.jpg (JPEG)
    Detailed trackline map (fig. 7B) of digital subbottom profile data collected in Area 2 during USGS field activity 10CCT03, offshore from East Ship Island to Petit Bois Island (refer to Area 2 on figure 6 for location). This map was created at a scale of 1:233,500.
    http://pubs.usgs.gov/ds/611/profiles/printable/ (GIF)
    Directory containing printable images of all subbottom profiles.
  4. Does the data set describe conditions during a particular time period?
    Beginning_Date: 14-Mar-2010
    Ending_Date: 28-Apr-2010
    Currentness_Reference:
    Data collection interval
  5. What is the general form of this data set?
    Geospatial_Data_Presentation_Form: Archive for Subbottom Profile Data
  6. How does the data set represent geographic features?
    1. How are geographic features stored in the data set?
      Indirect_Spatial_Reference:
      Horizontal X and Y locations (latitude and longitude coordinates) for each shot are provided as ASCII text files, along with the day of year and time (UTC) the shot was recorded.
    2. What coordinate system is used to represent geographic features?
      Horizontal positions are specified in geographic coordinates, that is, latitude and longitude. Latitudes are given to the nearest 0.000001. Longitudes are given to the nearest 0.000001. Latitude and longitude values are specified in Decimal degrees. The horizontal datum used is WGS84.
      The ellipsoid used is WGS_1984.
      The semi-major axis of the ellipsoid used is 6378137.000000.
      The flattening of the ellipsoid used is 1/298.25722210100002.
  7. How does the data set describe geographic features?
    10cct01.txt, s10cct01.txt, and 10cct01_s.txt; 10cct02.txt, s10cct02.txt, and 10cct02_s.txt; 10cct03.txt, s10cct03.txt, and 10cct03_s.txt
    Shotpoint navigation files (Source: Society of Exploration Geophysicists (SEG)-Y headers (http://www.seg.org/publications/tech-stand).)
    FID*
    Internal feature number. (Source: ESRI) Sequential unique whole numbers that are automatically generated.
    Shape*
    Feature geometry. (Source: ESRI) Coordinates defining the features.
    UTMX
    UTM-X coordinate (Zone 16) (Source: Universal Transverse Mercator Geographic Coordinate System)
    Range of values
    Minimum:3299929.826448
    Maximum:3445484.535547
    UTMY
    UTM-Y coordinate (Zone 16) (Source: Universal Transverse Mercator Geographic Coordinate System)
    Range of values
    Minimum:3341978
    Maximum:3348689
    Line
    Trackline number (Source: U.S. Geological Survey)
    Range of values
    Minimum:10c01
    Maximum:10i192
    Shot
    Shotpoint number (Source: U.S. Geological Survey)
    Range of values
    Minimum:1
    Maximum:20000
    Lon
    Longitude (decimal degrees) (Source: World Geodetic System 1984 Geographic Coordinate System)
    Range of values
    Minimum:-89.566187894
    Maximum:-88.062282898
    Lat
    Latitude (decimal degrees) (Source: World Geodetic System 1984 Geographic Coordinate System)
    Range of values
    Minimum:29.643773997
    Maximum:30.951314195
    YEAR
    Year (Source: U.S. Geological Survey)
    Range of values
    Minimum:2010
    Maximum:2010
    DOY:HR:MIN:SEC
    Day of year:hour:minute:second (Source: U.S. Geological Survey) Day of year, hour, minute and second of data acquisition
    Entity_and_Attribute_Overview:
    Binary data file: Trace data are available as binary files in SEG-Y format. These files have a .sgy extension and range in size from 19.5 to 284 MB for 10CCT01, 0.144 to 209 MB for 10CCT02, and 12.4 to 319 MB for 10CCT03.
    Entity_and_Attribute_Overview:
    Graphic image file: Printable versions of the subbottom profiles are available as GIF images. Interactive profiles are available as HTML pages with accompanying JPEG images. The line navigation maps and trackline maps are JPEG images. The trackline maps contain links to the printable subbottom profile images.
    Entity_and_Attribute_Overview:
    Navigation file: Navigation files are available as ASCII text files. Provided are raw (unprocessed) shotpoint navigation files, processed shotpoint navigation files, and processed 1,000-shot-interval location files. Fields/Attributes [FID, Shape] marked above with an asterisk (*) were created by ESRI ArcGIS and are used exclusively by the shapefiles created from the aforementioned .txt files; these fields are not included in the original navigation files. All remaing attributes listed in the above section that do not have an accompanying asterisk are found in 10cct01.txt, s10cct01.txt, and 10cct01_s.txt; 10cct02.txt, s10cct02.txt, and 10cct02_s.txt; 10cct03.txt, s10cct03.txt, and 10cct03_s.txt.
    Entity_and_Attribute_Overview:
    GIS file: The ESRI map documents containing the trackline maps, shapefiles, and metada are provided in a .zip compressed file.
    Entity_and_Attribute_Detail_Citation:
    Barry, K.M., Cavers, D.A., and Kneale, C.W., 1975, Recommended standards for digital tape formats: Geophysics, v. 40, no. 2, p. 344-352. Also available on-line at http://www.seg.org/resources/publications/misc/technical-standards. (284-KB PDF)
    Entity_and_Attribute_Detail_Citation:
    Cohen, J.K., and Stockwell, J.W., Jr., 2010, CWP/SU: Seismic Unix Release 41: A free package for seismic research and processing, Center for Wave Phenomena, Colorado School of Mines. Available on-line at http://www.cwp.mines.edu/cwpcodes/index.html.
    Entity_and_Attribute_Detail_Citation:
    Zihlman, F.N., 1992, DUMPSEGY V.1.0: A program to examine the contents of SEG-Y disk-image seismic data: U.S. Geological Survey Open-File Report 92-590, 28 p. Also available online at http://pubs.er.usgs.gov/usgspubs/ofr/ofr92590.

Who produced the data set?

  1. Who are the originators of the data set? (may include formal authors, digital compilers, and editors)
    • Arnell S. Forde
    • Shawn V. Dadisman
    • James G. Flocks
    • Dana S. Wiese
    • Nancy T. DeWitt
    • William R. Pfeiffer
    • Kyle W. Kelso
    • Phillip R. Thompson
    • U.S. Geological Survey
  2. Who also contributed to the data set?
    Funding and (or) support for this study was provided by the USGS Coastal and Marine Geology Program and Mississippi Coastal Improvements Program (MsCIP). We thank R/V Tommy Munro captain Paul Beaugez and crew (University of Southern Mississippi/Gulfcoast Research Laboratory - Biloxi, MS) and R/V Irvington captains Fred Roberts and Reid Boa (USACE - Mobile, AL) for their assistance in data collection. This document was improved by the reviews of Wayne Baldwin (USGS - WHSC) and Jennifer Miselis (USGS - SPCMSC).
  3. To whom should users address questions about the data?
    James Flocks
    USGS
    Geologist
    600 4th Street South
    Saint Petersburg, FL
    USA

    (727) 803-8747 ext. 3012 (voice)
    jflocks@usgs.gov

Why was the data set created?

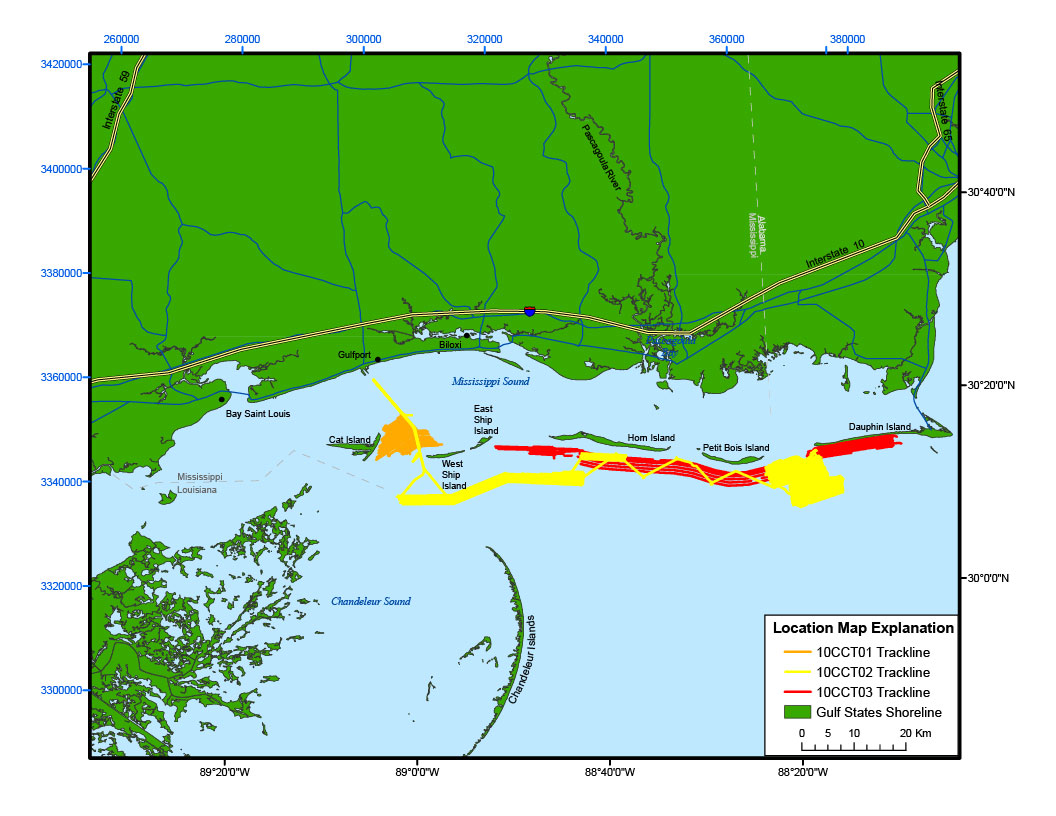
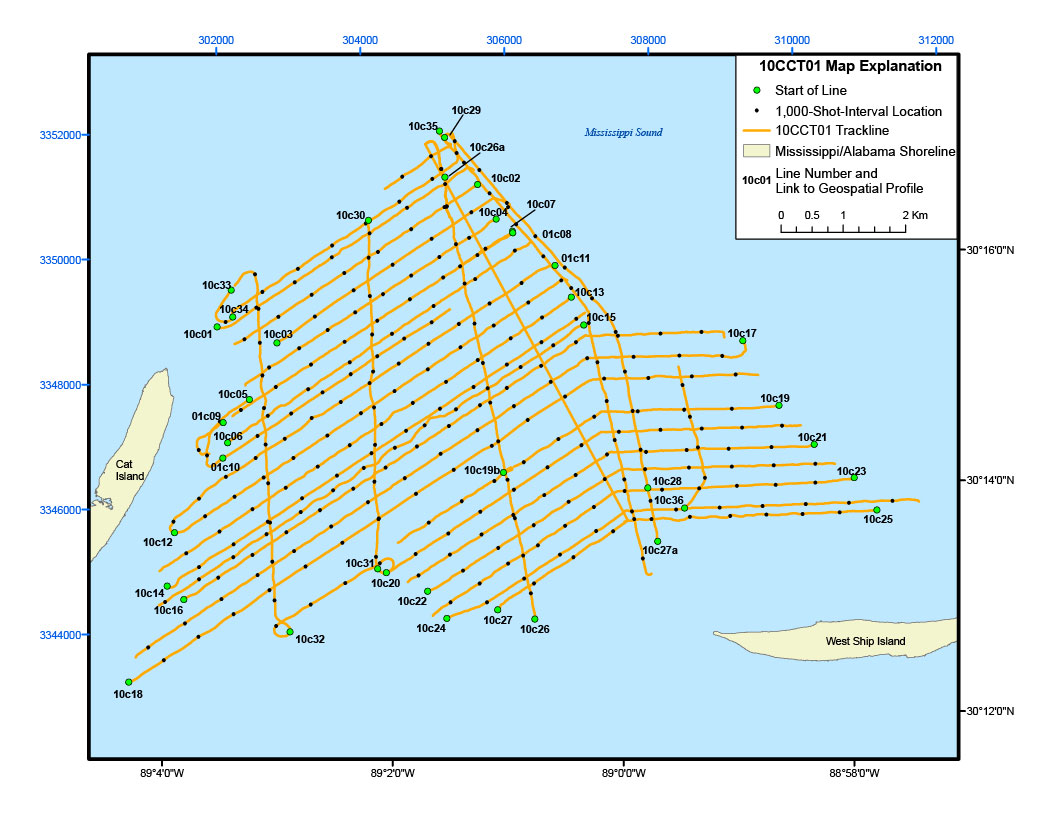
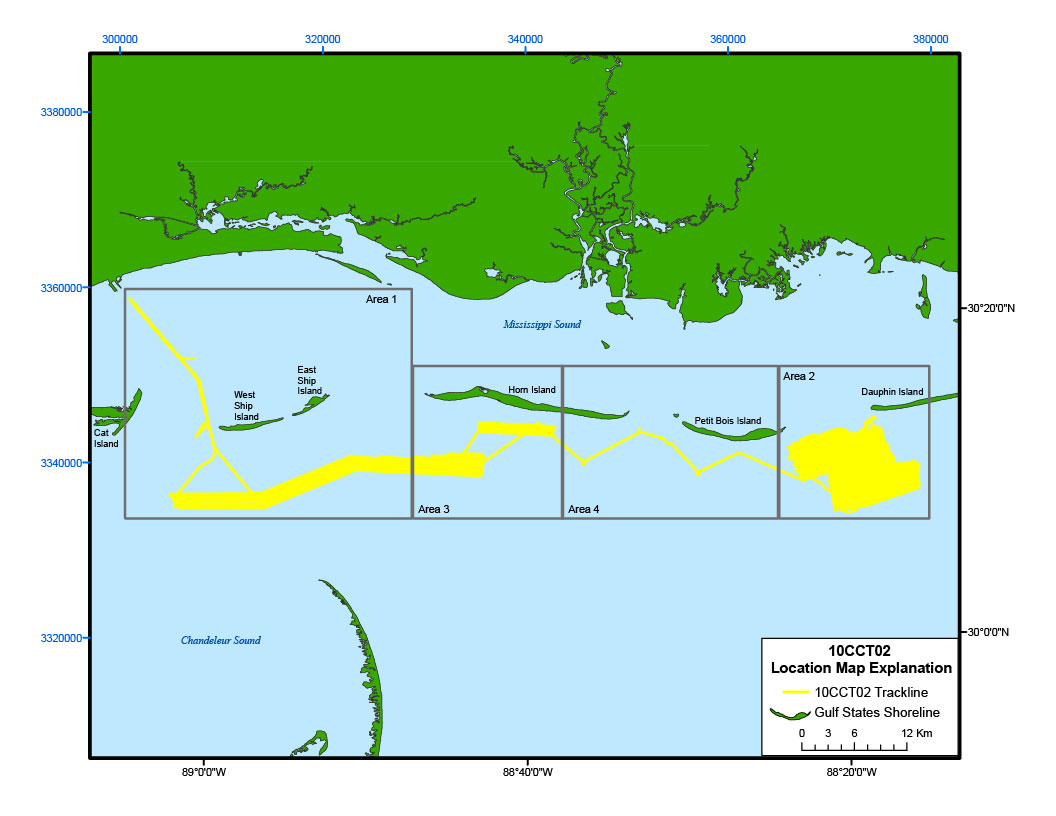
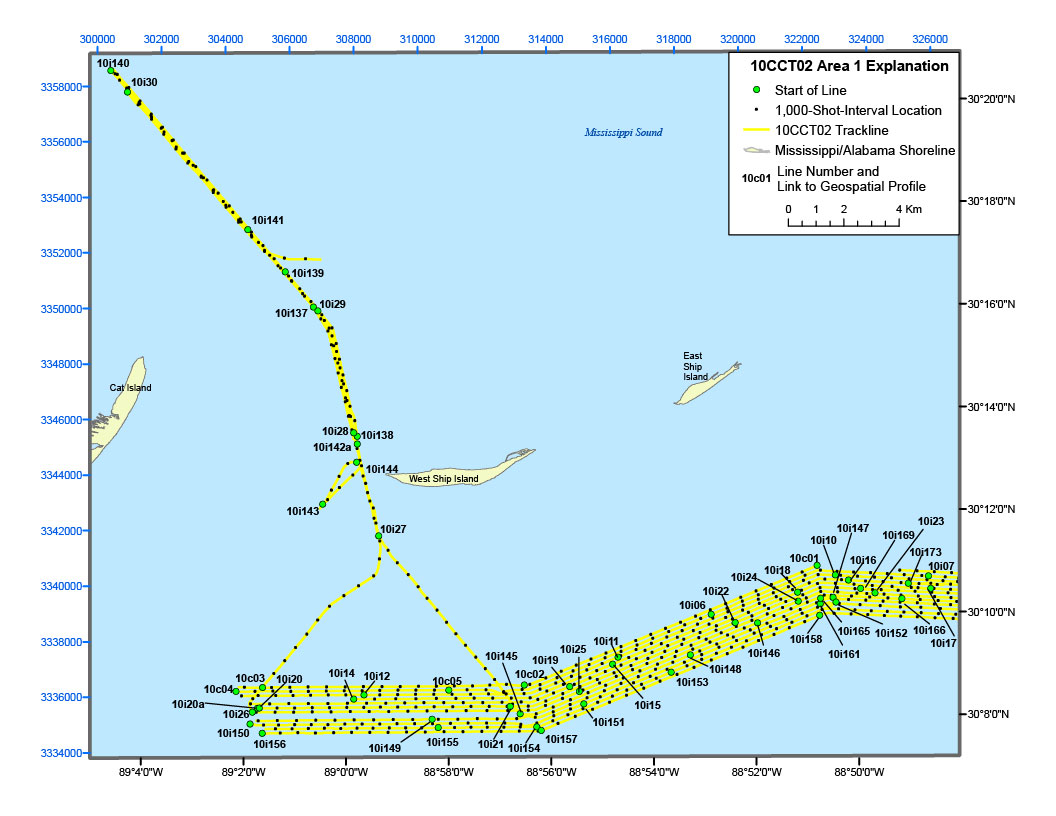
To archive all digital Chirp subbottom profile data and associated files collected during cruises 10CCT01, 10CCT02, and 10CCT03.

How was the data set created?

  1. From what previous works were the data drawn?
  2. How were the data generated, processed, and modified?
    Date: 2010 (process 1 of 8)
    SEG-Y header processing: An issue associated with the acquisition software caused incorrect initial field record numbers to be recorded to the trace headers for many lines; consequently, they were renumbered to start at 1 (this was achieved by using the trace sequence number within line [tracl] header values instead of the recorded shot values) during post-processing with SU. These corrected SEG-Y files are included in this archive. Person who carried out this activity:
    Arnell S. Forde
    U.S. Geological Survey
    Geologist
    600 4th Street South
    St. Petersburg, FL

    (727) 803-8747, ext. 3111 (voice)
    aharrison@usgs.gov
    Date: 2010 (process 2 of 8)
    Chirp processing: The original trace files for lines 10i01, 10i03, 10i04, 10i05, 10i12, 10i29, 10i30, 10i32, 10i36, 10i37, 10i39, 10i40, 10i41, 10i42, and 10i43 were divided into two or more trace files each (for example, 10i01 became 10i01a and 10i01b; 10i4a became 10i4a1) because the original total number of traces exceeded the maximum allowed (20,000) by the processing software, SonarWeb. The SEG-Y data were processed with Seismic Unix to produce gained GIF images of the subbottom profiles included in this report. A representative Chirp data processing sequence consisted of (1) stripping off navigation data from channel 0 for each shot and converting to SU format, (2) applying automatic gain control, (3) generating a PostScript image of the traces, and (4) converting the PostScript image to a GIF image. For additional SU processing and script details, please refer to http://pubs.usgs.gov/ds/611/software/su/readme.txt All the processed SEG-Y data were then exported to CTI SonarWeb software to produce a geospatially interactive version of each profile that allows the user to obtain a geographic location and depth for a given cursor position on the profile. Refer to the Supplemental Information section above for details on how to use the geospatial profiles. Person who carried out this activity:
    Arnell S. Forde
    U.S. Geological Survey
    Geologist
    600 4th Street South
    St. Petersburg, FL

    (727) 803-8747, ext. 3111 (voice)
    aharrison@usgs.gov
    Date: 2010 (process 3 of 8)
    Navigation processing: Shotpoint navigation, start of line coordinates, and 1,000-shot-interval locations were extracted using Seismic Unix software and output as ASCII text files. Shotpoint coordinates were projected from latitudes and longitudes to UTM northings and eastings (WGS84, Zone 16, meters) using PROJ.4.7.0 (http://trac.osgeo.org/proj/). Text files for each seismic line were concatenated into comma-delimited text files (for use with ESRI software), one containing unique shotpoint positions (10cct01.txt, 10cct02.txt, and 10cct03.txt) and another containing the 1,000- shot-interval locations (s10cct01.txt, s10cct02.txt, and s10cct03.txt); all can be viewed within the nav folder. Person who carried out this activity:
    Arnell S. Forde
    U.S. Geological Survey
    Geologist
    600 4th Street South
    St. Petersburg, FL

    (727) 803-8747, ext. 3111 (voice)
    aharrison@usgs.gov
    Date: 2010 (process 4 of 8)
    All concatenated, comma-delimited text files were imported into ArcGIS and saved in the ESRI shapefile format. Person who carried out this activity:
    Arnell S. Forde
    U.S. Geological Survey
    Geologist
    600 4th Street South
    St. Petersburg, FL

    (727) 803-8747, ext. 3111 (voice)
    aharrison@usgs.gov
    Date: 2010 (process 5 of 8)
    Trackline map creation: The trackline maps and shapefiles provided in this archive were created using the Points to Lines ArcScript (D. Rathert, http://arcscripts.esri.com/details.asp?dbid=12702) along with ESRI ArcGIS 9.3 software and then exported to Adobe Illustrator for further editing. The maps were later converted into JPEG format by Adobe GoLive v. 8.0.1. The maps are unprojected (geographic coordinates, WGS84). The interstates layers used on the trackline maps were created by ESRI. The USGS is the originator of all other layers used. A map of trackline navigation for each subbottom profile was also produced with CTI SonarWeb software. Person who carried out this activity:
    Arnell S. Forde
    U.S. Geological Survey
    Geologist
    600 4th Street South
    St. Petersburg, FL

    (727) 803-8747, ext. 3111 (voice)
    aharrison@usgs.gov
    Date: 2010 (process 6 of 8)
    Data Series preparation: In addition to the process steps described above, the following steps were taken to produce this Data Series: the handwritten logs were scanned and saved as PDF files, digital FACS logs were created using the handwritten logs and personal accounts of the crew members and saved as PDF files, and an HTML-based format was used to present the various parts of this archive. Person who carried out this activity:
    Arnell S. Forde
    U.S. Geological Survey
    Geologist
    600 4th Street South
    St. Petersburg, FL

    (727) 803-8747, ext. 3111 (voice)
    aharrison@usgs.gov
    Date: 24-Jan-2017 (process 7 of 8)
    Keywords section of metadata optimized for discovery in USGS Coastal and Marine Geology Data Catalog. Person who carried out this activity:
    U.S. Geological Survey
    Attn: Alan O. Allwardt
    Contractor -- Information Specialist
    2885 Mission Street
    Santa Cruz, CA

    831-460-7551 (voice)
    831-427-4748 (FAX)
    aallwardt@usgs.gov
    Date: 13-Oct-2020 (process 8 of 8)
    Added keywords section with USGS persistent identifier as theme keyword. Person who carried out this activity:
    U.S. Geological Survey
    Attn: VeeAnn A. Cross
    Marine Geologist
    384 Woods Hole Road
    Woods Hole, MA

    508-548-8700 x2251 (voice)
    508-457-2310 (FAX)
    vatnipp@usgs.gov
  3. What similar or related data should the user be aware of?

How reliable are the data; what problems remain in the data set?

  1. How well have the observations been checked?
    The validity or accuracy of marine subbottom profiles is highly qualitative and depends on equipment and operating condition variables. Visual inspection of the images rendered from the data did not show any major anomalies; however, strong winds and rough seas encountered during data collection may have affected the data by introducing increased signal noise, heave issues, or dropped traces.
  2. How accurate are the geographic locations?
    Vessel positions were determined by a CodaOctopus F190 DGPS receiver with OmniSTAR High Performance (HP) correction (accurate to within 20 cm) during cruises 10CCT01 and 10CCT02, and an Applanix POS MV DGPS receiver (accurate to within 0.5 - 2 m) during cruise 10CCT03. Positions were recorded to the trace headers in latitude and longitude coordinates about every 1 s. Offsets between the Chirp and GPS antenna of approximately 3 m, 18 m, and 6 m for cruises 10CCT01, 10CCT02, and 10CCT03, respectively, were not accounted for during acquisition. Refer to figure 1 included with this archive for diagrams of the acquisition geometries, including the GPS offset measurements. The ASCII navigation files and trackline maps have not been corrected to reflect the offsets between the Chirp and GPS antenna. Line navigation maps and geospatial profiles generated with CTI SonarWeb software have been corrected for the GPS offsets.
  3. How accurate are the heights or depths?
    These data are not to be used for bathymetry. Depths shown on the geospatial profiles and two-way travel (TWT) times shown on the printable profile images are relative to the Chirp towfish position, not to the sea surface. Furthermore, the raising or lowering of the towfish during a survey (to avoid obstacles or follow relief) produces relative shifts in multiple reflections seen in the profile, which can confuse geologic interpretations. Any elevation change of the towfish is recorded in the logbooks and identifiable on the subbottom profiles by steep, abrupt shifts in the seafloor return.
  4. Where are the gaps in the data? What is missing?
    These data are collected along tracklines (2-D) and are therefore inherently incomplete. Geologic details between lines must be inferred. As a result of an unknown software malfunction during cruise 10CCT01, no data were recorded for line 10c19a. Lines 10c26 and 10c27 were corrupted for a short period of time by an anomaly in the Chirp data acquisition hardware, the Edgetech 3200-XS (Model: SB-424) subbottom profiling system. This disruption took the form of data/time/navigation jumps in both lines and was most likely caused by momentary system power glitches of the SB-424 and associated network hard drive. Also, due to an unknown software issue, which occurred during cruise 10CCT02, no data were recorded for line 10i142.
  5. How consistent are the relationships among the observations, including topology?
    These data are from different cruises conducted on different vessels with different navigation systems, acquisition equipment, and acquisition geometries. Horizontal accuracy of position varies with navigation equipment used, and signal-to-noise ratio of the seismic-reflection data changes relative to the towfish acquisition equipment and platform used. However, for most purposes, the profile data are comparable for all cruises.

How can someone get a copy of the data set?

Are there legal restrictions on access or use of the data?
Access_Constraints: None. These data are held in the public domain.
Use_Constraints:
The U.S. Geological Survey and USACE request to be acknowledged as originators of the data in future products or derivative research.
  1. Who distributes the data set? (Distributor 1 of 1)
    Arnell Forde
    U.S. Geological Survey
    Geologist
    600 4th Street South
    St. Petersburg, FL
    USA

    (727) 803-8747, ext. 3111 (voice)
    aharrison@usgs.gov
    Contact_Instructions:
    All of this report except for the SEG-Y data is available on-line.
  2. What's the catalog number I need to order this data set? U.S. Geological Survey Data Series 611
  3. What legal disclaimers am I supposed to read?
    This DVD publication was prepared by an agency of the United States Government. Although these data have been processed successfully on a computer system at the U.S. Geological Survey, no warranty expressed or implied is made regarding the display or utility of the data on any other system, nor shall the act of distribution imply any such warranty. The U.S. Geological Survey shall not be held liable for improper or incorrect use of the data described and (or) contained herein. Reference herein to any specific commercial product, process, or service by trade name, trademark, manufacturer, or otherwise does not constitute or imply its endorsement, recommendation, or favoring by the United States Government or any agency thereof.
  4. How can I download or order the data?
    • Availability in digital form:
      Data format: The SEG-Y standard format (Barry and others, 1975) consists of the following: a 3,600-byte reel identification header, with the first 3,200 bytes consisting of an EBCDIC header block followed by a 400-byte binary header block, both of which include information specific to line and reel number; a trace data block that follows the reel identification header, with the first 240 bytes of each trace block consisting of the binary trace identification header; and seismic data samples that follow the trace identification header. in format SEG-Y Size: 28680
      Media you can order: DVD (format ISO 9660)
      Note: Unix, Linux, DOS and Macintosh OS X
      Data format: The GIS project used to create the trackline maps is composed of map documents, shapefiles, and metadata. Map documents were created with PC-compatible ESRI ArcGIS 9.3 software. The shapefiles provided may also be viewed using other versions of ArcView, ArcGIS, or public domain software ArcExplorer (http://www.esri.com/software/arcexplorer/index.html) or GeoMapApp (http://www.geomapapp.org/) software, which is compatible with all platforms. in format map document, shapefile, metadata Size: 400
      Network links: http://pubs.usgs.gov/ds/611/software/arc/arc.zip
      Data format: The SEG-Y standard format (Barry and others, 1975) consists of the following: a 3,600-byte reel identification header, with the first 3,200 bytes consisting of an EBCDIC header block followed by a 400-byte binary header block, both of which include information specific to line and reel number; a trace data block that follows the reel identification header, with the first 240 bytes of each trace block consisting of the binary trace identification header; and seismic data samples that follow the trace identification header. in format SEG-Y Data downlaod Size: 28680
      Network links: http://cmgds.marine.usgs.gov/data/10cct01/chirp/
      http://cmgds.marine.usgs.gov/data/10cct02/chirp/
      http://cmgds.marine.usgs.gov/data/10cct03/chirp/
    • Cost to order the data:

      Prices vary. Publications are available from USGS Information Services, Box 25286, Federal Center, Denver, CO 80225-0046 (telephone: 1-888-ASK-USGS, e-mail: infoservices@usgs.gov).

  5. What hardware or software do I need in order to use the data set?
    Use of SEG-Y data requires specialized seismic processing software, such as public domain software Seismic Unix: http://www.cwp.mines.edu/cwpcodes/index.html

Who wrote the metadata?

Dates:
Last modified: 13-Oct-2020
Metadata author:
Arnell Forde
USGS
Geologist
U.S. Geological Survey, 600 4th Street South
St. Petersburg, FL
USA

(727) 803-8747, ext. 3111 (voice)
aharrison@usgs.gov
Metadata standard:
Content Standard for Digital Geospatial Metadata (FGDC-STD-001-1998)

This page is <https://cmgds.marine.usgs.gov/catalog/spcmsc/ds-611metadata.faq.html>
Generated by mp version 2.9.50 on Tue Sep 21 18:18:54 2021