Post-Hurricane Ike coastal oblique aerial photographs collected along the Alabama, Mississippi, and Louisiana barrier islands and the north Texas coast, September 14-15, 2008

Metadata also available as - [Outline] - [Parseable text] - [XML]

Frequently anticipated questions:


What does this data set describe?

Title:
Post-Hurricane Ike coastal oblique aerial photographs collected along the Alabama, Mississippi, and Louisiana barrier islands and the north Texas coast, September 14-15, 2008
Abstract:
The U.S. Geological Survey (USGS) conducts baseline and storm-response photography missions to document and understand the changes in vulnerability of the Nation's coasts to extreme storms. On September 14-15, 2008, the USGS conducted an oblique aerial photographic survey (during Field Activity Number (FAN) 08ACH06, http://cmgds.marine.usgs.gov/fan_info.php?fan=08ACH06) along the Alabama, Mississippi, and Louisiana barrier islands and the north Texas coast, aboard a Beechcraft Super King Air 200 aircraft at an altitude of 500 feet (ft) and approximately 1,200 ft offshore (Figure 2, http://pubs.usgs.gov/ds/0990/html/ds990_fig2.html). This mission was flown to collect data for assessing incremental changes since the last survey, flown September 9-10, 2008 (FAN 08ACH05, http://cmgds.marine.usgs.gov/fan_info.php?fan=08ACH05), and the data can be used for assessing future coastal change. The photographs provided here are Joint Photographic Experts Group (JPEG) images. The photograph locations are an estimate of the position of the aircraft and do not indicate the location of the feature in the images (see the Navigation Data page, http://pubs.usgs.gov/ds/0990/html/ds990_nav.html). These photographs document the configuration of the barrier islands and other coastal features at the time of the survey. ExifTool was used to add the following to the header of each photo: time of collection, Global Positioning System (GPS) latitude, GPS longitude, keywords, credit, artist (photographer), caption, copyright, and contact information. Photographs can be opened directly with any JPEG-compatible image viewer by clicking on a thumbnail on the contact sheet. All image times were recorded in UTC. Table 1 (http://pubs.usgs.gov/ds/0990/html/ds990_table.html) provides detailed information about the assigned location, name, date, and time the photograph was taken along with links to the photograph. In addition to the photographs, a Google Earth Keyhole Markup Language (KML) file is provided and can be used to view the images by clicking on the marker and then clicking on either the thumbnail or the link above the thumbnail. The KML files were created using the photographic navigation files. Note: A KML number was assigned to each photograph to aid navigation of the Google Earth file. These numbers correspond to the site labels in Google Earth.
Supplemental_Information:
For a summary of field activity 08ACH06 please see http://cmgds.marine.usgs.gov/fan_info.php?fan=08ACH06.
  1. How might this data set be cited?
    Morgan, Karen L.M., Krohn, M. Dennis, and Guy, Kristy K., 2016, Post-Hurricane Ike coastal oblique aerial photographs collected along the Alabama, Mississippi, and Louisiana barrier islands and the north Texas coast, September 14-15, 2008: U.S. Geological Survey Data Series Data Series 990, U.S. Geological Survey, St. Petersburg, Fla..

    Online Links:

  2. What geographic area does the data set cover?
    West_Bounding_Coordinate: -95.3545967
    East_Bounding_Coordinate: -88.0282500
    North_Bounding_Coordinate: 30.4631717
    South_Bounding_Coordinate: 28.9023283
  3. What does it look like?
    http://pubs.usgs.gov/ds/0990/downloads/maps/index.jpg (JPEG)
    Index map of survey area flight path during USGS field activity 08ACH06. Red line shows the storm track (provided by the National Oceanic and Atmospheric Administration [NOAA]).
    http://pubs.usgs.gov/ds/0990/html/html_images/fig2.jpg (JPEG)
    Graphic for acquisition geometry (Figure 2) for USGS field activity 08ACH06. Graphic shows basic flight distance from the shore and elevation during the survey for the aircraft used.
    http://pubs.usgs.gov/ds/0990/html/html_images/contents.jpg (JPEG)
    Graphic used on Contents page of USGS field activity 08ACH06 oblique aerial photographs Data Series. Graphic shows the directory structure of the publication.
    http://pubs.usgs.gov/ds/0990/downloads/maps/08ACH06_1.jpg (JPEG)
    Map showing the extent of Area 1 for the post-Hurricane Ike coastal oblique aerial photographs from Dauphin Island, Alabama, to Breton Island, Louisiana. The flight path, divided into 5-minute segments, is represented by the alternating purple and yellow lines. Pages containing thumbnail images of photographs, referred to as contact sheets, were created based on these segments.
    http://pubs.usgs.gov/ds/0990/downloads/maps/08ACH06_2.jpg (JPEG)
    Map showing the extent of Area 2 for the post-Hurricane Ike coastal oblique aerial photographs from Bastian Island, Louisiana, to Raccoon Island, Louisiana. The flight path, divided into 5-minute segments, is represented by the alternating purple and yellow lines. Pages containing thumbnail images of photographs, referred to as contact sheets, were created based on these segments.
    http://pubs.usgs.gov/ds/0990/downloads/maps/08ACH06_3.jpg (JPEG)
    Map showing the extent of Area 3 for the post-Hurricane Ike coastal oblique aerial photographs from Creole, Louisiana, to Freeport, Texas. The flight path, divided into 5-minute segments, is represented by the alternating purple and yellow lines. Pages containing thumbnail images of the photographs, referred to as contact sheets, were created based on these segments. Click on the five-minute segment name to view each contact sheet. The red line shows the storm track (provided by the Unisys Weather).
    http://pubs.usgs.gov/ds/0990/downloads/maps/inset04_dauphin.jpg (JPEG)
    Inset map showing the extent of inset04_dauphin.jpg for the post-Hurricane Ike coastal oblique aerial photographs Dauphin Island, Alabama. The flight path, divided into 5-minute segments, is represented by the alternating purple and yellow lines. Pages containing thumbnail images of photographs, referred to as contact sheets, were created based on these segments.
    http://pubs.usgs.gov/ds/0990/downloads/maps/inset05_westshipisland.jpg (JPEG)
    Inset map showing the extent of inset05_westshipisland.jpg for the post-Hurricane Ike coastal oblique aerial photographs of the western end of Ship Island, Mississippi. The flight path, divided into 5-minute segments, is represented by the alternating purple and yellow lines. Pages containing thumbnail images of photographs, referred to as contact sheets, were created based on these segments.
    http://pubs.usgs.gov/ds/0990/downloads/maps/inset06_timbalier.jpg (JPEG)
    Inset map showing the extent of inset06_timbalier.jpg for the post-Hurricane Ike coastal oblique aerial photographs the eastern end of Timbalier Island, Louisiana. The flight path, divided into 5-minute segments, is represented by the alternating purple and yellow lines. Pages containing thumbnail images of photographs, referred to as contact sheets, were created based on these segments.
  4. Does the data set describe conditions during a particular time period?
    Beginning_Date: 14-Sep-2008
    Beginning_Time: 143342
    Ending_Date: 15-Sep-2008
    Ending_Time: 153300
    Currentness_Reference:
    ground condition
  5. What is the general form of this data set?
    Geospatial_Data_Presentation_Form:
    Multimedia presentation of JPEG images and point data in ASCII and CSV files
  6. How does the data set represent geographic features?
    1. How are geographic features stored in the data set?
      Indirect_Spatial_Reference: none
    2. What coordinate system is used to represent geographic features?
      Horizontal positions are specified in geographic coordinates, that is, latitude and longitude. Latitudes are given to the nearest 0.000001. Longitudes are given to the nearest 0.000001. Latitude and longitude values are specified in Decimal degrees. The horizontal datum used is North American Datum 1983.
      The ellipsoid used is Geodetic Reference System 80.
      The semi-major axis of the ellipsoid used is 6378137.000000.
      The flattening of the ellipsoid used is 1/298.257222.
  7. How does the data set describe geographic features?
    Entity_and_Attribute_Overview:
    Unisys Weather (http://weather.unisys.com/hurricane/index.php), 2015, Post-Hurricane Ike storm track (KMZ).
    Entity_and_Attribute_Overview:
    KML file: The Google Earth project is available as a KML file. The post-Hurricane Ike storm track KML was provided by Unisys Weather. The KML includes photo numbers, photo locations, and the storm track.
    Entity_and_Attribute_Overview:
    Graphic Image Files: The index map is a JPEG image. The index map shows the coastal oblique aerial photography along the Alabama, Mississippi, and Louisiana barrier islands and the north Texas coast, September 14-15, 2008. The index map also shows three areas, which link to more detailed maps and indicate how the full-size photographs were divided into each area. The survey area maps are JPEG images. The survey maps contain links to the 5-minute segment contact sheet pages.
    Entity_and_Attribute_Overview:
    Navigation file(s): The processed files (*.csv) and the raw navigation files (*.txt) are comma-delimited and tab-delimited ASCII text files, respectively.
    Entity_and_Attribute_Overview: KML file(s): The KML file is ds990_08ACH06.kml.
    Entity_and_Attribute_Detail_Citation:
    Navigation, maps and KML files were derived from GPS data collected in flight. Storm track for post-Hurricane Ike is available from Unysis Weather.

Who produced the data set?

  1. Who are the originators of the data set? (may include formal authors, digital compilers, and editors)
    • Karen L.M. Morgan
    • M. Dennis Krohn
    • Kristy K. Guy
  2. Who also contributed to the data set?
    Funding and (or) support for this study was provided by the USGS Coastal and Marine Geology Program (CMGP). The authors wish to thank the pilot, Rob Kent, for his assistance in data collection. The authors would also like to thank Ann Marie Ascough with the USGS for her assistance with data processing.
  3. To whom should users address questions about the data?
    K. Morgan
    USGS
    Geologist
    600 4th Street South
    St. Petersburg, FL
    USA

    (727) 502-8037 (voice)
    kmorgan@usgs.gov

Why was the data set created?

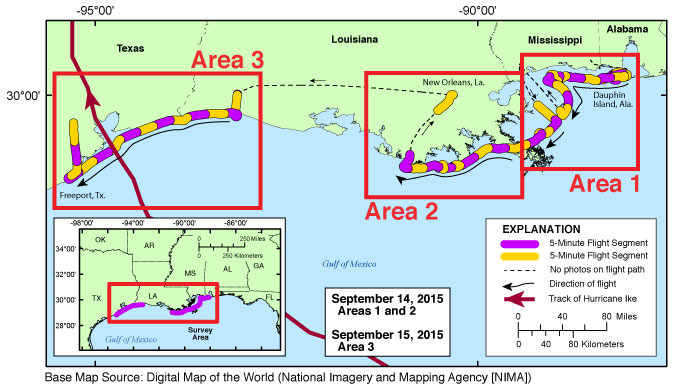
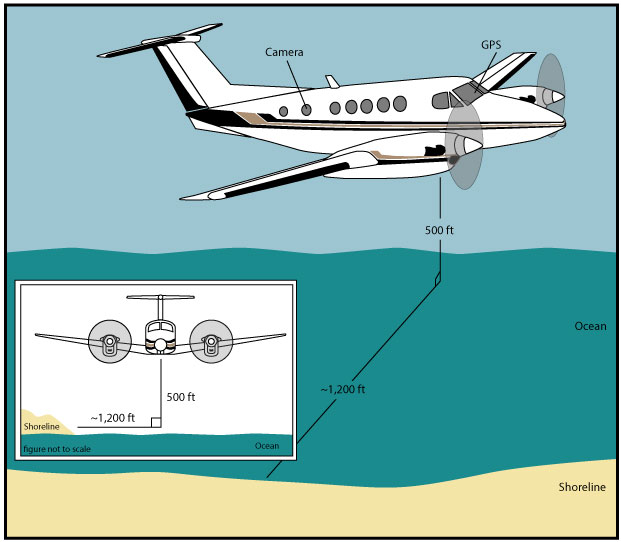
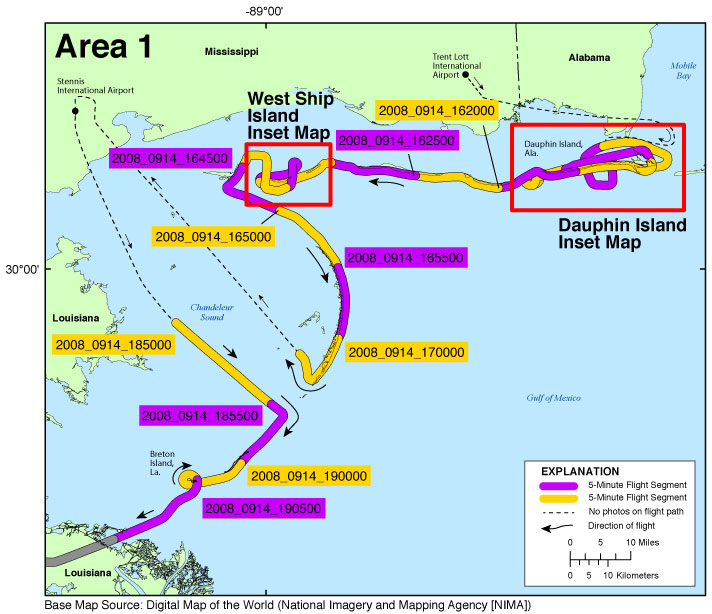
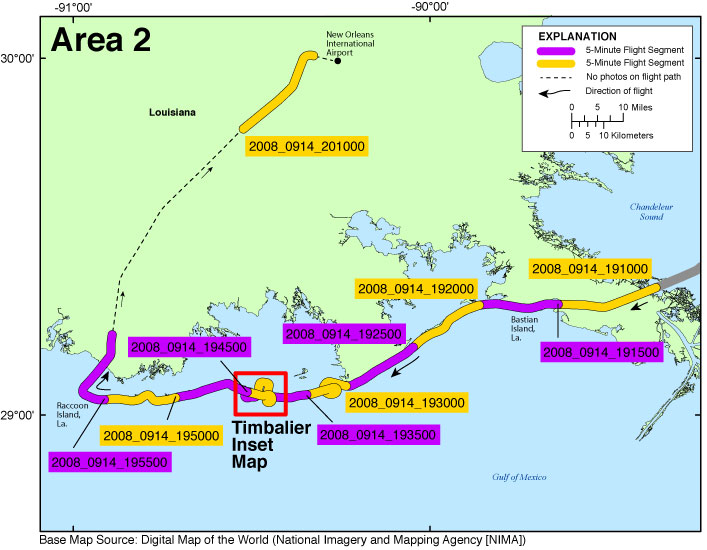
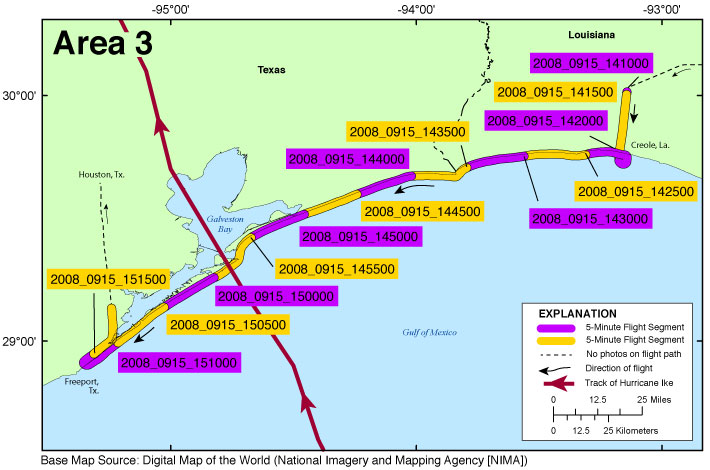
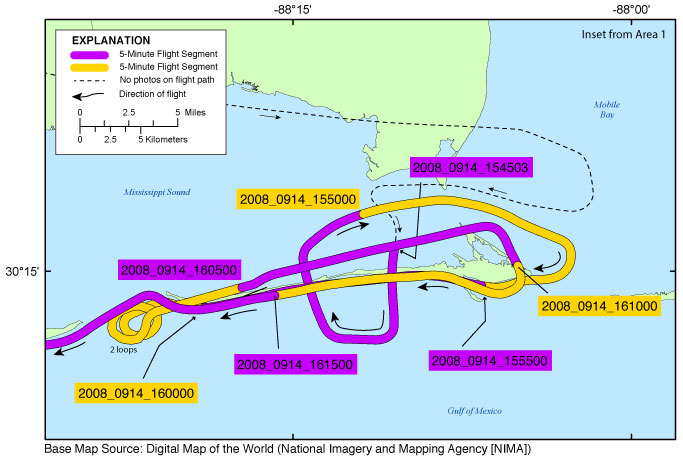
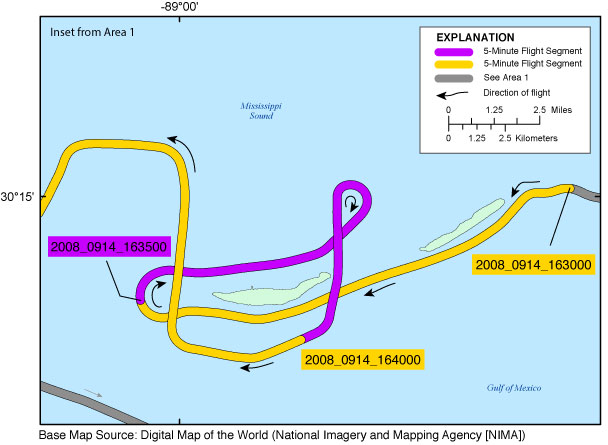
To provide access to digital photographs collected as part of the September 14-15, 2008, post-Hurricane Ike oblique aerial survey conducted along the Alabama, Mississippi, and Louisiana barrier islands and the north Texas coast and to provide access to attribute data that document the time and location of where each photograph was taken.

How was the data set created?

  1. From what previous works were the data drawn?
  2. How were the data generated, processed, and modified?
    Date: 14-Sep-2008 (process 1 of 10)
    Image Acquisition: Photographs were taken using a Nikon D1X camera. The camera was tethered to a Panasonic CF-51 Toughbook. Images were written directly to the computer hard drive using Nikon Capture Control Version 4.4.2. Best effort was made at the beginning of the flight to synchronize the computer's and the camera's internal clocks to within 1 second of UTC time from the GPS sensor. The D1X records GPS in the EXIF Header. Image size is approximately 6 megapixels. Photographer: Karen L.M. Morgan. Note: GPS locations indicate the position of the aircraft at the time of the photograph, not the position of the feature in the image. Person who carried out this activity:
    K. Morgan
    USGS
    Geologist
    600 4th Street South
    St. Petersburg, FL
    USA

    (727) 502-8037 (voice)
    kmorgan@usgs.gov
    Date: 15-Sep-2008 (process 2 of 10)
    Navigation Files: Navigation files were extracted as comma-delimited American Standard Code for Information Interchange (ASCII) text files from Fugawi Marine ENC Ver 4. The Garmin GPS 18 PC recorded: latitude (decimal degrees), longitude (decimal degrees), UTC, altitude (meters), local date (yyyymmdd), UTC date (yyyymmdd), local time (hhmmss), UTC time (hhmmss), speed (kph), heading, leg distance (meters from last data point), total flight distance (meters), and sequence number at an interval of approximately 1 every second. Navigation files can be found on the Navigation Data page (http://pubs.usgs.gov/ds/0990/html/ds990_nav.html) of the USGS Data Series report (DS 990) associated with ths metadata. Person who carried out this activity:
    K. Morgan
    USGS
    Geologist
    600 4th Street South
    St. Petersburg, FL
    USA

    (727) 502-8037 (voice)
    kmorgan@usgs.gov
    Date: 15-Oct-2008 (process 3 of 10)
    Video Aquisition: The video was shot out of the rear starboard window of the airplane using a Sony DCR-VX1000 Handycam operated by Kristy Guy. The camera sent the video signal to a Panasonic AG-5700 to record on Super Video Home System (SVHS) tape. The SVHS video was digitally captured using MAC iMovie and divided into 5-minute segments consistent with the 5-minute HTML pages, each spanning a 5-minute section of the flight. Mini Digital Video tapes failed to record. The video files are not included in this report. Person who carried out this activity:
    K. Morgan
    USGS
    Geologist
    600 4th Street South
    St. Petersburg, FL
    USA

    727-502-8037 (voice)
    kmorgan@usgs.gov
    Date: 15-Sep-2008 (process 4 of 10)
    Image Processing: Images were converted to JPEG using Nikon Capture Camera Editor ver. 4.4.2. Images in JPEG format were saved using the file name format yyyy_mmdd_hhmmssd.jpg (where the "d" signifies acquisition using the digital camera). The names provide information about the photograph's year, month, day, hour, minute, and second. For example, image 2008_0914_133636d.jpg was taken September 14, 2008, at 13:36:36 UTC. Best effort wss made to set the camera's internal clock to within 1 second of UTC at the beginning of the flight. Person who carried out this activity:
    K. Morgan
    USGS
    Geologist
    600 4th Street South
    St. Petersburg, FL
    USA

    (727) 502-8037 (voice)
    kmorgan@usgs.gov
    Date: 15-Sep-2008 (process 5 of 10)
    Geospatial Processing: Image names and navigation data were entered into spreadsheets using Microsoft Excel 2011 and saved as comma-separated value (CSV) files to make them compatible with ArcGIS software. The latitude/longitude data from the CSV navigation file, called XSTORMS.h20080914_photographs.csv and XSTORMS.h20080915_photographs.csv, were used to produce Environmental Systems Research Institute (Esri) shapefiles using ArcGIS 10.1. These shapefiles were used to produce the JPEG maps included in this report. The shapefiles and spreadsheets are not included in this report. Person who carried out this activity:
    K. Morgan
    USGS
    Geologist
    600 4th Street South
    St. Petersburg, FL
    USA

    (727) 502-8037 (voice)
    kmorgan@usgs.gov
    Date: 04-Aug-2015 (process 6 of 10)
    Survey map creation: The survey maps provided in this archive were created with Esri ArcGIS 10.1 software and saved as Adobe Illustrator (*.ai) files. Survey maps were edited using Adobe Illustrator CS6 and exported in JPEG format. Person who carried out this activity:
    K. Morgan
    USGS
    Geologist
    600 4th Street South
    St. Petersburg, FL
    USA

    (727) 502-8037 (voice)
    kmorgan@usgs.gov
    Date: 04-Aug-2015 (process 7 of 10)
    Google Earth file creation: The KML files were created using the photographic navigation file ds990_08ach06.csv. The storm track (in KML format) was provided by Unisys Weather (http://weather.unisys.com/hurricane/index.php). The USGS is the originator of all other layers. To aid navigation through the KML file, each image was assigned a sequential KML number. Table 1 of this report shows the KML number given to each image, the corresponding image name, and associated attributes. Each point on the Google Earth file contains the KML number, storm name, latitude, longitude, image name, geographic area, date, time, a thumbnail of the full-size photograph, and links to the full-size photographs and contact sheets. Person who carried out this activity:
    K. Morgan
    USGS
    Geologist
    600 4th Street South
    St. Petersburg, FL
    USA

    (727) 502-8037 (voice)
    kmorgan@usgs.gov
    Date: 15-Sep-2008 (process 8 of 10)
    EXIF headers: Exchangeable Image File (EXIF) and International Press Telecommunications Council (IPTC) headers were populated from the command prompt using ExifTool (http://www.sno.phy.queensu.ca/~phil/exiftool, 2012) ExifTool was executed from a directory containing all photographs to be edited and a CSV file with information for each of the photographs. The metadata values for photo creation include time, GPS latitude, GPS longitude, GPS position (latitude and longitude), keywords, credit, artist (photographer), caption, copyright, and contact were added to each photograph's EXIF header using a Perl script called met_add.pl. Person who carried out this activity:
    K. Morgan
    USGS
    Geologist
    600 4th Street South
    St. Petersburg, FL
    USA

    (727) 502-8037 (voice)
    kmorgan@usgs.gov
    Date: 04-Aug-2015 (process 9 of 10)
    FACS Logs: In addition to the process steps described above, the following steps were taken to produce this Data Series Report: digital Field Activity Collection System (FACS) logs were created at the beginning of each flight and saved as PDF and TXT files. In addition, an HTML-based format was used to present the various parts of this archive. Person who carried out this activity:
    K. Morgan
    USGS
    Geologist
    600 4th Street South
    St. Petersburg, FL
    USA

    (727) 502-8037 (voice)
    kmorgan@usgs.gov
    Date: 13-Oct-2020 (process 10 of 10)
    Added keywords section with USGS persistent identifier as theme keyword. Person who carried out this activity:
    U.S. Geological Survey
    Attn: VeeAnn A. Cross
    Marine Geologist
    384 Woods Hole Road
    Woods Hole, MA

    508-548-8700 x2251 (voice)
    508-457-2310 (FAX)
    vatnipp@usgs.gov
  3. What similar or related data should the user be aware of?

How reliable are the data; what problems remain in the data set?

  1. How well have the observations been checked?
    Best attempts were made to set the camera to UTC on the GPS receivers at the beginning of each flight. The clock of the Compix Titler unit was also set to UTC at the same time. Human error during transcription of geographic position and time from the video is possible; however, no obvious errors were observed. Latitude, longitude, and time were collected at an interval of approximately once per second. NOTE: Latitude and longitude positions in this report refer to the position of the aircraft, not the position of the landmarks photographed. Refer to the Process Steps below for more detail.
  2. How accurate are the geographic locations?
    Best attempts were made to maintain the same relative distance between the aircraft and the beach in order to keep a constant field of view.
  3. How accurate are the heights or depths?
  4. Where are the gaps in the data? What is missing?
    No known issues
  5. How consistent are the relationships among the observations, including topology?
    Data presented here include the digitally collected photographs in JPEG format with Exchangeable Image File (EXIF) headers embedded with the individual photograph's location along the flight path of a post-Hurricane Ike coastal oblique aerial photographic survey of the coast, taken along the Alabama, Mississippi, and Louisiana barrier islands and the north Texas coast. This mission was flown on September 14-15, 2008, aboard a Beechcraft Super King Air 200, tail number N924AC. Crew members of the USGS in St. Petersburg, Fla., were Karen L.M. Morgan, M. Dennis Krohn, Kristy K. Guy, and Abby Sallenger, with pilot, Rob Kent, of Bay Air Charters, Inc. Also on the flight was Cornelia Dean (New York Times). Still photography was collected along the coast during this survey. Photographer: Karen L.M. Morgan. GPS Data Collection - Instrument: Garmin GPS 18 PC, WAAS enabled. Data Collection Interval: 1 Second. Data File Format: Native Fugawi and Text. Number of files created: 2. Computer: Panasonic Toughbook CF-51. Software: Fugawi Marine ENC, ver. 4.4 The GPS unit was used to record navigation fixes of the aircraft, not the position of the features imaged. For a summary of field activity 08ACH06 please see http://cmgds.marine.usgs.gov/fan_info.php?fan=08ACH06.

How can someone get a copy of the data set?

Are there legal restrictions on access or use of the data?
Access_Constraints: None
Use_Constraints:
The U.S. Geological Survey requests to be acknowledged as originator of the data in future products or derivative research.
  1. Who distributes the data set? (Distributor 1 of 1)
    K. Morgan
    USGS
    Geologist
    600 4th Street South
    St. Petersburg, FL
    USA

    (727) 502-8037 (voice)
    kmorgan@usgs.gov
  2. What's the catalog number I need to order this data set? U.S. Geological Survey Data Series 990
  3. What legal disclaimers am I supposed to read?
    This publication was prepared by an agency of the United States Government. Although these data have been processed successfully on a computer system at the U.S. Geological Survey, no warranty expressed or implied is made regarding the display or utility of the data on any other system, nor shall the act of distribution imply any such warranty. The U.S. Geological Survey shall not be held liable for improper or incorrect use of the data described and (or) contained herein. Reference herein to any specific commercial product, process, or service by trade name, trademark, manufacturer, or otherwise does not constitute or imply its endorsement, recommendation, or favoring by the United States Government or any agency thereof.
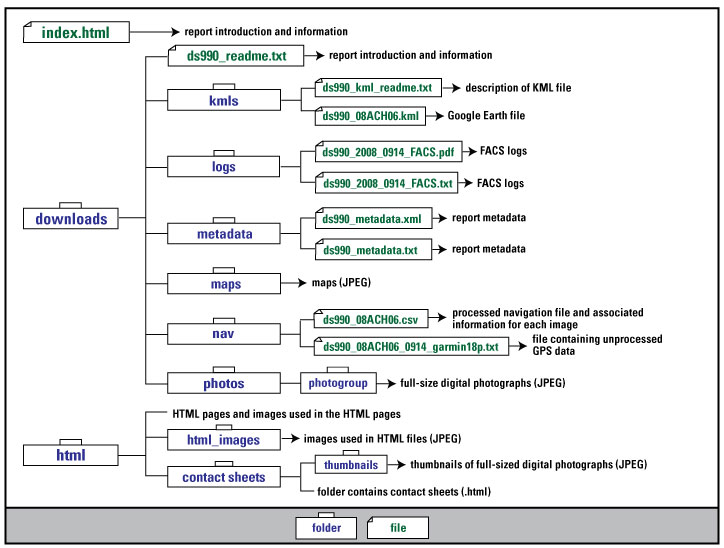
  4. How can I download or order the data?
    • Availability in digital form:
      Data format: CSV: CSV files representing table information collected during the flight. JPEG: Images can be opened directly with any JPEG-compatible image viewer. The survey's full-size photographs are divided into areas. ds990_08ACH06.kml has 2,466 photographs. TXT: The provided text files represent the navigation files, FACS log, metadata and read-me files collected during and after the survey. KML: The KML provided may be viewed with Google Earth (http://www.google.com/earth/download/ge/agree.html). in format CSV, JPEG, TXT, KML
      Network links: http://pubs.usgs.gov/ds/0990
    • Cost to order the data: Prices vary. None, if obtained online.

    • Special instructions:
      Publications are available from USGS Information Services, Box 25286, Federal Center, Denver, CO, 80225-0046 (telephone: 1-888-ASK-USGS, e-mail: infoservices@usgs.gov).

Who wrote the metadata?

Dates:
Last modified: 13-Oct-2020
Metadata author:
K. Morgan
USGS
Geologist
600 4th Street South
St. Petersburg, FL
USA

(727) 502-8037 (voice)
kmorgan@usgs.gov
Metadata standard:
FGDC Content Standards for Digital Geospatial Metadata (FGDC-STD-001-1998)

This page is <https://cmgds.marine.usgs.gov/catalog/spcmsc/ds990_metadata.faq.html>
Generated by mp version 2.9.50 on Tue Sep 21 18:18:54 2021