Archive of Boomer and Chirp Seismic Reflection Data Collected During USGS Cruise 01RCE02, Southern Louisiana, April and May 2001

Metadata also available as - [Outline] - [Parseable text] - [XML]

Frequently anticipated questions:


What does this data set describe?

Title:
Archive of Boomer and Chirp Seismic Reflection Data Collected During USGS Cruise 01RCE02, Southern Louisiana, April and May 2001
Abstract:
This archive consists of two-dimensional marine seismic reflection profile data collected in the Mississippi River Delta, Atchafalaya River Delta, and Shell Island Pass in southern Louisiana. These data were acquired in April and May of 2001 aboard the R/V G. K. Gilbert. The data are available in a variety of formats, including binary, ASCII, HTML, shapefiles, and GIF and JPEG images. Binary data are in Society of Exploration Geophysicists (SEG) SEG-Y format and may be downloaded for further processing or display. Reference maps and GIF images of the profiles may be viewed with your web browser. The GIS information provided is compatible with ESRI's GIS software.
For more information on the seismic surveys see http://walrus.wr.usgs.gov/infobank/g/g201la/html/g-2-01-la.meta.html
These data are also available via GeoMapApp (http://www.geomapapp.org/) and Virtual Ocean ( http://www.virtualocean.org/) earth science exploration and visualization applications.
Supplemental_Information:
The USGS Center for Coastal and Watershed Studies team in St. Petersburg, FL, assigns a unique identifier to all seismic data collected during each cruise or field activity. The method used to assign the identifier for the activity is as follows: YYPRO##, where YY stands for the last 2 digits of the year in which the fieldwork is conducted; PRO is a 3-digit acronym for the project the data are collected for; and ## is a 2-digit event tag that represents a discreet leg or time period of fieldwork. Here, 01RCE02 tells us the data were collected in 2001 for the River Contaminant Evaluation Project and that the data were collected during the second field activity for that calendar year. The trackline naming convention the center uses for each seisimic line is as follows: yye###a, where yy is the last 2 digits of the year in which the data were collected; e is a 1-digit abbreviation for the equipment type (i.e. c for chirp and b for boomer); ### is a 3-digit number representing a specific track; and a is a 1-digit alphanumeric representing the section of a track if recording was prematurely terminated. Seismic reflection profiles are acquired by means of an acoustic source (usually generated electronically) and hydrophone or receiver arrays. Both elements are typically towed in the water behind a survey vessel. The sound source emits a short acoustic pulse that propagates through the water and sediment columns. The acoustic energy is reflected at density boundaries (such as the seafloor or sediment layers beneath the seafloor) and detected at the receiver. This process is repeated at intervals ranging between 100 ms and 1 s depending on the source type. In this way, a two-dimensional image of the geologic structure beneath the ship track is constructed. Seismic data were stored in SEG-Y format, which is a standard digital format that can be read and manipulated by most seismic processing software packages. The SEG-Y file format includes a 3,200-byte descriptive header that contains detailed information regarding the data acquisition and processing parameters. All data presented here are stored in SEG-Y, integer, Motorola format. The SEG-Y formatted trace data files have a .TRA extension. Additional recording parameters for each seismic data file can also be found in the .PAR file associated with each .TRA file. However, the .PAR, UTM_401_1.pln, and cent_rmc.pln files are only needed to process or display the data with Triton Elics Delph Seismic software. The boomer energy source consists of capacitors that are charged to a high voltage and then discharged through a transducer in the water. The frequency range of the source is between 300 and 3000 Hz. The transducer was towed on a sled at the sea surface providing 100 joules per shot. The reflected energy was received by an Innovative Technologies, Inc. (ITI) ST-5 solid core streamer and recorded by PC-based Triton Elics Delph Seismic acquisition software. The streamer contains 10 hydrophones evenly spaced over 6 m. Only data received by elements 3, 4, 5, and 6 were summed. The streamer was positioned parallel to the boomer sled and laterally separated from it by about 7 m. The sled was towed about 20 m behind the GPS antenna. The sample frequency of the data was 12 kHz, and the total record length was 100 ms. The fire rate was every 0.5 s, which resulted in a shot spacing of about 1 m based on survey speeds of 3.5 - 4 knots. The chirp data use a signal of continuously varying frequency. The seismic source employed for the chirp data consisted of an EdgeTech X-Star SP424 tow fish running Triton Elics FSSB software. The tow fish was routinely flown 2 - 5 m above the seafloor. Therefore, water depths shown on the chirp profiles are relative to the depth of the tow fish and not to sea level. Furthermore, the raising or lowering of the tow fish during a survey to avoid obstacles or follow relief produces a relative shift in the multiple reflections seen in the profile, which may be confused as a geologic feature. Any elevation change of the tow fish is recorded in the crew logbook. The fish was towed about 10 m behind the GPS antenna, and no correction for this offset has been made. The sample frequency of the data was 25 kHz. Tracklines 01c001 - 01c009 were shot every 0.25 s to a record length of 50 ms, and tracklines 01c010 - 01c011b were shot every 0.125 s to a record length of 33 ms. Based on survey speeds of 3.5 - 4 knots, the shot spacing for the fire rate of 0.25 s was about 0.5 m, and the shot spacing for the fire rate of 0.125 s was about 0.25 m. For each recorded shot of the chirp data, 3 channels of trace data were collected. Channel 3 is the "real," or in-phase component of the signal, channel 2 is the "imaginary," or quadrative component of the signal, and channel 1 is the "envelope," or product of channels 2 and 3. Only channel 1 was used to produce the profiles presented here. However, all channels are included in the SEG-Y data files. The original trackline 01c011 was divided into 01c011a and 01c011b because the number of traces exceeded the maximum allowed by the processing system. GPS navigation was provided to the acquisition system every second by a Trimble-Centurian P-Code receiver. The accuracy of this receiver is to within 100 m. However, the data required some editing to remove spurious data values. The edited results were used to generate the trackline maps presented here. In addition, we have converted the latitude and longitude coordinates to UTM coordinates for UTM Zone 15. The navigation data have not been corrected to reflect the offset between the source and the GPS antenna. Position fixes for every 500 shots and for the start of line are also provided as an aid for registering of the data after plotting. Because boomer and chirp data are collected at different frequencies, position fixes for each system are provided. All navigation files are stored as flat ASCII text files. The trackline maps provided in this archive are in geographic projection. They were created using ESRI's GIS software ArcView 3.2, exported to Adobe Illustrator for further editing, and saved for the web in JPEG format. These JPEG images are viewable with your WWW browser. Included on this disc are the ArcView projects and associated shapefiles used to create the trackline maps presented here. The projects were created with ArcView 3.2 and are compatible with ArcView 3.x (Unix or Windows) and ArcGIS 8.x (Windows). The shapefiles can also be viewed using the public domain software ArcExplorer 2.0 (Windows) and 4.0 (Windows, Unix, Linux), which can be downloaded from the ESRI website at <http://www.esri.com/software/arcexplorer/index.html>. Field Activity Collection System (FACS) logs are available in both HTML and Rich Text format (.rtf). Scanned GIF images of the original FACS logbooks and crew logbooks are also provided. Also included on this DVD are Seismic Unix (SU) scripts that allow the user to strip off navigation fixes from the SEG-Y headers, along with a fix for every 500 shots (boomer data) or every 1,000 shots (chirp data), and produce a filtered (boomer data only) and gained, and a GIF image of each profile. These images can then be displayed using a variety of shareware programs such as ImageMagick (Unix or Linux) or a web browser.
  1. How might this data set be cited?
    Calderon, Karynna, Dadisman, Shawn V., Flocks, James G., and Wiese, Dana S., 2003, Archive of Boomer and Chirp Seismic Reflection Data Collected During USGS Cruise 01RCE02, Southern Louisiana, April and May 2001: U.S. Geological Survey Open-File Report 2003-88, U.S. Geological Survey, St. Petersburg, FL.

    Online Links:

  2. What geographic area does the data set cover?
    West_Bounding_Coordinate: -91.445162
    East_Bounding_Coordinate: -89.072237
    North_Bounding_Coordinate: 29.509807
    South_Bounding_Coordinate: 28.966402
  3. What does it look like?
    http://cmgds.marine.usgs.gov/images/browse/01RCE02/BOOMER/basemap.jpg (JPEG)
    Trackline map of all boomer data collected during USGS Cruise 01RCE02. These data were collected in Louisiana river deltas in April and May of 2001. This map is in geographic projection and was created at a scale of 1:1,200,000 using ESRI's GIS software ArcView 3.2. The image was exported to Adobe Illustrator for further editing and saved for the web in JPEG format. The USGS is not the originator of all layers used in creating this map. The rivers layer is a LOSCO (Louisiana Oil Spill Coordinator's Office) dataset derived from ESRI/GDT (Geographic Data Technology, Inc.) data that were in turn derived from Bureau of the Census TIGER/Line files. The waterbodies layer is also a LOSCO dataset derived from ESRI/GDT data.
    http://cmgds.marine.usgs.gov/images/browse/01RCE02/BOOMER/mapa.jpg (JPEG)
    Trackline map of boomer data collected in the Mississippi River Delta (lines 01b001 - 01b010--refer to area A of the full survey area map) during USGS Cruise 01RCE02 in April of 2001. This map is in geographic projection and was created at a scale of 1:150,000 using ESRI's GIS software ArcView 3.2. The image was exported to Adobe Illustrator for further editing and saved for the web in JPEG format. The USGS is not the originator of all layers used in creating this map. The waterbodies layer is a LOSCO (Louisiana Oil Spill Coordinator's Office) dataset derived from ESRI/GDT data.
    http://cmgds.marine.usgs.gov/images/browse/01RCE02/BOOMER/mapb.jpg (JPEG)
    Trackline map of boomer data collected in the Atchafalaya River Delta and Shell Island Pass (lines 01b011 - 01b015--refer to area B of the full survey area map) during USGS Cruise 01RCE02 in May of 2001. This map is in geographic projection and was created at a scale of 1:86,000 using ESRI's GIS software ArcView 3.2. The image was exported to Adobe Illustrator for further editing and saved for the web in JPEG format. The USGS is not the originator of all layers used in creating this map. The rivers layer is a LOSCO (Louisiana Oil Spill Coordinator's Office) dataset derived from ESRI/GDT (Geographic Data Technology, Inc.) data that were in turn derived from Bureau of the Census TIGER/Line files. The waterbodies layer is also a LOSCO dataset derived from ESRI/GDT data.
    http://cmgds.marine.usgs.gov/images/browse/01RCE02/BOOMER/mapa1.jpg (JPEG)
    Trackline map of boomer data collected in South Pass of the Mississippi River Delta (parts of lines 01b001 and 01b002--refer to area A1 of Boomer Map A) during USGS Cruise 01RCE02 in April of 2001. This map is in geographic projection and was created at a scale of 1:25,000 using ESRI's GIS software ArcView 3.2. The image was exported to Adobe Illustrator for further editing and saved for the web in JPEG format. The USGS is not the originator of all layers used in creating this map. The waterbodies layer is a LOSCO (Louisiana Oil Spill Coordinator's Office) dataset derived from ESRI/GDT data.
    http://cmgds.marine.usgs.gov/images/browse/01RCE02/BOOMER/mapa2.jpg (JPEG)
    Trackline map of boomer data collected in South Pass of the Mississippi River Delta (parts of lines 01b003 and 01b007--refer to area A2 of Boomer Map A) during USGS Cruise 01RCE02 in April of 2001. This map is in geographic projection and was created at a scale of 1:25,000 using ESRI's GIS software ArcView 3.2. The image was exported to Adobe Illustrator for further editing and saved for the web in JPEG format. The USGS is not the originator of all layers used in creating this map. The waterbodies layer is a LOSCO (Louisiana Oil Spill Coordinator's Office) dataset derived from ESRI/GDT data.
    http://cmgds.marine.usgs.gov/images/browse/01RCE02/BOOMER/mapa3.jpg (JPEG)
    Trackline map of boomer data collected in Pass-A-Loutre of the Mississippi River Delta (parts of lines 01b006 and 01b008 - 01b010--refer to area A3 of Boomer Map A) during USGS Cruise 01RCE02 in April of 2001. This map is in geographic projection and was created at a scale of 1:25,000 using ESRI's GIS software ArcView 3.2. The image was exported to Adobe Illustrator for further editing and saved for the web in JPEG format. The USGS is not the originator of all layers used in creating this map. The waterbodies layer is a LOSCO (Louisiana Oil Spill Coordinator's Office) dataset derived from ESRI/GDT data.
    http://cmgds.marine.usgs.gov/images/browse/01RCE02/CHIRP/basemap.jpg (JPEG)
    Trackline map of all chirp data collected during USGS Cruise 01RCE02. These data were collected in Louisiana river deltas in April and May of 2001. This map is in geographic projection and was created at a scale of 1:1,200,000 using ESRI's GIS software ArcView 3.2. The image was exported to Adobe Illustrator for further editing and saved for the web in JPEG format. The USGS is not the originator of all layers used in creating this map. The rivers layer is a LOSCO (Louisiana Oil Spill Coordinator's Office) dataset derived from ESRI/GDT (Geographic Data Technology, Inc.) data that were in turn derived from Bureau of the Census TIGER/Line files. The waterbodies layer is also a LOSCO dataset derived from ESRI/GDT data.
    http://cmgds.marine.usgs.gov/images/browse/01RCE02/CHIRP/mapa.jpg (JPEG)
    Trackline map of chirp data collected in the Mississippi River Delta (lines 01c001 - 01c006--refer to area A of the full survey area map) during USGS Cruise 01RCE02 in April of 2001. This map is in geographic projection and was created at a scale of 1:150,000 using ESRI's GIS software ArcView 3.2. The image was exported to Adobe Illustrator for further editing and saved for the web in JPEG format. The USGS is not the originator of all layers used in creating this map. The waterbodies layer is a LOSCO (Louisiana Oil Spill Coordinator's Office) dataset derived from ESRI/GDT data.
    http://cmgds.marine.usgs.gov/images/browse/01RCE02/CHIRP/mapb.jpg (JPEG)
    Trackline map of chirp data collected in the Atchafalaya River Delta and Shell Island Pass (lines 01c007 - 01c011b--refer to area B of the full survey area map) during USGS Cruise 01RCE02 in May of 2001. This map is in geographic projection and was created at a scale of 1:86,000 using ESRI's GIS software ArcView 3.2. The image was exported to Adobe Illustrator for further editing and saved for the web in JPEG format. The USGS is not the originator of all layers used in creating this map. The rivers layer is a LOSCO (Louisiana Oil Spill Coordinator's Office) dataset derived from ESRI/GDT (Geographic Data Technology, Inc.) data that were in turn derived from Bureau of the Census TIGER/Line files. The waterbodies layer is also a LOSCO dataset derived from ESRI/GDT data.
    http://cmgds.marine.usgs.gov/images/browse/01RCE02/CHIRP/mapa1.jpg (JPEG)
    Trackline map of chirp data collected in Pass-A-Loutre of the Mississippi River Delta (parts of lines 01c002 and 01c004 - 01c006--refer to area A1 of Chirp Map A) during USGS Cruise 01RCE02 in April of 2001. This map is in geographic projection and was created at a scale of 1:25,000 using ESRI's GIS software ArcView 3.2. The image was exported to Adobe Illustrator for further editing and saved for the web in JPEG format. The USGS is not the originator of all layers used in creating this map. The waterbodies layer is a LOSCO (Louisiana Oil Spill Coordinator's Office) dataset derived from ESRI/GDT data.
    http://cmgds.marine.usgs.gov/images/browse/01RCE02/CHIRP/mapb1.jpg (JPEG)
    Trackline map of chirp data collected in Shell Island Pass (parts of lines 01c011a and 01c011b --refer to area B1 of Chirp Map B) during USGS Cruise 01RCE02 in May of 2001. This map is in geographic projection and was created at a scale of 1:32,000 using ESRI's GIS software ArcView 3.2. The image was exported to Adobe Illustrator for further editing and saved for the web in JPEG format. The USGS is not the originator of all layers used in creating this map. The rivers layer is a LOSCO (Louisiana Oil Spill Coordinator's Office) dataset derived from ESRI/GDT (Geographic Data Technology, Inc.) data that were in turn derived from Bureau of the Census TIGER/Line files. The waterbodies layer is also a LOSCO dataset derived from ESRI/GDT data.
    http://cmgds.marine.usgs.gov/images/browse/01RCE02/CHIRP/mapb2.jpg (JPEG)
    Trackline map of chirp data collected in the Atchafalaya River Delta (parts of lines 01c010 and 01c011b--refer to area B2 of Chirp Map B) during USGS Cruise 01RCE02 in May of 2001. This map is in geographic projection and was created at a scale of 1:32,000 using ESRI's GIS software ArcView 3.2. The image was exported to Adobe Illustrator for further editing and saved for the web in JPEG format. The USGS is not the originator of all layers used in creating this map. The rivers layer is a LOSCO (Louisiana Oil Spill Coordinator's Office) dataset derived from ESRI/GDT (Geographic Data Technology, Inc.) data that were in turn derived from Bureau of the Census TIGER/Line files. The waterbodies layer is also a LOSCO dataset derived from ESRI/GDT data.
  4. Does the data set describe conditions during a particular time period?
    Beginning_Date: 26-Apr-2001
    Ending_Date: 03-May-2001
    Currentness_Reference:
    Data collection interval
  5. What is the general form of this data set?
    Geospatial_Data_Presentation_Form: Seismic Reflection Profile Section
  6. How does the data set represent geographic features?
    1. How are geographic features stored in the data set?
      Indirect_Spatial_Reference:
      Horizontal X and Y locations (both UTMs and latitude and longitude) for each shot location are provided in ASCII position files, along with the time the shot was recorded in Greenwich Mean Time. --------------------------------------------------------------------------------
    2. What coordinate system is used to represent geographic features?
      Horizontal positions are specified in geographic coordinates, that is, latitude and longitude. Latitudes are given to the nearest 0.0000027. Longitudes are given to the nearest 0.0000027. Latitude and longitude values are specified in Decimal degrees. The horizontal datum used is WGS84.
      The ellipsoid used is WGS84.
      The semi-major axis of the ellipsoid used is 6378137.
      The flattening of the ellipsoid used is 1/298.257.
  7. How does the data set describe geographic features?
    Entity_and_Attribute_Overview:
    Binary data file: Each profile is available as a binary file in Society of Exploration Geophysicists (SEG) SEG-Y format. A SEG-Y file consists of 1) a 3,200-byte file identification record of ASCII-formatted general information, 2) a 400-byte binary record with information such as sample rate and record length specific to the dataset, and 3) multiple records, with one seismic reflection trace per record for the boomer data and three for the chirp data. Each trace record is preceded by a 240-byte trace header containing information such as trace number and acquisition day and time specific to each trace. The trace data are represented as a time series of unitless 16-bit integer or 32-bit real numbers proportional to the reflection coefficient. The SEG-Y file is useful only if you have access to specialized software designed to process and display seismic reflection data. These SEG-Y files have a .TRA extension and range in size from 12.1 to 286.7 MB.
    Entity_and_Attribute_Overview:
    Graphic image file: Each profile is available as a GIF image. The trackline maps provided are JPEG images that contain hotlinks to the seismic profile GIF images. The profiles range in size from 1.8 to 11.3 MB. --------------------------------------------------------------------------------
    Entity_and_Attribute_Detail_Citation:
    Barry, K.M., Cavers, D.A., and Kneale, C.W., 1975, Recommended standards for digital tape formats: Geophysics, v. 40, n.2, p. 344-352. Also available online at: <http://www.seg.org/publications/tech-stand/index_body.html>.

Who produced the data set?

  1. Who are the originators of the data set? (may include formal authors, digital compilers, and editors)
    • Karynna Calderon
    • Shawn V. Dadisman
    • James G. Flocks
    • Dana S. Wiese
  2. Who also contributed to the data set?
    We thank Gina M. Peery and Greg Berman of the USGS in St. Petersburg, FL, for their field support during data collection. Boat captains Dave Bennett of Eckerd College in St. Petersburg, FL, and Keith Ludwig of the USGS in St. Petersburg, FL, also assisted in data collection. We also thank reviewers Peter W. Swarzenski and Jack L. Kindinger of the USGS in St. Petersburg, FL, whose comments improved this document.
  3. To whom should users address questions about the data?
    James G. Flocks
    U.S. Geological Survey
    Geologist
    600 Fourth Street South
    St. Petersburg, FL
    USA

    (727) 803-8747, ext. 3012 (voice)
    jflocks@usgs.gov

Why was the data set created?

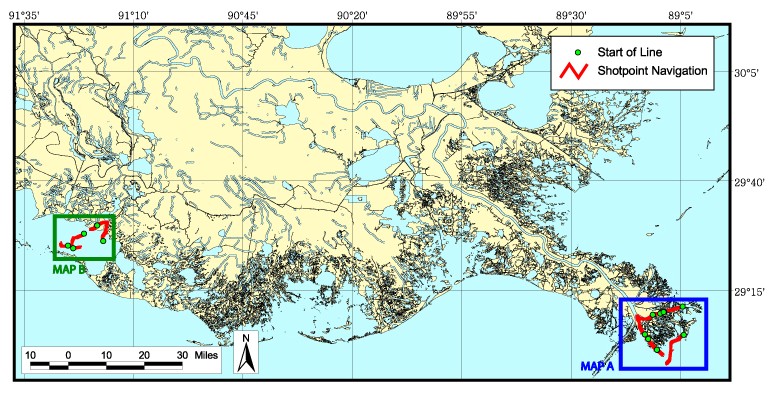
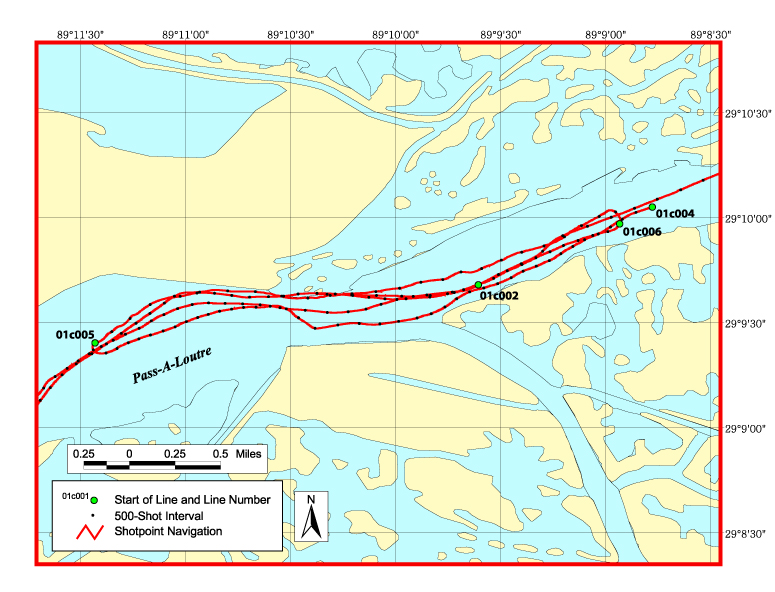
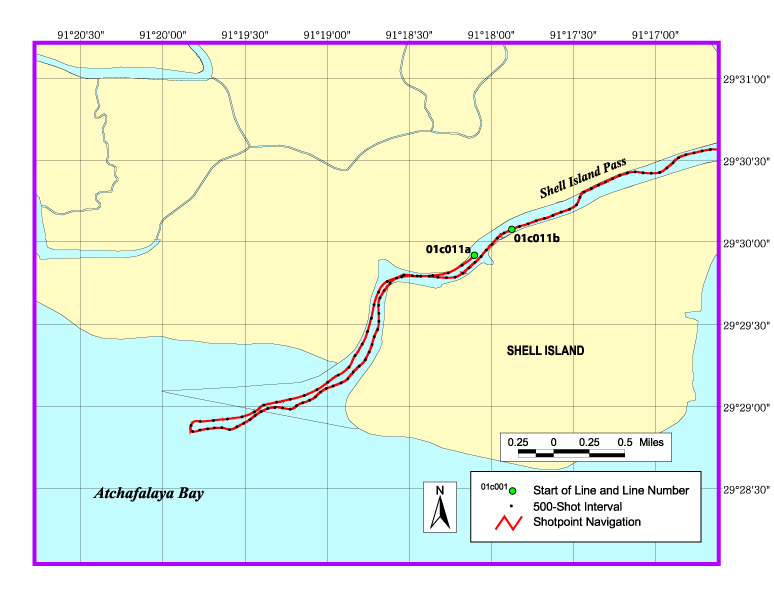
Marine seismic reflection data are used to image and map sedimentary and structural features of the seafloor and subsurface. These data are useful in mapping stratigraphy and in assessing other submarine geologic characteristics and features. These data were collected as part of a larger USGS River Contaminant Evaluation (RCE) Project.

How was the data set created?

  1. From what previous works were the data drawn?
  2. How were the data generated, processed, and modified?
    Date: 2002 (process 1 of 7)
    Boomer processing: Raw SEG-Y data were processed with Seismic Unix to produce the GIF-formatted seismic profiles included in this report. A representative data processing sequence consisted of: 1)Bandpass filter: 300-500-2500-3000 Hz 2)Automatic gain control 3)Postscript display 4)Convert Postscript to GIF format
    Date: 2002 (process 2 of 7)
    Chirp processing: Raw SEG-Y data were processed with Seismic Unix to produce the GIF-formatted seismic profiles included in this report. A representative data processing sequence consisted of: 1)Stripped off channel 1 for each shot 2)Automatic gain control 3)Postscript display 4)Convert Postscript to GIF format
    Date: 2002 (process 3 of 7)
    Positional (navigation) data: As the seismic reflection data were acquired, the position of the vessel was continuously determined by a GPS receiver. Positions were recorded approximately every second and written to the SEG-Y header. The ASCII navigation and the 500-shot interval navigation files were extracted from the SEG-Y headers using Seismic Unix scripts.
    Date: 2002 (process 4 of 7)
    Editing navigation: The ASCII navigation files were extracted from the SEG-Y headers and edited to remove spurious data points. The data were then processed using PROJ.4 freeware to convert latitude and longitude coordinates to UTMs (Zone 15). The data were also reformatted for use with ESRI's GIS software ArcView 3.2.
    Date: 2002 (process 5 of 7)
    Open-File preparation: No processing has been done to the SEG-Y data files provided on this DVD. The data were displayed as 8-bit gray scale Postscript files using the Seismic Unix 'psimage' algorithm. The Postscript images were then converted to GIF images with ImageMagick.
    Date: 24-Jan-2017 (process 6 of 7)
    Keywords section of metadata optimized for discovery in USGS Coastal and Marine Geology Data Catalog. Person who carried out this activity:
    U.S. Geological Survey
    Attn: Alan O. Allwardt
    Contractor -- Information Specialist
    2885 Mission Street
    Santa Cruz, CA

    831-460-7551 (voice)
    831-427-4748 (FAX)
    aallwardt@usgs.gov
    Date: 13-Oct-2020 (process 7 of 7)
    Added keywords section with USGS persistent identifier as theme keyword. Person who carried out this activity:
    U.S. Geological Survey
    Attn: VeeAnn A. Cross
    Marine Geologist
    384 Woods Hole Road
    Woods Hole, MA

    508-548-8700 x2251 (voice)
    508-457-2310 (FAX)
    vatnipp@usgs.gov
  3. What similar or related data should the user be aware of?

How reliable are the data; what problems remain in the data set?

  1. How well have the observations been checked?
    The validity or accuracy of marine seismic reflection profiles is highly qualitative and depends on equipment and operating condition variables. Visual inspection of the images rendered from the data did not show any major anomalies. The original trackline 01c011 was divided into 01c011a and 01c011b because the number of traces exceeded the maximum allowed by the processing system.
  2. How accurate are the geographic locations?
    The positional accuracy was determined with a Trimble-Centurian P-Code receiver. The accuracy of this receiver is to within 100 m. For boomer line 01b001, the GPS data were fed to a navigation computer running Hypack software, which converted the data to UTMs. The UTM string was then fed to the Delph Seismic acquisition software and recorded in the SEG-Y headers for each trace. For all other lines, the GPS string was fed directly to the Delph Seismic acquisition system, and navigation fixes were recorded in latitude and longitude in the SEG-Y headers.
  3. How accurate are the heights or depths?
    Boomer data are relative to sea level. Chirp data depth is relative to the depth of the tow fish.
  4. Where are the gaps in the data? What is missing?
    These data are collected along tracklines (2D). Therefore, data are inherently incomplete. Geologic details between lines must be inferred. All boomer tracklines were recorded to 100 ms. Chirp tracklines 01c001 - 01c009 were recorded to 50 ms, and lines 01c010 - 01c011b were recorded to 33 ms.
  5. How consistent are the relationships among the observations, including topology?
    These datasets are from one cruise with consistent instrument calibrations.

How can someone get a copy of the data set?

Are there legal restrictions on access or use of the data?
Access_Constraints: None. These data are held in the public domain.
Use_Constraints:
The U.S. Geological Survey requests to be acknowledged as the originator of the data in future products or derivative research.
  1. Who distributes the data set? (Distributor 1 of 1)
    Shawn V. Dadisman
    U.S. Geological Survey
    Geologist
    600 Fourth Street South
    St. Petersburg, FL
    USA

    (727) 803-8747, ext. 3029 (voice)
    sdadisman@usgs.gov
    Contact_Instructions:
    Data may be available on-line only by special arrangement with the distributor above.
  2. What's the catalog number I need to order this data set? U.S. Geological Survey Open-File Report 03-88 DVD
  3. What legal disclaimers am I supposed to read?
    This Digital Versatile Disc (DVD) publication was prepared by an agency of the United States Government. Neither the United States Government nor any agency thereof, nor any of their employees, make any warranty, expressed or implied, or assumes any legal liability or responsibility for the accuracy, completeness, or usefulness of any information, apparatus, product, or process disclosed in this report, or represents that its use would not infringe privately owned rights. Reference therein to any specific commercial product, process, or service by trade name, trademark, manufacturer, or otherwise does not necessarily constitute or imply its endorsement, recommendation, or favoring by the United States Government or any agency thereof. Any views and opinions of authors expressed herein do not necessarily state or reflect those of the United States Government or any agency thereof. Although all data published on this DVD have been used by the USGS, no warranty, expressed or implied, is made by the USGS as to the accuracy of the data and related materials and/or the functioning of the software. The act of distribution shall not constitute any such warranty, and no responsibility is assumed by the USGS in the use of this data, software, or related materials.
  4. How can I download or order the data?
    • Availability in digital form:
      Data format: The SEG-Y standard format (Barry et al., 1975) consists of the following: a 3,600-byte reel identification header with the first 3,200 bytes consisting of an ASCII header block and a 400-byte binary header block that both include information specific to line and reel number, a trace data block that follows the reel identification header with the first 240 bytes of each trace block consisting of the binary trace identification header, and seismic data samples that follow the trace identification header. in format SEG-Y Size: 2470
      Media you can order: DVD (format ISO 9660)
      Note: UNIX, LINUX, DOS, MAC
      Data format: GIS projects and layers used to create the boomer trackline maps presented in this archive and associated metadata. in format ESRI project, shapefile, metadata Size: 20.4
      Network links: https://pubs.usgs.gov/of/2003/of03-088/SOFTWARE/ARC/BOOMER.ZIP
      Data format: GIS projects and layers used to create the chirp trackline maps presented in this archive and associated metadata. in format ESRI project, shapefile, metadata Size: 20.1
      Network links: https://pubs.usgs.gov/of/2003/of03-088/SOFTWARE/ARC/CHIRP.ZIP
      Data format: The SEG-Y standard format (Barry et al., 1975) consists of the following: a 3,600-byte reel identification header with the first 3,200 bytes consisting of an ASCII header block and a 400-byte binary header block that both include information specific to line and reel number, a trace data block that follows the reel identification header with the first 240 bytes of each trace block consisting of the binary trace identification header, and seismic data samples that follow the trace identification header. in format SEGY data download Size: 2.470
      Network links: https://cmgds.marine.usgs.gov/data/01rce02/boomer/
      https://cmgds.marine.usgs.gov/data/01rce02/chirp/
    • Cost to order the data: Available from USGS Information Services. Prices vary.

    • Special instructions:
      Most open-file reports are available from USGS Information Services, Box 25286, Federal Center, Denver, CO 80225-0046 (telephone: 1-888-ASK-USGS; email: infoservices@usgs.gov).
  5. What hardware or software do I need in order to use the data set?
    Use of SEG-Y data requires specialized seismic processing software, such as Unix or Linux based public domain software Seismic Unix (SU) developed by the Colorado School of Mines Center for Wave Phenomena, which can be downloaded at <http://www.cwp.mines.edu/cwpcodes/index.html>. --------------------------------------------------------------------------------

Who wrote the metadata?

Dates:
Last modified: 13-Oct-2020
Metadata author:
Karynna Calderon
U.S. Geological Survey
Geographer, Data Management Group
600 Fourth Street South
St. Petersburg, FL
USA

(727) 803-8747, ext. 3143 (voice)
kcalderon@usgs.gov
Metadata standard:
Content Standard for Digital Geospatial Metadata (FGDC-STD-001-1998 --------------------------------------------------------------------------------)

This page is <https://cmgds.marine.usgs.gov/catalog/spcmsc/of2003-88metadata.faq.html>
Generated by mp version 2.9.50 on Tue Sep 21 18:18:55 2021