Online Links:
Online Links:
| Range of values | |
|---|---|
| Minimum: | 234 |
| Maximum: | 240 |
| Units: | days |
| Resolution: | 1 |
| Range of values | |
|---|---|
| Minimum: | 2012 |
| Maximum: | 2012 |
| Units: | years |
| Resolution: | 1 |
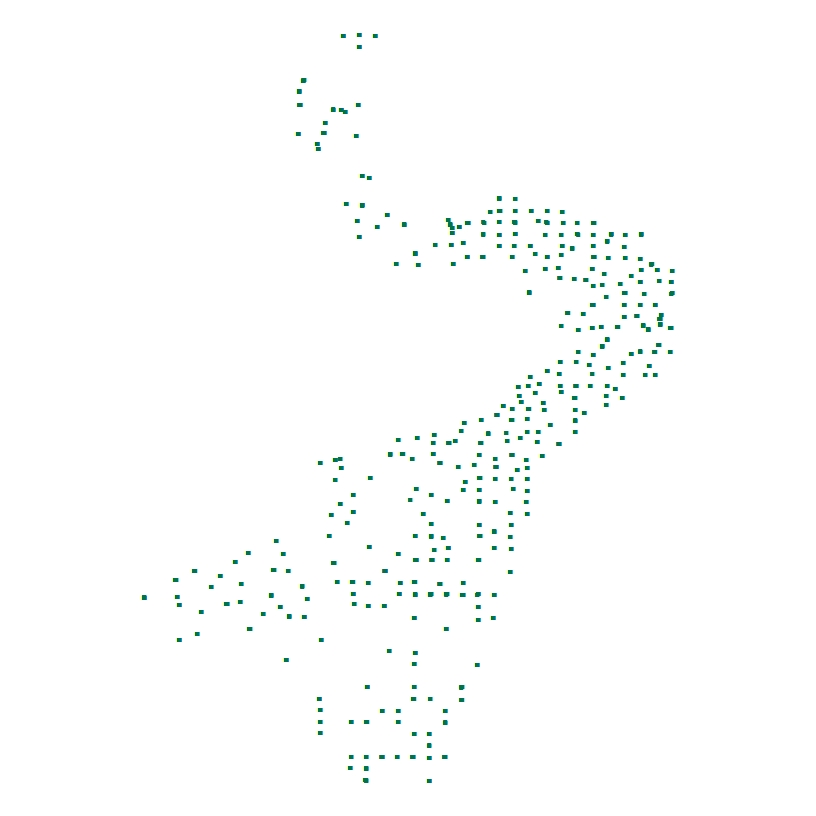
| Range of values | |
|---|---|
| Minimum: | 42.29704000 |
| Maximum: | 42.87339670 |
| Units: | decimal degrees |
| Resolution: | 0.00000001 |
| Range of values | |
|---|---|
| Minimum: | -70.90712330 |
| Maximum: | -70.49866670 |
| Units: | decimal degrees |
| Resolution: | 0.00000001 |
| Value | Definition |
|---|---|
| CLAYEY SILT | Silt less than 75 percent and equal to or greater than 50 percent, clay greater than sand, and sand less than 20 percent. |
| GRAVEL | Gravel equal to or greater than 50 percent. |
| GRAVELLY SEDIMENT | Gravel equal to or greater than 10 percent, but less than 50 percent. |
| MUD | Mud (silt plus clay) equal to or greater than 50 percent based on visual observation. |
| SAND | Sand equal to or greater than 75 percent. |
| SAND SILT CLAY | Clay, sand, and silt greater than 20 percent each. |
| SANDY SILT | Silt less than 75 percent and equal to or greater than 50 percent, sand greater than clay, and clay less than 20 percent. |
| SILTY SAND | Sand less than 75 percent and equal to or greater than 50 percent, silt greater than clay, and clay less than 20 percent. |
| Range of values | |
|---|---|
| Minimum: | 0 |
| Maximum: | 76.7 |
| Units: | meters |
| Resolution: | 0.1 |
Online Links:
Online Links:
Online Links:
Online Links:
Online Links:
| Access_Constraints | None |
|---|---|
| Use_Constraints | Public domain data from the U.S. Government are freely redistributable with proper metadata and source attribution. Please recognize the U.S. Geological Survey as the originator of the dataset. |
| Data format: | The zip file contains a shapefile and CSV file of bottom imagery locations collected by the U.S. Geological Survey Woods Hole Coastal and Marine Science Center and Massachusetts Office of Coastal Zone Management in Ipswich Bay and Massachusetts Bay, Massachusetts, in 2012 and the associated metadata. in format Shapefile (version Esri ArcGIS 10.3.1) Shapefile Size: 0.3 |
|---|---|
| Network links: |
https://cmgds.marine.usgs.gov/data/field-activity-data/2012-035-FA/data/imagery/2012-035-FA_photos_shp.zip https://doi.org/10.5066/P924M8R1 https://cmgds.marine.usgs.gov/data/field-activity-data/2012-035-FA/ |
| Data format: | The zip file contains a shapefile and CSV file of bottom imagery locations collected by the U.S. Geological Survey Woods Hole Coastal and Marine Science Center and Massachusetts Office of Coastal Zone Management in Ipswich Bay and Massachusetts Bay, Massachusetts, in 2012 and the associated metadata. in format CSV (version Microsoft Excel 2016 for Mac) Comma Separated Value (CSV) text file Size: 0.3 |
|---|---|
| Network links: |
https://cmgds.marine.usgs.gov/data/field-activity-data/2012-035-FA/data/imagery/2012-035-FA_photos_shp.zip https://doi.org/10.5066/P924M8R1 https://cmgds.marine.usgs.gov/data/field-activity-data/2012-035-FA/ |
| Data format: | The zip files contain JPEG images of the sea floor collected by the U.S. Geological Survey Woods Hole Coastal and Marine Science Center and Massachusetts Office of Coastal Zone Management in Ipswich Bay and Massachusetts Bay, Massachusetts, in 2012. The images are available in three zip files: 2012-035-FA_photos_jpg1.zip, which contains IMG_0006.JPG through IMG_0680.JPG and has a file size of 1,403.0 MB; 2012-035-FA_photos_jpg2.zip, which contains IMG_0681.JPG through IMG_1435.JPG and has a file size of 1,421.4 MB; and 2012-035-FA_photos_jpg3.zip, which contains IMG_1436.JPG through IMG_2200.JPG and the video frame grabs (STA001_180833.JPG through STA247_150057.JPG), and has a file size of 1,414.2 MB. in format JPEG Size: 4238.6 |
|---|---|
| Network links: |
https://cmgds.marine.usgs.gov/data/field-activity-data/2012-035-FA/data/imagery/2012-035-FA_photos_jpg1.zip https://cmgds.marine.usgs.gov/data/field-activity-data/2012-035-FA/data/imagery/2012-035-FA_photos_jpg2.zip https://cmgds.marine.usgs.gov/data/field-activity-data/2012-035-FA/data/imagery/2012-035-FA_photos_jpg3.zip https://doi.org/10.5066/P924M8R1 https://cmgds.marine.usgs.gov/data/field-activity-data/2012-035-FA/ |