Title:
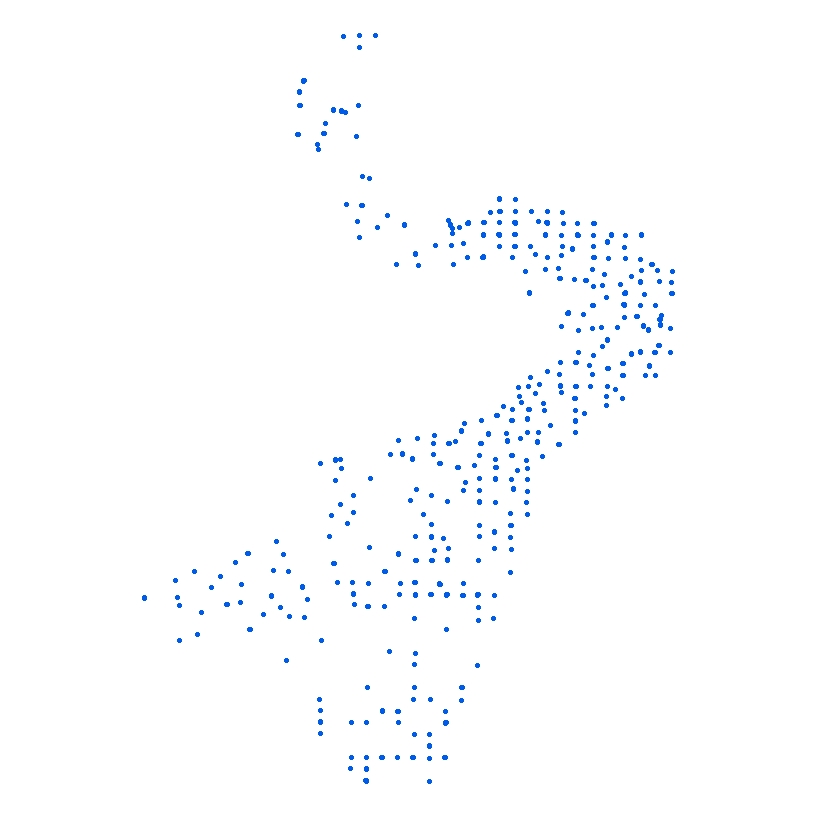
Location of bottom video tracklines collected during field activity 2012-035-FA by the U.S. Geological Survey and Massachusetts Office of Coastal Zone Management in Ipswich Bay and Massachusetts Bay, Massachusetts, in August 2012 (polyline shapefile)
Abstract:
Accurate data and maps of sea-floor geology are important first steps toward protecting habitat, delineating marine resources, and assessing environmental changes due to natural or human effects. Initiated in 2003, the primary objective of the Geologic Mapping of the Massachusetts Sea Floor program is to develop regional geologic framework information for the management of coastal and marine resources. The program is focused on the inshore waters (primarily 5-30 meters deep, although the region surveyed in this field activity includes waters up to 90 meters deep) of Massachusetts. This dataset, collected aboard the Ocean Survey Vessel (OSV) Bold as part of the Geologic Mapping of the Massachusetts Sea Floor Program, is from U.S. Geological Survey (USGS) sampling survey 2012-035-FA (August 21-27, 2012) by the USGS Woods Hole Coastal and Marine Science Center and the Massachusetts Office of Coastal Zone Management with partners from the Massachusetts Bays Program, the Massachusetts Department of Environmental Protection, the Massachusetts Division of Marine Fisheries, and the U.S. Environmental Protection Agency. During the survey, surficial sediment samples and bottom still and video imagery were collected in Ipswich Bay and Massachusetts Bay, Massachusetts.
Supplemental_Information:
To view the bottom videos, see the Coastal and Marine Geology Program Video and Photograph Portal (Golden and others, 2015; link available from the cross-reference citation). Bottom still imagery was also taken at each station (see shapefile 2012-035-FA_photos.shp available from the larger work citation). Physical sediment samples were also collected at many stations and analyzed for grain size (see shapefile 2012-035-FA_samples.shp available from the larger work citation) and benthic infauna (see report by the Massachusetts Office of Coastal Zone Management [2013] available from the cross-reference citation). For more information about this field activity, see
https://cmgds.marine.usgs.gov/fan_info.php?fan=2012-035-FA. For more information about the Geologic Mapping of the Massachusetts Sea Floor program, see
https://woodshole.er.usgs.gov/project-pages/coastal_mass/.