Online Links:
Online Links:
| Range of values | |
|---|---|
| Minimum: | 42.1609 |
| Maximum: | 42.42129 |
| Units: | Decimal degrees |
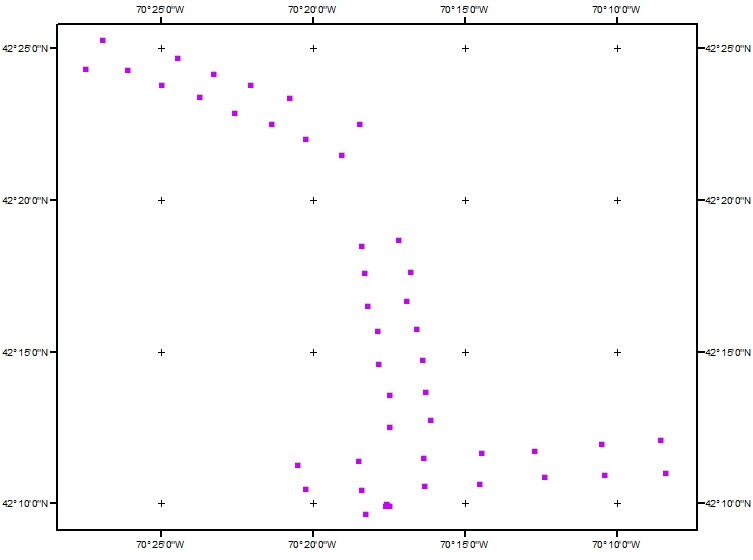
| Range of values | |
|---|---|
| Minimum: | -70.45794 |
| Maximum: | -70.13967 |
| Units: | Decimal degrees |
| Range of values | |
|---|---|
| Minimum: | 20 |
| Maximum: | 43 |
| Units: | meters |
| Range of values | |
|---|---|
| Minimum: | 0 |
| Maximum: | 0 |
| Units: | centimeters |
| Range of values | |
|---|---|
| Minimum: | 2 |
| Maximum: | 2 |
| Units: | centimeters |
| Value | Definition |
|---|---|
| Mini Seaboss w/ 0.1 sq m Van Veen grab | sample collected with the SEABOSS system that uses the 0.1 square meter Van Veen grab. |
| Range of values | |
|---|---|
| Minimum: | 9 |
| Maximum: | 9 |
| Range of values | |
|---|---|
| Minimum: | 12 |
| Maximum: | 14 |
| Range of values | |
|---|---|
| Minimum: | 2017 |
| Maximum: | 2017 |
| Range of values | |
|---|---|
| Minimum: | 12 |
| Maximum: | 12 |
| Range of values | |
|---|---|
| Minimum: | 5 |
| Maximum: | 5 |
| Range of values | |
|---|---|
| Minimum: | 2017 |
| Maximum: | 2017 |
| Range of values | |
|---|---|
| Minimum: | 54.85232 |
| Maximum: | 213.34014 |
| Units: | grams |
| Range of values | |
|---|---|
| Minimum: | 0.02 |
| Maximum: | 43.43 |
| Units: | percent |
| Resolution: | 0.01 |
| Range of values | |
|---|---|
| Minimum: | 56.43 |
| Maximum: | 99.85 |
| Units: | percent |
| Resolution: | 0.01 |
| Range of values | |
|---|---|
| Minimum: | 0 |
| Maximum: | 0.77 |
| Units: | percent |
| Resolution: | 0.01 |
| Range of values | |
|---|---|
| Minimum: | 0 |
| Maximum: | 0.11 |
| Units: | percent |
| Resolution: | 0.01 |
| Value | Definition |
|---|---|
| GRAVEL | gravel equal to or greater than 50 percent |
| GRAVELLY SEDIMENT | gravel equal to or greater than 10 percent, but less than 50 percent |
| SAND | sand equal to or greater than 75 percent |
| SILTY SAND | sand less than 75 percent and equal to or greater than 50 percent, silt greater than clay, and clay less than 20 percent |
| CLAYEY SAND | sand less than 75 percent and equal to or greater than 50 percent, clay greater than silt, and silt less than 20 percent |
| SILT | silt equal to or greater than 75 percent |
| SANDY SILT | silt less than 75 percent and equal to or greater than 50 percent, sand greater than clay, and clay less than 20 percent |
| CLAYEY SILT | silt less than 75 percent and equal to or greater than 50 percent, clay greater than sand, and sand less than 20 percent |
| CLAY | clay equal to or greater than 75 percent |
| SANDY CLAY | clay less than 75 percent and equal to or greater than 50 percent, sand greater than silt, and silt less than 20 percent |
| SILTY CLAY | clay less than 75 percent and equal to or greater than 50 percent, silt greater than sand, and sand less than 20 percent |
| SAND SILT CLAY | clay, sand, and silt greater than 20 percent each |
| Range of values | |
|---|---|
| Minimum: | -0.7 |
| Maximum: | 1.55 |
| Units: | phi |
| Resolution: | 0.01 |
| Range of values | |
|---|---|
| Minimum: | -0.56 |
| Maximum: | 1.56 |
| Units: | phi |
| Resolution: | 0.01 |
| Range of values | |
|---|---|
| Minimum: | 0.53 |
| Maximum: | 1.31 |
| Units: | phi |
| Resolution: | 0.01 |
| Range of values | |
|---|---|
| Minimum: | -0.45 |
| Maximum: | 2.22 |
| Units: | unitless |
| Resolution: | 0.01 |
| Range of values | |
|---|---|
| Minimum: | -0.07 |
| Maximum: | 34.31 |
| Units: | unitless |
| Resolution: | 0.01 |
| Range of values | |
|---|---|
| Minimum: | 0 |
| Maximum: | 0 |
| Units: | percent |
| Resolution: | 0.01 |
| Range of values | |
|---|---|
| Minimum: | 0 |
| Maximum: | 0 |
| Units: | percent |
| Resolution: | 0.01 |
| Range of values | |
|---|---|
| Minimum: | 0 |
| Maximum: | 5.23 |
| Units: | percent |
| Resolution: | 0.01 |
| Range of values | |
|---|---|
| Minimum: | 0 |
| Maximum: | 10.44 |
| Units: | percent |
| Resolution: | 0.01 |
| Range of values | |
|---|---|
| Minimum: | 0.02 |
| Maximum: | 32.99 |
| Units: | percent |
| Resolution: | 0.01 |
| Range of values | |
|---|---|
| Minimum: | 0.52 |
| Maximum: | 73.06 |
| Units: | percent |
| Resolution: | 0.01 |
| Range of values | |
|---|---|
| Minimum: | 15.61 |
| Maximum: | 67.41 |
| Units: | percent |
| Resolution: | 0.01 |
| Range of values | |
|---|---|
| Minimum: | 3.76 |
| Maximum: | 64.77 |
| Units: | percent |
| Resolution: | 0.01 |
| Range of values | |
|---|---|
| Minimum: | 0.15 |
| Maximum: | 22.53 |
| Units: | percent |
| Resolution: | 0.01 |
| Range of values | |
|---|---|
| Minimum: | 0 |
| Maximum: | 0.17 |
| Units: | percent |
| Resolution: | 0.01 |
| Range of values | |
|---|---|
| Minimum: | 0 |
| Maximum: | 0.25 |
| Units: | percent |
| Resolution: | 0.01 |
| Range of values | |
|---|---|
| Minimum: | 0 |
| Maximum: | 0.23 |
| Units: | percent |
| Resolution: | 0.01 |
| Range of values | |
|---|---|
| Minimum: | 0 |
| Maximum: | 0.17 |
| Units: | percent |
| Resolution: | 0.01 |
| Range of values | |
|---|---|
| Minimum: | 0 |
| Maximum: | 0.12 |
| Units: | percent |
| Resolution: | 0.01 |
| Range of values | |
|---|---|
| Minimum: | 0 |
| Maximum: | 0.08 |
| Units: | percent |
| Resolution: | 0.01 |
| Range of values | |
|---|---|
| Minimum: | 0 |
| Maximum: | 0.03 |
| Units: | percent |
| Resolution: | 0.01 |
| Range of values | |
|---|---|
| Minimum: | 0 |
| Maximum: | 0.01 |
| Units: | percent |
| Resolution: | 0.01 |
| Value | Definition |
|---|---|
| Quality grade: A-BJB | A = percent differences between 0% and +- 1.5% assigned by Brian J. Buczkowski. |
Online Links:
Online Links:
| Access_Constraints | None. |
|---|---|
| Use_Constraints | Not to be used for navigation. |
| Data format: | The zip file contains the sediment sample analysis in XLSX, CSV and shapefile formats, along with the FGDC CSDGM metadata. in format XLSX (version Excel 2016) Size: 1 |
|---|---|
| Network links: |
https://cmgds.marine.usgs.gov/data/field-activity-data/2017-044-FA/data/samples/2017-044-FA_sedsamples.zip https://doi.org/10.5066/P9IL0LLO https://cmgds.marine.usgs.gov/data/field-activity-data/2017-044-FA/ |
| Data format: | The zip file contains the sediment sample analysis in XLSX, CSV and shapefile formats, along with the FGDC CSDGM metadata. in format CSV (version exported from Excel 2016) Size: 1 |
|---|---|
| Network links: |
https://cmgds.marine.usgs.gov/data/field-activity-data/2017-044-FA/data/samples/2017-044-FA_sedsamples.zip https://doi.org/10.5066/P9IL0LLO https://cmgds.marine.usgs.gov/data/field-activity-data/2017-044-FA/ |
| Data format: | The zip file contains the sediment sample analysis in XLSX, CSV and shapefile formats, along with the FGDC CSDGM metadata. in format Shapefile (version ArcGIS 10.6.1) Size: 1 |
|---|---|
| Network links: |
https://cmgds.marine.usgs.gov/data/field-activity-data/2017-044-FA/data/samples/2017-044-FA_sedsamples.zip https://doi.org/10.5066/P9IL0LLO https://cmgds.marine.usgs.gov/data/field-activity-data/2017-044-FA/ |