4-m Image of the Northern Half of the Pseudo-colored Backscatter Intensity of the Sea Floor off Northeastern Cape Cod (CAPENORTHPSEUDO_GEO4M_WGS84.TIF, Geographic, WGS84)

Metadata also available as - [Outline] - [Parseable text] - [XML]

Frequently anticipated questions:


What does this data set describe?

Title:
4-m Image of the Northern Half of the Pseudo-colored Backscatter Intensity of the Sea Floor off Northeastern Cape Cod (CAPENORTHPSEUDO_GEO4M_WGS84.TIF, Geographic, WGS84)
Abstract:
This data set includes pseudo-colored backscatter intensity of the sea floor offshore of northeastern Cape Cod, Massachusetts. The data were collected with a multibeam sea floor mapping system during USGS survey 98015, conducted November 9 - 25, 1998. The surveys were conducted using a Simrad EM 1000 multibeam echo sounder mounted aboard the Canadian Coast Guard vessel Frederick G. Creed. This multibeam system utilizes 60 electronically aimed receive beams spaced at intervals of 2.5 degrees that insonify a strip of sea floor up to 7.5 times the water depth (swath width of 100 to 200 m within the survey area). The horizontal resolution of the beam on the sea floor is approximately 10% of the water depth. Vertical resolution is approximately 1 percent of the water depth. With pseudo-colored backscatter intensity, the backscatter intensity is combined with the topography to display the distribution of intensity in relation to the topography. In the image shown here, the backscatter intensity is represented by a suite of eight colors ranging from blue, which represents low intensity, to red, which represents high intensity. These data are draped over a shaded relief image created by vertically exaggerating the topography four times and then artificially illuminating the relief by a light source positioned 45 degrees above the horizon from an azimuth of 0 degrees. The resulting image displays light and dark intensities within each color band that result from a feature's position with respect to the light source. For example, north-facing slopes, receiving strong illumination, show as a light intensity within a color band, whereas south-facing slopes, being in shadow, show as a dark intensity within a color band.
  1. How might this data set be cited?
    U.S. Geological Survey, 2006, 4-m Image of the Northern Half of the Pseudo-colored Backscatter Intensity of the Sea Floor off Northeastern Cape Cod (CAPENORTHPSEUDO_GEO4M_WGS84.TIF, Geographic, WGS84): Open-File Report 2005-1048, U.S. Geological Survey, Woods Hole Coastal and Marine Science Center, Woods Hole, MA.

    Online Links:

    This is part of the following larger work.

    Poppe, L.J., Paskevich, V.F., Butman, B., Ackerman, S.D., Danforth, W.W., Foster, D.S., and Blackwood, D.S., 2006, Geological Interpretation of Bathymetric and Backscatter Imagery of the Sea Floor off Eastern Cape Cod, Massachusetts: Open-File Report 2005-1048, U.S. Geological Survey, Reston, VA.

    Online Links:

  2. What geographic area does the data set cover?
    West_Bounding_Coordinate: -70.307833
    East_Bounding_Coordinate: -69.828333
    North_Bounding_Coordinate: 42.116667
    South_Bounding_Coordinate: 41.966667
  3. What does it look like?
    http://pubs.usgs.gov/of/2005/1048/data/backscatter/pseudocolor/geo/capenorthpseudo_geo4m_wgs84-thumb.gif (GIF)
    Thumbnail image showing data set extent and coverage.
    http://pubs.usgs.gov/of/2005/1048/data/backscatter/pseudocolor/geo/capenorthpseudo_geo4m_wgs84.gif (GIF)
    Image map showing data layer extent and coverage.
  4. Does the data set describe conditions during a particular time period?
    Beginning_Date: 09-Nov-1998
    Ending_Date: 25-Nov-1998
    Currentness_Reference:
    ground condition
  5. What is the general form of this data set?
    Geospatial_Data_Presentation_Form: remote-sensing image
  6. How does the data set represent geographic features?
    1. How are geographic features stored in the data set?
      This is a Raster data set. It contains the following raster data types:
      • Dimensions 4191 x 9986 x 1, type Pixel
    2. What coordinate system is used to represent geographic features?
      Horizontal positions are specified in geographic coordinates, that is, latitude and longitude. Latitudes are given to the nearest 0.000036. Longitudes are given to the nearest 0.000048. Latitude and longitude values are specified in Decimal degrees. The horizontal datum used is World Geodetic System 84.
      The ellipsoid used is World Geodetic System 84.
      The semi-major axis of the ellipsoid used is 6378137.
      The flattening of the ellipsoid used is 1/298.257.
  7. How does the data set describe geographic features?
    Entity_and_Attribute_Overview: There are no attributes associated with the GEOTIFF image.
    Entity_and_Attribute_Detail_Citation: U.S. Geological Survey

Who produced the data set?

  1. Who are the originators of the data set? (may include formal authors, digital compilers, and editors)
    • U.S. Geological Survey
  2. Who also contributed to the data set?
  3. To whom should users address questions about the data?
    Lawrence J. Poppe
    U.S. Geological Survey
    Geologist
    384 Woods Hole Road
    Woods Hole, MA
    USA

    (508) 548-8700 x2314 (voice)
    (508) 457-2310 (FAX)
    lpoppe@usgs.gov

Why was the data set created?

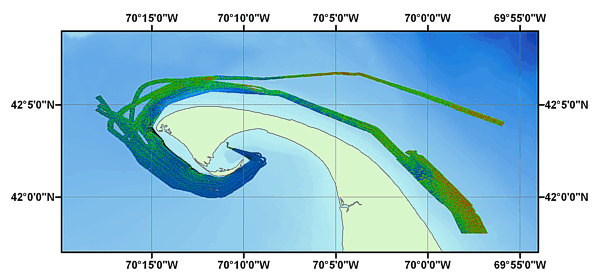
To release a digital map (GeoTIFF image) derived from multibeam observations that shows sea floor pseudo-colored backscatter intensity (a measure of sea floor texture and roughness) at a spatial resolution of 4 m/pixel.

How was the data set created?

  1. From what previous works were the data drawn?
    98015_multibeam_data (source 1 of 1)
    USGS, unpublished material, Raw multibeam data.

    Other_Citation_Details:
    This file had a source contribution, but no source citation information. This information was populated based on information in the source contribution.
    Type_of_Source_Media: DVD-ROM
    Source_Contribution:
    The original multibeam bathymetric data acquired with a Simrad EM 1000 echosounder during USGS cruise 98015 aboard the Canadian Coast Guard vessel Frederick G. Creed.
  2. How were the data generated, processed, and modified?
    Date: Unknown (process 1 of 7)
    (1) Data and acquisition processing at sea: After the echo sounder data were logged onto the hard disk of the Sun workstation, a suite of processing software developed by the Ocean Mapping Group (www.omg.unb.ca/~jhc/SwathEd.html) was used to correct for artifacts and errors that may have been introduced during data collection. This software also enhanced the corrected data by resolving beam pattern and aspect ratio distortions and by imposing a linear contrast stretch before it generated bathymetric and sidescan sonar image mosaics in a Mercator projection. All data processing described here is initiated using Silicon Graphics workstations as soon as each acquisition file is closed by the Simrad Mermaid workstation (usually at the end of each survey line). Additional processing was done in the lab to correct for fluctuations in sea level during the survey and for artifacts in the data files that were not corrected in the field (see below). (2) The processing and editing steps on board the ship were: (A.) Demultiplex, or unravel, the acquired Simrad data files using RT to generate separate files containing navigation, depth soundings, sidescan sonar backscatter values, and sound velocity information. (B.) Automatically reject bad data (autoRejectSoundings). For the multibeam soundings, reject data outside expected depth ranges (operator's decision based on nautical chart data); for navigation data, reject fixes with poor GPS statistics. (C.) Edit the navigation data on-screen using jview to remove undesirable points, including turns at the ends of survey lines. (D.) Edit the multibeam soundings on-screen using swathed to remove individual anomalous soundings. (E). Merge tidal information and the corrected navigation back (mergetide and mergenav) into the data files. Tidal information was obtained from predicted tides using the Xtide program http://www.flaterco.com/xtide/xtide.html), which generated predicted tides based on the harmonic coefficients for Chatham provided by the Xtide program. (F.) Map the bathymetric soundings from each processed data file onto a Mercator grid using weigh_grid (a SwathEd utility) with node spacings and scale selected by the operator. The grid file (capenorth.r4) was a floating point binary file. Person who carried out this activity:
    William Danforth
    U.S. Geological Survey
    Geologist
    384 Woods Hole Road
    Woods Hole, MA
    USA

    (508) 548-8700 x2274 (voice)
    (508) 457-2310 (FAX)
    bdanforth@usgs.gov
    Data sources used in this process:
    • 98015_multibeam_data
    Data sources produced in this process:
    • capenorth.r4
    Date: Unknown (process 2 of 7)
    A pseudo-colored (false colored) image was generated using the SwathEd utility mix_ci by combining the bathymetric and backscatter raster mosaics into a single image in Mercator projection. Person who carried out this activity:
    Bill Danforth
    U.S. Geological Survey
    Geologist
    384 Woods Hole Road
    Woods Hole, MA
    USA

    (508) 548-8700 x2274 (voice)
    (508) 457-2310 (FAX)
    bdanforth@usgs.gov
    Data sources used in this process:
    • capenorth.r4
    Data sources produced in this process:
    • capenorthpseudo_mer4m.tif
    Date: 2005 (process 3 of 7)
    The imagery was converted from Mercator projection to geographic. Person who carried out this activity:
    Valerie Paskevich
    U.S. Geological Survey
    Information Specialist / GIS Coordinator
    384 Woods Hole Road
    Woods Hole, MA
    USA

    (508) 548-8700 x2281 (voice)
    (508) 457-2310 (FAX)
    vpaskevich@usgs.gov
    Data sources used in this process:
    • capenorthpseudo_mer4m.tif
    Data sources produced in this process:
    • capenorthpseudo_geo4m_wgs84.tif
    Date: 09-Nov-2015 (process 4 of 7)
    Edits to the metadata were made to fix any errors that MP v 2.9.30 flagged. This is necessary to enable the metadata to be successfully harvested for various data catalogs. In some cases, this meant adding text "Information unavailable" or "Information unavailable from original metadata" for those required fields that were left blank. Most issues were with blank elements that could actually be removed. This file had a source contribution, but no source citation information. This information was populated based on information in the source contribution. Also, both geographic and planar coordinate systems, a common problem when using ArcCatalog. Other minor edits were probably performed (title, publisher, publication place, etc.). The metadata date (but not the metadata creator) was edited to reflect the date of these changes. The metadata available from a harvester may supersede metadata bundled within a download file. Compare the metadata dates to determine which metadata file is most recent. Person who carried out this activity:
    U.S. Geological Survey
    Attn: VeeAnn A. Cross
    Marine Geologist
    384 Woods Hole Rd.
    Woods Hole, MA

    508-548-8700 x2251 (voice)
    508-457-2310 (FAX)
    vatnipp@usgs.gov
    Date: 20-Jul-2018 (process 5 of 7)
    USGS Thesaurus keywords added to the keyword section. Person who carried out this activity:
    U.S. Geological Survey
    Attn: VeeAnn A. Cross
    Marine Geologist
    384 Woods Hole Road
    Woods Hole, MA

    508-548-8700 x2251 (voice)
    508-457-2310 (FAX)
    vatnipp@usgs.gov
    Date: 18-Nov-2019 (process 6 of 7)
    Crossref DOI link was added as the first link in the metadata. Person who carried out this activity:
    U.S. Geological Survey
    Attn: VeeAnn A. Cross
    Marine Geologist
    384 Woods Hole Road
    Woods Hole, MA

    508-548-8700 x2251 (voice)
    508-457-2310 (FAX)
    vatnipp@usgs.gov
    Date: 08-Sep-2020 (process 7 of 7)
    Added keywords section with USGS persistent identifier as theme keyword. Person who carried out this activity:
    U.S. Geological Survey
    Attn: VeeAnn A. Cross
    Marine Geologist
    384 Woods Hole Road
    Woods Hole, MA

    508-548-8700 x2251 (voice)
    508-457-2310 (FAX)
    vatnipp@usgs.gov
  3. What similar or related data should the user be aware of?
    Poppe, L.J., Foster, D.S., and Danforth, W.W., 2006, Character and distribution of exposed glaciodeltaic deposits off outer Cape Cod, Massachusetts, and their effects on hydrogeology and benthic habitats: Geo-Marine Letters v. 26, Springer, Germany.


How reliable are the data; what problems remain in the data set?

  1. How well have the observations been checked?
  2. How accurate are the geographic locations?
    Navigation was by differential GPS.
  3. How accurate are the heights or depths?
  4. Where are the gaps in the data? What is missing?
    All collected data were processed and used to produce this dataset.
  5. How consistent are the relationships among the observations, including topology?
    Information unavailable from original metadata.

How can someone get a copy of the data set?

Are there legal restrictions on access or use of the data?
Access_Constraints: None
Use_Constraints:
Public domain data are freely redistributable with proper metadata and source attribution. Please recognize the U.S. Geological Survey (USGS) as the source of this information.
  1. Who distributes the data set? (Distributor 1 of 1)
    Lawrence J. Poppe
    U.S. Geological Survey
    Geologist
    384 Woods Hole Road
    Woods Hole, MA
    USA

    (508) 548-8700 x2314 (voice)
    (508) 457-2310 (FAX)
    lpoppe@usgs.gov
  2. What's the catalog number I need to order this data set? Downloadable Data.
  3. What legal disclaimers am I supposed to read?
    Although all data have been used by the USGS, no warranty, expressed or implied, is made by the USGS as to the accuracy of the data and/or related materials. The act of distribution shall not constitute any such warranty, and no responsibility is assumed by the USGS in the use of these data or related materials. Any use of trade, product, or firm names is for descriptive purposes only and does not imply endorsement by the U.S. government.
  4. How can I download or order the data?
  5. What hardware or software do I need in order to use the data set?
    This image is available as a GeoTIFF image with an accompanying world file. To utilize this data, the user must have an image viewer, image processing or GIS software package capable of importing a GeoTIFF image.

Who wrote the metadata?

Dates:
Last modified: 16-Nov-2021
Metadata author:
Larry Poppe
U.S. Geological Survey
Geologist
384 Woods Hole Road
Woods Hole, MA
USA

(508) 548-8700 x2314 (voice)
(508) 457-2310 (FAX)
whsc_data_contact@usgs.gov
Contact_Instructions:
The metadata contact email address is a generic address in the event the metadata contact is no longer with the USGS or the email is otherwise invalid.
Metadata standard:
FGDC Content Standards for Digital Geospatial Metadata (FGDC-STD-001-1998)

This page is <https://cmgds.marine.usgs.gov/catalog/whcmsc/open_file_report/ofr2005-1048/capenorthpseudo_geo4m_wgs84.tif.faq.html>
Generated by mp version 2.9.50 on Tue Nov 16 10:06:30 2021