25m Bathymetric ArcRaster Grid of Apalachicola Bay and St. George Sound, Florida (APBAYBATH25M)

Metadata also available as - [Outline] - [Parseable text] - [XML]

Frequently anticipated questions:


What does this data set describe?

Title:
25m Bathymetric ArcRaster Grid of Apalachicola Bay and St. George Sound, Florida (APBAYBATH25M)
Abstract:
These data were collected under a cooperative mapping program between the U.S. Geological Survey (USGS), the National Oceanic and Atmospheric Administration Coastal Services Center (NOAA\CSC), and the Apalachicola National Estuarine Research Reserve (NERR). The primary objectives of this program were to collect marine geophysical data to develop a suite of seafloor maps to better define the extent of oyster habitats, the overall seafloor geology of the bay and provide updated information for management of this resource. In addition to their value for management of the bay's oyster resources, the maps also provide a geologic framework for scientific research and the public. High-resolution bathymetry, backscatter intensity, and seismic profile data were collected over 230 square kilometers of the floor of the bay. The study focused on Apalachicola Bay and Western St. George Sound portions of the estuary mostly in depths > 2.0 meters.
Supplemental_Information:
These data are a bathymetric grid of Apalachicola Bay and St. George Sound generated from swath sounding gridded at 5m. Refer to processing steps under data quality section for detailed methods.
  1. How might this data set be cited?
    U.S. Geological Survey, 2007, 25m Bathymetric ArcRaster Grid of Apalachicola Bay and St. George Sound, Florida (APBAYBATH25M): Open-File Report 2006-1381, U.S. Geological Survey, Coastal and Marine Geology Program, Woods Hole Coastal and Marine Science Center, Woods Hole, Massachusetts.

    Online Links:

    This is part of the following larger work.

    Twichell, David C., Andrews, Brian D., Edmiston, H. Lee, and Stevenson, William R., 2007, Geophysical Mapping of oyster habitats in a shallow estuary; Apalachicola Bay, Florida: Open-File Report 2006-1381, U.S. Geological Survey, Reston, VA.

    Online Links:

  2. What geographic area does the data set cover?
    West_Bounding_Coordinate: -85.096558
    East_Bounding_Coordinate: -84.753126
    North_Bounding_Coordinate: 29.789051
    South_Bounding_Coordinate: 29.597035
  3. What does it look like?
    http://pubs.usgs.gov/of/2006/1381/GIS/thumbnails/apbaybath25m.jpg (JPEG)
    color coded image
  4. Does the data set describe conditions during a particular time period?
    Beginning_Date: 14-Mar-2005
    Ending_Date: 27-Jun-2006
    Currentness_Reference:
    ground condition of two separate survey times: 20050314 to 20050413 and 20060529 to 20060627
  5. What is the general form of this data set?
    Geospatial_Data_Presentation_Form: raster digital data
  6. How does the data set represent geographic features?
    1. How are geographic features stored in the data set?
      This is a Raster data set. It contains the following raster data types:
      • Dimensions 828 x 1315 x 1, type Grid Cell
    2. What coordinate system is used to represent geographic features?
      Grid_Coordinate_System_Name: Universal Transverse Mercator
      Universal_Transverse_Mercator:
      UTM_Zone_Number: 16
      Transverse_Mercator:
      Scale_Factor_at_Central_Meridian: 0.999600
      Longitude_of_Central_Meridian: -87.000000
      Latitude_of_Projection_Origin: 0.000000
      False_Easting: 500000.000000
      False_Northing: 0.000000
      Planar coordinates are encoded using row and column
      Abscissae (x-coordinates) are specified to the nearest 25.000000
      Ordinates (y-coordinates) are specified to the nearest 25.000000
      Planar coordinates are specified in meters
      The horizontal datum used is D_WGS_1984.
      The ellipsoid used is WGS_1984.
      The semi-major axis of the ellipsoid used is 6378137.000000.
      The flattening of the ellipsoid used is 1/298.257224.
      Vertical_Coordinate_System_Definition:
      Depth_System_Definition:
      Depth_Datum_Name: Mean lower low water
      Depth_Resolution: 9999
      Depth_Distance_Units: meters
      Depth_Encoding_Method: Attribute values
  7. How does the data set describe geographic features?
    Band_1
    Information unavailable from original metadata. (Source: Information unavailable from original metadata.)
    ObjectID
    Internal feature number. (Source: ESRI) Sequential unique whole numbers that are automatically generated.

Who produced the data set?

  1. Who are the originators of the data set? (may include formal authors, digital compilers, and editors)
    • U.S. Geological Survey
  2. Who also contributed to the data set?
  3. To whom should users address questions about the data?
    Brian Andrews
    U.S. Geological Survey
    Geographer
    384 Woods Hole Rd
    Woods Hole, MA
    USA

    508-548-8700 x2348 (voice)
    508-457-2310 (FAX)
    bandrews@usgs.gov

Why was the data set created?

The purpose of this dataset is to produce a bathymetric grid of the area within the survey boundary in St. George Sound and Apalachicola Bay. The purpose of these data is to represent the swath bathymetry in a courser grid cell resolution but cover the gaps between survey lines. In shallow areas less than 2m deep the digitized seafloor from the ASV seismic data was used to provide single beam bathymetry.

How was the data set created?

  1. From what previous works were the data drawn?
  2. How were the data generated, processed, and modified?
    Date: Oct-2006 (process 1 of 17)
    Bathymetric data were corrected for variations in the speed of sound throughout the water column; sound velocity profiles were acquired throughout the survey area using an Applied MicroSystems SVPlus Sound Velocimeter. These data were downloaded and reformatted to the required format needed for use within University of New Brunswick's Ocean Mapping Group (OMG) SwathEd multibeam processing software. The raw Submetrix 2000 Series data were "unraveled" and reformatted into the OMG format. This process creates several files on disk: 1) bathymetric soundings 2) raw sidescan backscatter 3) navigation 4) parameter files describing the configuration of the system (i.e. offsets between motion reference unit and GPS antenna, etc). This process also incorporates the sound velocity profiles in order to properly trace the rays given the structure of the water column. Person who carried out this activity:
    Brian Andrews
    U.S. Geological Survey
    Geographer
    384 Woods Hole Rd.
    Woods Hole, MA
    USA

    508-548-8700 x2348 (voice)
    508-457-2310 (FAX)
    bandrews@usgs.gov
    Date: Oct-2006 (process 2 of 17)
    The OMG formatted bathymetric data were then graphically edited using the SwathEd multibeam processing software. This step enabled editing on a "ping-by-ping" basis, both in the across- and along-track dimension. Spurious or erroneous data were removed. The navigation data were also graphically examined for each line of data. Person who carried out this activity:
    Brian Andrews
    U.S. Geological Survey
    Geographer
    384 Woods Hole Rd
    Woods Hole, MA
    USA

    508-548-8700 x2348 (voice)
    508-457-2310 (FAX)
    bandrews@usgs.gov
    Date: Oct-2006 (process 3 of 17)
    Soundings were corrected to mean lower low water (MLLW) using high-resolution Real-Time Kinematic Global Positioning System (RTKGPS) measurements. The one second RTK data were smoothed in MatLab using a 3rd order polynomial and then merged with each line file in SwathEd. Person who carried out this activity:
    Brian Andrews
    U.S. Geological Survey
    Geographer
    384 Woods Hole Rd
    Woods Hole, MA
    USA

    508-548-8700 x2348 (voice)
    508-457-2310 (FAX)
    bandrews@usgs.gov
    Date: Oct-2006 (process 4 of 17)
    Soundings data were gridded using the weigh_grid routines from SwathEd. Soundings were corrected to mean lower low water during the weigh_grid operation using the real time kinematic differential global positioning navigation files. The final weigh_grid parameters used were: weigh_grid -omg -coeffs -butter -lambda 5 -cutoff 20 Max_incidence angle was not used on most lines to allow usage of bathymetry data points from a broader section of the swath. Only lines from rough days, when the vessel heave was large, were gridded with a small incidence angle to maximize the good data from adjacent lanes and reduce the noisy data. Person who carried out this activity:
    Brian Andrews
    U.S. Geological Survey
    Geographer
    384 Woods Hole Rd
    Woods Hole, MA
    USA

    508-548-8700 x2348 (voice)
    508-457-2310 (FAX)
    bandrews@usgs.gov
    Date: Oct-2006 (process 5 of 17)
    Final soundings were gridded to a 5m grid cell resolution using SwathEd weigh_grid command and the following gridding parameters: weigh_grid -omg -coeffs -butter -power 2 -lambda 1 -cutoff 4 -max_incidence 60 A 5m grid cell size reduced the number of points and a max_incidence of 60 degrees was used to remove the outer soundings which tended to be noisy. Person who carried out this activity:
    Brian Andrews
    U.S. Geological Survey
    Geographer
    384 Woods Hole Rd
    Woods Hole, MA
    USA

    508-548-8700 x2348 (voice)
    508-457-2310 (FAX)
    bandrews@usgs.gov
    Date: Oct-2006 (process 6 of 17)
    The final grid in SwathEd OMG format was imported directly into IVS DMagic software producing a .geo, .dtm, and .shade file. The dtm file was exported to an x,y,z comma delimited file. Person who carried out this activity:
    Brian Andrews
    U.S. Geological Survey
    Geographer
    384 Woods Hole Rd
    Woods Hole, MA
    USA

    508-548-8700 x2348 (voice)
    508-457-2310 (FAX)
    bandrews@usgs.gov
    Date: Oct-2006 (process 7 of 17)
    The comma-delimited x,y,z file of bathymetry was added to ArcMap as an event theme and converted to a point feature class. Two separate x,y,z files and feature classes were processed; one for Apalachicola Bay, and one for St. George Sound. Person who carried out this activity:
    Brian Andrews
    U.S. Geological Survey
    Geographer
    384 Woods Hole Road
    Woods Hole, MA

    508-548-8700 x 2348 (voice)
    508-457-2310 (FAX)
    bandrews@usgs.gov
    Date: Oct-2006 (process 8 of 17)
    The remaining geoprocessing steps were completed using one model developed in ArcGIS Modelbuilder. The Model is included in the geodatabase distributed with the Open-File Report. Each of the processing steps used to Create the Model for St. George Sound are described below. The same processing steps were used to create a second Model for Apalachicola Bay using the same steps. Created empty TIN and added the x,y,z points using the geoprocessing history below: Create TIN *Date: 20061027 *Time: 113410 *Tool location: C:\Program Files\ArcGIS\ArcToolbox\Toolboxes\3D Analyst Tools.tbx\CreateTin *Command issued: CreateTin D:\GIS\FL\rafa06001\ArcGIS\Bathy\BathInterp\Tin\StGTin "PROJCS['WGS_1984_UTM_Zone_16N',GEOGCS['GCS_WGS_1984',DATUM['D_WGS_1984',SPHEROID['WGS_1984',6378137.0,298.257223563]],PRIMEM['Greenwich',0.0],UNIT['Degree',0.0174532925199433]],PROJECTION['Transverse_Mercator'],PARAMETER['False_Easting',500000.0],PARAMETER['False_Northing',0.0],PARAMETER['Central_Meridian',-87.0],PARAMETER['Scale_Factor',0.9996],PARAMETER['Latitude_Of_Origin',0.0],UNIT['Meter',1.0]];-10000 -10000 100000;0 100000;0 100000" Person who carried out this activity:
    Brian Andrews
    U.S. Geological Survey
    Geographer
    384 Woods Hole Road
    Woods Hole, MA

    508-548-8700 x 2348 (voice)
    508-457-2310 (FAX)
    bandrews@usgs.gov
    Date: Oct-2006 (process 9 of 17)
    Added 5m xyz points to TIN See geoprocessing history below: Process: *Process name: Edit TIN *Date: 20061027 *Time: 113535 *Tool location: C:\Program Files\ArcGIS\ArcToolbox\Toolboxes\3D Analyst Tools.tbx\EditTin *Command issued: EditTin D:\GIS\FL\rafa06001\ArcGIS\Bathy\BathInterp\Tin\stgtin "StG_5mc_xyz depth masspoints false;BathClip <None> <None> hardclip false" D:\GIS\FL\rafa06001\ArcGIS\Bathy\BathInterp\Tin\stgtin Person who carried out this activity:
    Brian Andrews
    U.S. Geological Survey
    Geographer
    384 Woods Hole Road
    Woods Hole, MA

    508-548-8700 x 2348 (voice)
    508-457-2310 (FAX)
    bandrews@usgs.gov
    Date: Jan-2007 (process 10 of 17)
    Converted Tin to Raster using Natural Neighbors using floating point and natural neighbors options. Cells size was set at 25m. Person who carried out this activity:
    Brian Andrews
    U.S. Geological Survey
    Geographer
    384 Woods Hole Road
    Woods Hole, MA

    508-548-8700 x 2348 (voice)
    508-457-2310 (FAX)
    bandrews@usgs.gov
    Date: Jan-2007 (process 11 of 17)
    Output Raster was clipped to a polygon boundary delineating the extent of bathymetric data. Person who carried out this activity:
    Brian Andrews
    U.S. Geological Survey
    Geographer
    384 Woods Hole Road
    Woods Hole, MA

    508-548-8700 x 2348 (voice)
    508-457-2310 (FAX)
    bandrews@usgs.gov
    Date: Jan-2007 (process 12 of 17)
    The clipped 25m bathymetric grid was smoothed with a 3x3 low-pass filter. Person who carried out this activity:
    Brian Andrews
    U.S. Geological Survey
    Geographer
    384 Woods Hole Road
    Woods Hole, MA

    508-548-8700 x 2348 (voice)
    508-457-2310 (FAX)
    bandrews@usgs.gov
    Date: unknown (process 13 of 17)
    Individual 25m smoothed grids of Apalachicola Bay and St. George Sound were merged together to make one grid for both areas. Person who carried out this activity:
    Brian Andrews
    U.S. Geological Survey
    Geographer
    384 Woods Hole Road
    Woods Hole, MA

    508-548-8700 x 2348 (voice)
    508-457-2310 (FAX)
    bandrews@usgs.gov
    Date: 28-Jun-2016 (process 14 of 17)
    Edits to the metadata were made to fix any errors that MP v 2.9.32 flagged. This is necessary to enable the metadata to be successfully harvested for various data catalogs. In some cases, this meant adding text "Information unavailable" or "Information unavailable from original metadata" for those required fields that were left blank. Other minor edits were probably performed (title, publisher, publication place, etc.). In the case of the depth resolution, the value of 9999 was entered to indicate that the original metadata did not contain the required information. The distribution format name was modified in an attempt to be more consistent with other metadata files of the same data format. The metadata date (but not the metadata creator) was edited to reflect the date of these changes. The metadata available from a harvester may supersede metadata bundled within a download file. Compare the metadata dates to determine which metadata file is most recent. Person who carried out this activity:
    U.S. Geological Survey
    Attn: VeeAnn A. Cross
    Marine Geologist
    384 Woods Hole Rd.
    Woods Hole, MA

    508-548-8700 x2251 (voice)
    508-457-2310 (FAX)
    vatnipp@usgs.gov
    Date: 14-Feb-2017 (process 15 of 17)
    Keywords section of metadata optimized for discovery in USGS Coastal and Marine Geology Data Catalog. Person who carried out this activity:
    U.S. Geological Survey
    Attn: Alan O. Allwardt
    Contractor -- Information Specialist
    2885 Mission Street
    Santa Cruz, CA

    831-460-7551 (voice)
    831-427-4748 (FAX)
    aallwardt@usgs.gov
    Date: 18-Nov-2019 (process 16 of 17)
    Crossref DOI link was added as the first link in the metadata. Person who carried out this activity:
    U.S. Geological Survey
    Attn: VeeAnn A. Cross
    Marine Geologist
    384 Woods Hole Road
    Woods Hole, MA

    508-548-8700 x2251 (voice)
    508-457-2310 (FAX)
    vatnipp@usgs.gov
    Date: 08-Sep-2020 (process 17 of 17)
    Added keywords section with USGS persistent identifier as theme keyword. Person who carried out this activity:
    U.S. Geological Survey
    Attn: VeeAnn A. Cross
    Marine Geologist
    384 Woods Hole Road
    Woods Hole, MA

    508-548-8700 x2251 (voice)
    508-457-2310 (FAX)
    vatnipp@usgs.gov
  3. What similar or related data should the user be aware of?

How reliable are the data; what problems remain in the data set?

  1. How well have the observations been checked?
  2. How accurate are the geographic locations?
    DGPS is assumed to be accurate within 1-2 meters. Standard GPS is assumed accurate within 5-10 meters. 99% of the positional data is DGPS. Unless noted, all GPS/DGPS data is referenced to WGS84 (NAD83). The configuration of the fathometer is as follows: the transducer on the RAFAEL was mounted on a pole at the vessel's bow. Offset between the bow mount and GPS antenna is measured. On ASV IRIS, the subbottom profiler used to measure water depth was mounted directly below the GPS antenna. No measurements were taken of ship's pitch, yaw, heave, or change in draft due to water and fuel usage. Motion of the fathometer is not measured. Horizontal accuracy of the fathometer is assumed to be within +/- 3 meters.
  3. How accurate are the heights or depths?
    Ship motion was recorded with a TSS DMS 2-05 Attitude Sensor, mounted on a head above the interferometric Submetrix 2000 Series transducers. Navigation was recorded using Real Time Kinematic Differential Global Positioning System (RTK-DGPS). The interferometric sonar is an angle-measuring system; depth accuracy decreases with increasing horizontal range. The combined angular accuracy of the Submetrix 2000 Series and the TSS DMS 2-05 attitude sensor is documented as 0.1 degrees. Assuming a constant angular accuracy, and using the International Hydrographic Standard (IHO) of a required 0.3 meter accuracy in < 30 meter water depth, all data collected within the survey fall within the IHO accuracy standards. However, vertical accuracy is also directly affected by the accuracy of both the navigation system and tidal measurements. RTK DGPS vertical accuracy is assumed to be 0.2 meters. Tidal elevations were derived from RTK -DGPS heights sent from a survey-specific base station located on St. George Island. The base station occupied a temporary monument. The x & y positions were calculated for that location using a 3 day average of 12 hour data sets using the Online Positioning User Service (OPUS, National Geodetic Survey) solution. Tidal elevations were calculated from NOAA Tidal Station #8728690 using the same OPUS solution and then applied to the corrected elevations for the base station at St. George Island. Antenna heights were referenced to Mean Lower Low Water (MLLW) for easier comparison of NOAA nautical charts.
  4. Where are the gaps in the data? What is missing?
    Soundings were gridded in OMG SwathEd software using the entire swath width across track to achieve maximum coverage at the scale of the entire Apalachicola Bay/St. George Sound survey area. Although the soundings were manually edited, small data spikes may exist at outer edges of some swaths. Pockmark features that appear in the dredge channel of the intracoastal waterway fairways are artifacts of the processing methods used to generate a continuous surface from swath bathymetry collected on lines spaced 100m apart.
  5. How consistent are the relationships among the observations, including topology?
    These data have not been quantitatively compared to previous hydrographic data, although they generally agree with qualitative comparison of published NOAA charts.

How can someone get a copy of the data set?

Are there legal restrictions on access or use of the data?
Access_Constraints None
Use_Constraints Data are not intended for navigational use. These data should not be used at resolutions for which it is not intended. Public domain data from the U.S. Government are freely redistributable with proper metadata and source attribution. Please recognize the U.S. Geological Survey (USGS) as the source of this information.
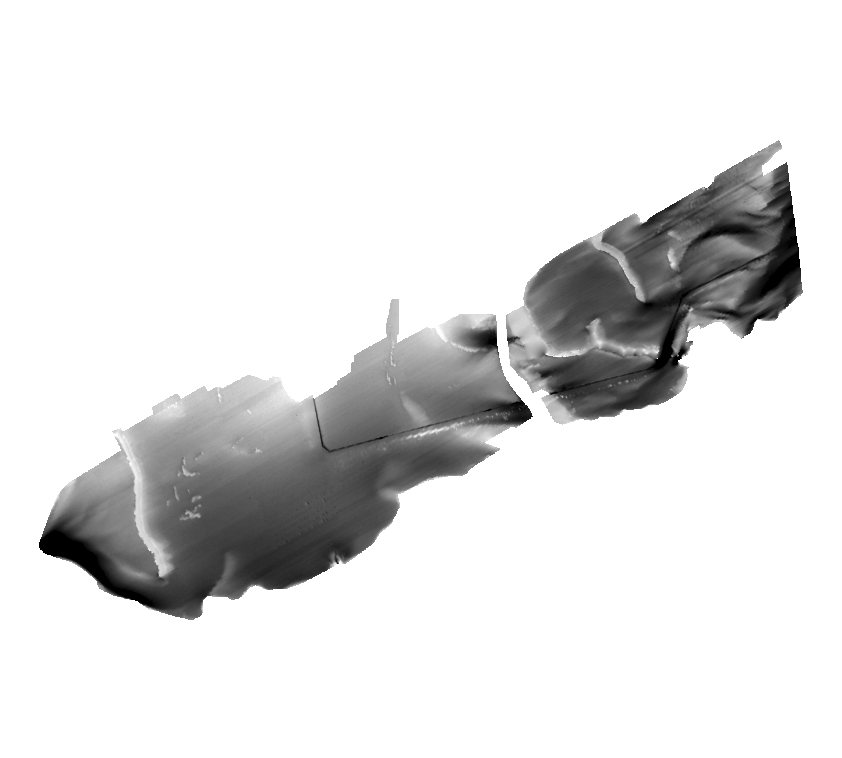
  1. Who distributes the data set? (Distributor 1 of 1)
    Brian Andrews
    U.S. Geological Survey
    Geographer
    384 Woods Hole Rd.
    Woods Hole, MA
    USA

    508-548-8700 x2348 (voice)
    508-457-2310 (FAX)
    bandrews@usgs.gov
  2. What's the catalog number I need to order this data set? Downloadable Data
  3. What legal disclaimers am I supposed to read?
    Although this data set has been used by the U.S. Geological Survey (USGS), no warranty, expressed or implied, is made by the USGS as to the accuracy of the data and/or related materials. The act of distribution shall not constitute any such warranty, and no responsibility is assumed by the USGS in the use of these data or related materials. Any use of trade, product, or firm names is for descriptive purposes only and does not imply endorsement by the U.S. Government.
  4. How can I download or order the data?
    • Availability in digital form:
      Data format: ArcRaster grid containing swath bathymetric data collected in the Apalachicola Bay and St. George Sound Florida in format AIG (version ArcGIS 9.2) ESRI Grid File Size: 4.994
      Network links: http://pubs.usgs.gov/of/2006/1381/GIS/raster/bath/apbaybath25m.zip
      Media you can order: DVD-ROM (Density 4.75 Gbytes) (format UDF)
    • Cost to order the data: None

  5. What hardware or software do I need in order to use the data set?
    These data are available as a 32 bit floating point ArcRaster grid in Environmental Systems Research Institute (ESRI) format. To utilize these data, the user must have an image viewer, image processing or ESRI software capable of importing and ESRI raster.

Who wrote the metadata?

Dates:
Last modified: 18-Mar-2024
Metadata author:
U.S. Geological Survey
Attn: Brian Andrews
Geographer
384 Woods Hole Rd.
Woods Hole, MA
USA

508-548-8700 x2348 (voice)
508-457-2310 (FAX)
whsc_data_contact@usgs.gov
Contact_Instructions:
The metadata contact email address is a generic address in the event the person is no longer with USGS. (updated on 20240318)
Metadata standard:
FGDC Content Standards for Digital Geospatial Metadata (FGDC-STD-001-1998)

This page is <https://cmgds.marine.usgs.gov/catalog/whcmsc/open_file_report/ofr2006-1381/apbaybath25m-meta.faq.html>
Generated by mp version 2.9.51 on Mon Mar 25 16:05:25 2024