Survey lines along which interferometric sonar data were collected by the USGS within Red Brook Harbor, MA, 2009 (RB_BathyBackscatterTrackline.shp)

Metadata also available as - [Outline] - [Parseable text] - [XML]

Frequently anticipated questions:


What does this data set describe?

Title:
Survey lines along which interferometric sonar data were collected by the USGS within Red Brook Harbor, MA, 2009 (RB_BathyBackscatterTrackline.shp)
Abstract:
These data were collected under a cooperative agreement with the Massachusetts Office of Coastal Zone Management (CZM) and the U.S. Geological Survey (USGS), Coastal and Marine Geology Program, Woods Hole Coastal and Marine Science Center (WHCMSC). Initiated in 2003, the primary objective of this program is to develop regional geologic framework information for the management of coastal and marine resources. Accurate data and maps of sea-floor geology are important first steps toward protecting fish habitat, delineating marine resources, and assessing environmental changes due to natural or human impacts. The project is focused on the inshore waters (5-30 m deep) of Massachusetts between the New Hampshire border and Cape Cod Bay. Data collected for the mapping cooperative have been released in a series of USGS Open-File Reports (http://woodshole.er.usgs.gov/project-pages/coastal_mass/). This is the spatial dataset for the Red Brook Harbor survey area within Buzzards Bay, Massachusetts. These data are the results of a high-resolution geophysical (bathymetry, backscatter intensity, and seismic reflection) and ground validation (sediment samples and bottom photographs) survey, conducted in 2009. In addition to inclusion within the USGS-CZM geologic mapping effort, these Red Brook Harbor data will be used to assess the shallow-water mapping capability of the geophysical systems deployed for this project, with an emphasis on identifying resolution benchmarks for the interferometric sonar system. (http://woodshole.er.usgs.gov/operations/ia/public_ds_info.php?fa=2009-018-FA)
  1. How might this data set be cited?
    U.S. Geological Survey, 2012, Survey lines along which interferometric sonar data were collected by the USGS within Red Brook Harbor, MA, 2009 (RB_BathyBackscatterTrackline.shp): Open-File Report 2010-1091, U.S. Geological Survey, Coastal and Marine Geology Program, Woods Hole Coastal and Marine Science Center, Woods Hole, Massachusetts.

    Online Links:

    This is part of the following larger work.

    Turecek, Aaron M., Danforth, William W., Baldwin, Wayne E., and Barnhardt, Walter A., 2012, High-Resolution Geophysical Data Collected Within Red Brook Harbor, Buzzards Bay, Massachusetts, in 2009: Open-File Report 2010-1091, U.S. Geological Survey, Reston, VA.

    Online Links:

  2. What geographic area does the data set cover?
    West_Bounding_Coordinate: -70.678892
    East_Bounding_Coordinate: -70.616102
    North_Bounding_Coordinate: 41.692125
    South_Bounding_Coordinate: 41.661905
  3. What does it look like?
    http://pubs.usgs.gov/of/2010/1091/GIS/browse_jpg/big/RB_BathyBackscatterTrackline.jpg (JPEG)
    Trackline navigation for interferometric sonar data collected within Red Brook Harbor, MA, 2009
  4. Does the data set describe conditions during a particular time period?
    Beginning_Date: 28-Sep-2009
    Ending_Date: 23-Oct-2009
    Currentness_Reference:
    Ground condition. There were 10 survey days during survey time span.
  5. What is the general form of this data set?
    Geospatial_Data_Presentation_Form: vector digital data
  6. How does the data set represent geographic features?
    1. How are geographic features stored in the data set?
      This is a Vector data set. It contains the following vector data types (SDTS terminology):
      • String (203)
    2. What coordinate system is used to represent geographic features?
      Horizontal positions are specified in geographic coordinates, that is, latitude and longitude. Latitudes are given to the nearest 0.000001. Longitudes are given to the nearest 0.000001. Latitude and longitude values are specified in Decimal degrees. The horizontal datum used is D_WGS_1984.
      The ellipsoid used is WGS_1984.
      The semi-major axis of the ellipsoid used is 6378137.000000.
      The flattening of the ellipsoid used is 1/298.257224.
  7. How does the data set describe geographic features?
    RB_BathyBackscatterTrackline
    Trackline interferometric sonar system (Source: USGS)
    FID
    Internal feature number (Source: ESRI) Sequential unique whole numbers that are automatically generated
    Shape
    Feature geometry. (Source: ESRI) Coordinates defining the features
    FILENAME
    Name of interferometric sonar data file (Source: USGS) Character string
    YEAR
    Calendar year data were collected (Source: USGS) Character string
    JULDAY
    Julian day data were collected where Julian day is the integer number representing the interval of time in days since January 1 of the year. (Source: USGS) Character string
    SURVEYID
    WHCMSC field activity number (Source: USGS) Character string
    DEVICEID
    Sonar device used to collect bathymetric and backscatter data (Source: USGS) Character string
    VEHICLEID
    Survey vessel name (Source: USGS) Character string
    LENGTH
    Length of interferometric sonar transect in kilometers (UTM Zone 19N, WGS84) (Source: USGS)
    Range of values
    Minimum:0.083
    Maximum:3.502
    Units:kilometer

Who produced the data set?

  1. Who are the originators of the data set? (may include formal authors, digital compilers, and editors)
    • U.S. Geological Survey
  2. Who also contributed to the data set?
  3. To whom should users address questions about the data?
    Aaron Turecek
    U.S. Geological Survey
    Geographer
    384 Woods Hole Rd.
    Woods Hole, MA
    USA

    508-548-8700 x2230 (voice)
    508-457-2310 (FAX)
    aturecek@usgs.gov

Why was the data set created?

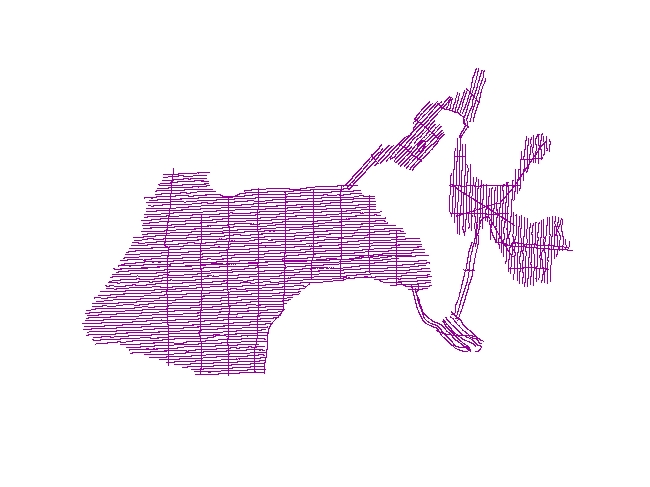
This dataset contains trackline navigation for approximately 240 km of interferometric (Systems Engineering and Assessment Ltd. (SEA) SWATHplus) sonar data that were collected by the U.S. Geological Survey in Red Brook Harbor, Massachusetts, during USGS survey 09018.

How was the data set created?

  1. From what previous works were the data drawn?
    Information unavailable from original metadata. (source 1 of 1)
    The source information was incomplete and had to be modified to meet the standard. Assumed to be USGS., unknown, Information unavailable from original metadata..

    Type_of_Source_Media: Information unavailable from original metadata.
    Source_Contribution:
    Bathymetric and backscatter data were collected using a Systems Engineering and Assessment, Ltd. SWATHplus (234 kHz) interferometric sonar system. The SWATHplus transducers were mounted on a rigid pole, approximately 0.5 m below the water line, from the bow of the of the R/V Rafael of Woods Hole, MA. A CodaOctopus F-180 Attitude and Positioning System, mounted directly above the SWATHplus transducers, measured vertical displacement (heave) and attitude (pitch and roll) of the vessel during data acquisition. An Applied Microsystems Ltd. Micro SV sound velocimeter, mounted adjacent to the SWATHplus transducers, continually measured changes in sound-velocity near the sea surface, and a hand-casted, Applied MicroSystems SV Plus sound velocimeter was used to collect sound-velocity profiles of the entire water column at least once each survey day. SWATHplus acquisition software was used to control the transducers and digitally log sonar data across an 80 m swath in the SWATHplus SXR format. An RTK-corrected GPS signal was transmitted to a beacon aboard the survey vessel once every second from a base station established by USGS personnel in the inner harbor. RTK vertical heights were used to correct tidal offsets during post-processing. To obtain 100 percent coverage of the seafloor, survey lines were spaced approximately 30 m apart. The R/V Rafael maintained an average speed of 5 knots during survey operations. The trackline for survey line l147f1 shows a loop during which interferometric data was still collected. Interferometric sounding and backscatter data for this loop was excluded from bathymetry and backscatter datasets.
  2. How were the data generated, processed, and modified?
    Date: 2009 (process 1 of 10)
    Raw to Processed Conversion: Survey navigation information is stored within each raw (SXR) data file. Each raw SWATHplus bathymetric sonar file (SXR) was converted to a SWATHplus processed file (SXP) using SEA SWATHplus Swath Processor (ver. 3.06.05.00). Person who carried out this activity:
    Aaron Turecek
    U.S. Geological Survey
    Geographer
    384 Woods Hole Rd.
    Woods Hole, MA
    USA

    508-548-8700 x2230 (voice)
    508-457-2310 (FAX)
    aturecek@usgs.gov
    Date: 2009 (process 2 of 10)
    CARIS Processing: A new Computer Aided Resource Information System (CARIS) Hydrographic Information Processing System (HIPS) project (ver. 6.1) was created with projection information set to Universal Transverse Mercator (UTM) Zone 19, WGS84. Each SWATHplus processed file (SXP) was imported to the new CARIS project using the Import/Conversion Wizard. Navigation was checked and edited as needed using the Navigation Editor tool. Person who carried out this activity:
    Aaron Turecek
    U.S. Geological Survey
    Geographer
    384 Woods Hole Rd.
    Woods Hole, MA
    USA

    508-548-8700 x2230 (voice)
    508-457-2310 (FAX)
    aturecek@usgs.gov
    Date: 2009 (process 3 of 10)
    A series of Perl and AWK programming scripts were used to extract and subsample the navigation fixes stored in the CARIS HIPS database. The processing flow for this step follows: A.) Extract navigation for each line in CARIS HDCS directory using Perl script do_CARIS_nav2.pl (which runs the CARIS program printfnav for all the lines in the HDCS dir) and the grep statement below. (Extracted navigation file is tab-delimited in format YYYY-JD HH:MM:SS:FFF DD.LAT DD.LONG SSSSS_VVVVV_YYYY-JD_LLLL AR where YYYY=year, JD=Julian Day, HH=hour, MM=minute, SS=seconds, FFF=fractions of a second, DD.LAT=latitude in decimal degrees, DD.LONG=longitude in decimal degrees, SSSSS=survey name, VVVVV=vessel name, LLLL=linename, AR=accepted or rejected navigation fix) > grep Accepted combined.txt > outputfile B.) The files extracted from CARIS HIPS have 4-5 navigation fixes per second. Each file was subsampled to 1 fix per second by using AWK (see code below) to remove the fractions-of-a-second from the time column then grabbing the first occurrence of each second. > awk '{print $1" "substr($2,1,8)" "$3" "$4" "$5}' 2.ss_combined_grep.txt | awk '$2 != prev { print; prev = $2 }' > 3.ss_nav_awked.txt. C.) Checked that there were no additional spurious fixes outside the survey area using another series of AWK code (see code below), and reformatted for conversion from comma separated value (CSV) data to ESRI point feature class > awk -F" " '{if(substr($4,1,3)!="-70") print $0}' 3.ss_nav_awked.txt > awk -F" " '{if(substr($3,1,1)!="4") print $0}' 3.ss_nav_awked.txt > awk -f reformat_CARIS2Arc_SS.awk 3.ss_nav_awked.txt > SS_bathyNAV_ofr.csv Person who carried out this activity:
    Aaron Turecek
    U.S. Geological Survey
    Geographer
    384 Woods Hole Rd.
    Woods Hole, MA
    USA

    508-548-8700 x2230 (voice)
    508-457-2310 (FAX)
    aturecek@usgs.gov
    Date: 2009 (process 4 of 10)
    In ArcMap (version 9.3), navigation text file was added as an event theme (Tools/AddXY) with a defined coordinate system of UTM, Zone 19, WGS84, and then converted to a point shapefile. Person who carried out this activity:
    Aaron Turecek
    U.S. Geological Survey
    Geographer
    384 Woods Hole Rd.
    Woods Hole, MA
    USA

    508-548-8700 x2230 (voice)
    508-457-2310 (FAX)
    aturecek@usgs.gov
    Date: 2009 (process 5 of 10)
    Within ArcMap (version 9.3) XToolsPro (version 5.3.0) was used to convert the navigation point file to a trackline polyline shapefile. The trackline shapefile was checked for spurious fixes. The following fields were added to the polyline shapefile using XToolsPro: FILENAME, YEAR, JULDAY, SURVEYID, DEVICEID, VEHICLEID, LENGTH. Fields were populated as: FILENAME = linename, YEAR = year of survey, JULDAY = Julian day surveyed (via tabular join with nav point shapefile), SURVEYID = USGS survey number, DEVICEID = device used for collection, VEHICLEID = survey vessel, LENGTH = length of each survey line calculated in kilometers (Calculate geometry at attribute table). Person who carried out this activity:
    Aaron Turecek
    U.S. Geological Survey
    Geographer
    384 Woods Hole Rd.
    Woods Hole, MA
    USA

    508-548-8700 x2230 (voice)
    508-457-2310 (FAX)
    aturecek@usgs.gov
    Date: 2010 (process 6 of 10)
    Tracklines were converted from UTM projection to Geographic (WGS 1984) within Arcmap (version 9.3) using ArcToolBox/Data Management Tools/Projections and Transformations/Feature/Project. Person who carried out this activity:
    Aaron Turecek
    U.S. Geological Survey
    Geographer
    384 Woods Hole Rd.
    Woods Hole, MA
    USA

    (508) 548-8700 x2230 (voice)
    (508) 457-2310 (FAX)
    aturecek@usgs.gov
    Date: 14-Apr-2016 (process 7 of 10)
    Edits to the metadata were made to fix any errors that MP v 2.9.32 flagged. This is necessary to enable the metadata to be successfully harvested for various data catalogs. In some cases, this meant adding text "Information unavailable" or "Information unavailable from original metadata" for those required fields that were left blank. Other minor edits were probably performed (title, publisher, publication place, etc.). Fixed URL in abstract. The source information was incomplete and had to be modified to meet the standard. The metadata date (but not the metadata creator) was edited to reflect the date of these changes. The metadata available from a harvester may supersede metadata bundled within a download file. Compare the metadata dates to determine which metadata file is most recent. Person who carried out this activity:
    U.S. Geological Survey
    Attn: VeeAnn A. Cross
    Marine Geologist
    384 Woods Hole Rd.
    Woods Hole, MA

    508-548-8700 x2251 (voice)
    508-457-2310 (FAX)
    vatnipp@usgs.gov
    Date: 20-Jul-2018 (process 8 of 10)
    USGS Thesaurus keywords added to the keyword section. Person who carried out this activity:
    U.S. Geological Survey
    Attn: VeeAnn A. Cross
    Marine Geologist
    384 Woods Hole Road
    Woods Hole, MA

    508-548-8700 x2251 (voice)
    508-457-2310 (FAX)
    vatnipp@usgs.gov
    Date: 18-Nov-2019 (process 9 of 10)
    Crossref DOI link was added as the first link in the metadata. Person who carried out this activity:
    U.S. Geological Survey
    Attn: VeeAnn A. Cross
    Marine Geologist
    384 Woods Hole Road
    Woods Hole, MA

    508-548-8700 x2251 (voice)
    508-457-2310 (FAX)
    vatnipp@usgs.gov
    Date: 08-Sep-2020 (process 10 of 10)
    Added keywords section with USGS persistent identifier as theme keyword. Person who carried out this activity:
    U.S. Geological Survey
    Attn: VeeAnn A. Cross
    Marine Geologist
    384 Woods Hole Road
    Woods Hole, MA

    508-548-8700 x2251 (voice)
    508-457-2310 (FAX)
    vatnipp@usgs.gov
  3. What similar or related data should the user be aware of?
    Barnhardt, Walter A., Andrews, Brian D., and Butman, Bradford, 2006, High-Resolution Geologic Mapping of the Inner Continental Shelf: Nahant to Gloucester, Massachusetts: Open-File Report 2005-1293, U.S. Geological Survey, Reston, VA.

    Online Links:

    Ackerman, Seth D., Butman, Bradford, Barnhardt, Walter A., Danforth, William W., and Crocker, James M., 2006, High-Resolution Geologic Mapping of the Inner Continental Shelf: Boston Harbor and Approaches, Massachusetts: Open-File Report 2006-1008, U.S. Geological Survey, Reston, VA.

    Online Links:

    Barnhardt, Walter A., Andrews, Brian D., Ackerman, Seth D., Baldwin, Wayne E., and Hein, Christopher J., 2009, High-Resolution Geologic Mapping of the Inner Continental Shelf: Cape Ann to Salisbury Beach, Massachusetts: Open-File Report 2007-1373, U.S. Geological Survey, Reston, VA.

    Online Links:

    Barnhardt, Walter A., Ackerman, Seth D., Andrews, Brian D., and Baldwin, Wayne E., 2010, Geophysical and Sampling Data from the Inner Continental Shelf: Duxbury to Hull, Massachusetts.: Open-File Report 2009-1072, U.S. Geological Survey, Reston, VA.

    Online Links:


How reliable are the data; what problems remain in the data set?

  1. How well have the observations been checked?
    All attributes were checked in a consistent manner.
  2. How accurate are the geographic locations?
    The SWATHplus transducers were mounted on a rigid, vertical pole, at the bow of the R/V Rafael, approximately 0.5 meters below the water line. Navigation antennas (one Differential Global Positioning System (DGPS) antenna and two Real-Time Kinematic (RTK) GPS antennas) were mounted on a horizontal crossbar atop the vertical transducer mount pole. The horizontal positions for soundings were acquired with an Octopus F180 Attitude and Positioning System integrated with a Novatel DGPS. Horizontal sounding positions were recorded to raw sonar data files (SXR) via SWATHplus acquisition software (version 3.06.05.00). Position data from an Ashtech Surveyor RTK GPS, a Novatel DL-V3 RTK GPS, and an CSI LGBX Pro DGP were recorded by HYPACK survey software to HYPACK raw files. A conservative estimate of the positional accuracy of the CSI LGBX Pro DGPS unit is ± 2 meters.
  3. How accurate are the heights or depths?
  4. Where are the gaps in the data? What is missing?
    This shapefile includes trackline navigation from all the interferometric sonar data that was collected within the survey area; however only quality bathymetric soundings along the main survey lines were included in the final bathymetry grid included on this report. Bathymetric and backscatter data along the tielines were not included in the final bathymetry grid and backscatter image.
  5. How consistent are the relationships among the observations, including topology?
    Spurious data points were removed during processing.

How can someone get a copy of the data set?

Are there legal restrictions on access or use of the data?
Access_Constraints: None
Use_Constraints:
Public domain data from the U.S. Government are freely redistributable with proper metadata and source attribution. Please recognize the U.S. Geological Survey as the source of this information.
  1. Who distributes the data set? (Distributor 1 of 1)
    Aaron Turecek
    U.S. Geological Survey
    Geographer
    384 Woods Hole Rd.
    Woods Hole, MA
    USA

    508-548-8700 x2230 (voice)
    508-457-2310 (FAX)
    aturecek@usgs.gov
  2. What's the catalog number I need to order this data set? Downloadable Data
  3. What legal disclaimers am I supposed to read?
    Neither the U.S. Government, the Department of the Interior, nor the USGS, nor any of their employees, contractors, or subcontractors, make any warranty, express or implied, nor assume any legal liability or responsibility for the accuracy, completeness, or usefulness of any information, apparatus, product, or process disclosed, nor represent that its use would not infringe on privately owned rights. The act of distribution shall not constitute any such warranty, and no responsibility is assumed by the USGS in the use of these data or related materials. Any use of trade, product, or firm names is for descriptive purposes only and does not imply endorsement by the U.S. Government.
  4. How can I download or order the data?
    • Availability in digital form:
      Data format: Trackline navigation for interferometric sonar data collected in Red Brook Harbor, Massachusetts, and associated metadata. in format SHP (version ArcGIS 9.3) ESRI polyline shapefile Size: 0.3
      Network links: http://pubs.usgs.gov/of/2010/1091/GIS/shapefile/RB_BathyBackscatterTrackline.zip
      Media you can order: DVD-ROM (Density 4.75 Gbytes) (format UDF)
    • Cost to order the data: none

  5. What hardware or software do I need in order to use the data set?
    This data is an Environmental Systems Research Institute (ESRI) polyline shapefile. The user must have ArcGIS or ArcView 3.0 or greater software to read and process the data file. In lieu of ArcView or ArcGIS, the user may utilize another GIS application package capable of importing the data. A free data viewer, ArcExplorer, capable of displaying the data is available from ESRI at www.esri.com.

Who wrote the metadata?

Dates:
Last modified: 16-Nov-2021
Metadata author:
Aaron Turecek
U.S. Geological Survey
Geographer
384 Woods Hole Rd.
Woods Hole, MA
USA

508-548-8700 x2230 (voice)
508-457-2310 (FAX)
whsc_data_contact@usgs.gov
Contact_Instructions:
The metadata contact email address is a generic address in the event the metadata contact is no longer with the USGS or the email is otherwise invalid.
Metadata standard:
FGDC Content Standards for Digital Geospatial Metadata (FGDC-STD-001-1998)

This page is <https://cmgds.marine.usgs.gov/catalog/whcmsc/open_file_report/ofr2010-1091/RB_BathyBackscatterTrackline.shp.faq.html>
Generated by mp version 2.9.50 on Tue Nov 16 10:06:39 2021