Esri Binary floating point GRID containing bathymetry from interferometric sonar data collected by the USGS within Red Brook Harbor, MA, 2009 (rb_bathy_5m, 5-meter cell size)

Metadata also available as - [Outline] - [Parseable text] - [XML]

Frequently anticipated questions:


What does this data set describe?

Title:
Esri Binary floating point GRID containing bathymetry from interferometric sonar data collected by the USGS within Red Brook Harbor, MA, 2009 (rb_bathy_5m, 5-meter cell size)
Abstract:
These data were collected under a cooperative agreement with the Massachusetts Office of Coastal Zone Management (CZM) and the U.S. Geological Survey (USGS), Woods Hole Coastal and Marine Science Center (WHCMSC). Initiated in 2003, the primary objective of this program is to develop regional geologic framework information for the management of coastal and marine resources. Accurate data and maps of sea-floor geology are important first steps toward protecting fish habitat, delineating marine resources, and assessing environmental changes due to natural or human impacts. The project is focused on the inshore waters (5-30 m deep) of Massachusetts between the New Hampshire border and Cape Cod Bay. Data collected for the mapping cooperative have been released in a series of USGS Open-File Reports (http://woodshole.er.usgs.gov/project-pages/coastal_mass/). This is the spatial dataset for the Red Brook Harbor survey area within Buzzards Bay, Massachusetts. These data are the results of a high-resolution geophysical (bathymetry, backscatter intensity, and seismic reflection) and ground validation (sediment samples and bottom photographs) survey, conducted in 2009. In addition to inclusion within the USGS-CZM geologic mapping effort, these Red Brook Harbor data will be used to assess the shallow-water mapping capability of the geophysical systems deployed for this project, with an emphasis on identifying resolution benchmarks for the interferometric sonar system. (http://woodshole.er.usgs.gov/operations/ia/public_ds_info.php?fa=2009-018-FA)
  1. How might this data set be cited?
    U.S. Geological Survey, 2012, Esri Binary floating point GRID containing bathymetry from interferometric sonar data collected by the USGS within Red Brook Harbor, MA, 2009 (rb_bathy_5m, 5-meter cell size): Open-File Report 2010-1091, U.S. Geological Survey, Coastal and Marine Geology Program, Woods Hole Coastal and Marine Science Center, Woods Hole, Massachusetts.

    Online Links:

    This is part of the following larger work.

    Turecek, Aaron M., Danforth, William W., Baldwin, Wayne E., and Barnhardt, Walter A., 2012, High-Resolution Geophysical Data Collected Within Red Brook Harbor, Buzzards Bay, Massachusetts, in 2009: Open-File Report 2010-1091, U.S. Geological Survey, Reston, VA.

    Online Links:

  2. What geographic area does the data set cover?
    West_Bounding_Coordinate: -70.679630
    East_Bounding_Coordinate: -70.615579
    North_Bounding_Coordinate: 41.692395
    South_Bounding_Coordinate: 41.661596
  3. What does it look like?
    http://pubs.usgs.gov/of/2010/1091/GIS/browse_jpg/big/rb_bathy_5m.jpg (JPEG)
    Bathymetry GRID of interferometric sonar data collected by the USGS within Red Brook Harbor, MA, 2009
  4. Does the data set describe conditions during a particular time period?
    Beginning_Date: 28-Sep-2009
    Ending_Date: 23-Oct-2009
    Currentness_Reference:
    ground condition, data were not collected every day during range
  5. What is the general form of this data set?
    Geospatial_Data_Presentation_Form: remote-sensing image
  6. How does the data set represent geographic features?
    1. How are geographic features stored in the data set?
      This is a Raster data set. It contains the following raster data types:
      • Dimensions 664 x 1054 x 1, type Grid Cell
    2. What coordinate system is used to represent geographic features?
      Grid_Coordinate_System_Name: Universal Transverse Mercator
      Universal_Transverse_Mercator:
      UTM_Zone_Number: 19
      Transverse_Mercator:
      Scale_Factor_at_Central_Meridian: 0.999600
      Longitude_of_Central_Meridian: -69.000000
      Latitude_of_Projection_Origin: 0.000000
      False_Easting: 500000.000000
      False_Northing: 0.000000
      Planar coordinates are encoded using row and column
      Abscissae (x-coordinates) are specified to the nearest 5.000000
      Ordinates (y-coordinates) are specified to the nearest 5.000000
      Planar coordinates are specified in meters
      The horizontal datum used is D_WGS_1984.
      The ellipsoid used is WGS_1984.
      The semi-major axis of the ellipsoid used is 6378137.000000.
      The flattening of the ellipsoid used is 1/298.257224.
      Vertical_Coordinate_System_Definition:
      Depth_System_Definition:
      Depth_Datum_Name: Mean lower low water
      Depth_Resolution: 0.5
      Depth_Distance_Units: meters
      Depth_Encoding_Method: Explicit depth coordinate included with horizontal coordinates
  7. How does the data set describe geographic features?
    Value
    Depth in meters below mean lower low water (Source: ESRI)
    Entity_and_Attribute_Overview:
    Swath bathymetry in ESRI GRID format. Data values represent depth in meters referenced to mean lower low water (MLLW).
    Entity_and_Attribute_Detail_Citation: ESRI

Who produced the data set?

  1. Who are the originators of the data set? (may include formal authors, digital compilers, and editors)
    • U.S. Geological Survey
  2. Who also contributed to the data set?
  3. To whom should users address questions about the data?
    Aaron Turecek
    U.S. Geological Survey
    Geographer
    384 Woods Hole Rd.
    Woods Hole, MA
    USA

    508-548-8700 x2230 (voice)
    508-457-2310 (FAX)
    aturecek@usgs.gov

Why was the data set created?

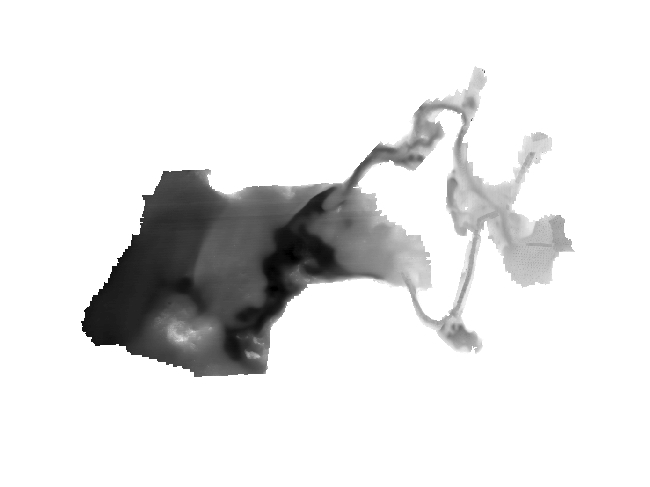
This grid represents approximately 7 square kilometers of bathymetric data that were collected in Red Brook Harbor, Massachusetts, by the U.S. Geological Survey in 2009 as part of USGS survey 09018. Data were collected with a Systems Engineering and Assessment Ltd. (SEA) SWATHplus interferometric sonar system. These data are used to define the sea-floor morphology as part of the Massachusetts Sea-floor Mapping Project. The cell size for this grid is 5-meter by 5-meter.

How was the data set created?

  1. From what previous works were the data drawn?
    Information unavailable from original metadata. (source 1 of 1)
    The source information was incomplete and had to be modified to meet the standard. Assumed to be USGS., unknown, Information unavailable from original metadata..

    Type_of_Source_Media: disc
    Source_Contribution:
    Bathymetric and backscatter data were collected using a Systems Engineering and Assessment, Ltd. SWATHplus (234 kHz) interferometric sonar system. The SWATHplus transducers were mounted on a rigid pole, approximately 0.5 m below the water line, from the bow of the of the R/V Rafael of Woods Hole, MA. A CodaOctopus F-180 Attitude and Positioning System, mounted directly above the SWATHplus transducers, measured vertical displacement (heave) and attitude (pitch and roll) of the vessel during data acquisition. An Applied Microsystems Ltd. Micro SV sound velocimeter, mounted adjacent to the SWATHplus transducers, continually measured changes in sound-velocity near the sea surface, and a hand-casted, Applied MicroSystems SV Plus sound velocimeter was used to collect sound-velocity profiles of the entire water column at least once each survey day. SWATHplus acquisition software was used to control the transducers and digitally log sonar data across an 80 m swath in SWATHplus raw (SXR) format. An RTK-corrected GPS signal was transmitted to a beacon aboard the survey vessel once every second from a base station established by USGS personnel in the inner harbor. RTK vertical heights were used to correct tidal offsets during post-processing. To obtain 100 percent coverage of the seafloor, survey lines were spaced approximately 30 m apart. The R/V Rafael maintained an average speed of 5 knots during survey operations.
  2. How were the data generated, processed, and modified?
    Date: 2009 (process 1 of 8)
    Each raw SWATHplus bathymetric sonar file (SXR) was converted to a SWATHplus processed file (SXP) using SEA SWATHplus Swath Processor (ver. 3.06.05.0). During the conversion process, sound velocity profiles were used to minimize potential refraction artifacts from fluctuations in the speed of sound within the water column. Various bathymetric filters were applied to eliminate sounding outliers. Person who carried out this activity:
    Aaron Turecek
    U.S. Geological Survey
    Geographer
    384 Woods Hole Rd.
    Woods Hole, MA
    USA

    508-548-8700 x2230 (voice)
    508-457-2310 (FAX)
    aturecek@usgs.gov
    Date: 2009 (process 2 of 8)
    Prepare tide correction data. Depths were corrected to Mean Lower Low Water (MLLW) using 1-second RTK GPS heights from the Ashtech RTK GPS receiver mounted over the SWATHplus sonar head. These heights were extracted from each HYPACK navigation file using the AWK (version 3.1.6) script "doRTK1_by_line_FIX." ASCII text files for each survey day were compiled and reformatted to CARIS Tides format (yyyy/mm/dd hh:mm:ss t.ttt). Person who carried out this activity:
    Bill Danforth
    U.S. Geological Survey
    Geologist
    384 Woods Hole Rd.
    Woods Hole, MA
    USA

    508-548-8700 x2274 (voice)
    508-457-2310 (FAX)
    bdanforth@usgs.gov
    Date: 2009 (process 3 of 8)
    A new CARIS HIPS project (ver. 6.1) was created with projection information set to Universal Transverse Mercator (UTM) Zone 19, WGS84. Each SWATHplus processed file (SXP) was imported to the new CARIS project using the Import/Conversion Wizard. RTK tide files (prepared in previous processing step) were applied to all survey lines. Corrected tides were smoothed with a 1-minute moving-average in CARIS attitude editor. Navigation was edited as needed using the navigation editor tool in CARIS. A Bathymetric and Statistical Error (BASE) Surface was created at 1 meter and was reviewed for any inconsistencies or data anomalies. Filters were applied to each line including beam to beam slopes and across track angle. The CARIS refraction editor was used to adjust the speed of sound in cases where the velocimeter did not provide adequate correction to flatten out the depth profiles produced by localized variations in speed of sound through the water column. Areas of overlap between the outer beams and the nadir gap of adjacent lines were manually edited extensively throughout the survey area. A final BASE surface was created at a 5 meter cell size and reviewed. A final 5 meter cell size BASE surface was interpolated with a 5x5 matrix. The final 5 meter cell size BASE surface was exported to ASCII format. Person who carried out this activity:
    Aaron Turecek
    U.S. Geological Survey
    Geographer
    384 Woods Hole Rd.
    Woods Hole, MA
    USA

    508-548-8700 x2230 (voice)
    508-457-2310 (FAX)
    aturecek@usgs.gov
    Data sources used in this process:
    • `
    Date: 2009 (process 4 of 8)
    In ESRI ArcMap (version 9.3) the final 5-meter ASCII file exported from CARIS in the previous processing step was converted to a point feature class (ArcCatalog/Create Feature Class/From XY Table), which was then converted to an ESRI GRID (Spatial Analyst/Convert/Features to Raster). Person who carried out this activity:
    Aaron Turecek
    U.S. Geological Survey
    Geographer
    384 Woods Hole Rd.
    Woods Hole, MA
    USA

    508-548-8700 x2230 (voice)
    508-457-2310 (FAX)
    aturecek@usgs.gov
    Date: 13-Apr-2016 (process 5 of 8)
    Edits to the metadata were made to fix any errors that MP v 2.9.32 flagged. This is necessary to enable the metadata to be successfully harvested for various data catalogs. In some cases, this meant adding text "Information unavailable" or "Information unavailable from original metadata" for those required fields that were left blank. Other minor edits were probably performed (title, publisher, publication place, etc.). Fixed URL in abstract. The source information was incomplete and had to be modified to meet the standard. The distribution format name was modified in an attempt to be more consistent with other metadata files of the same data format. The metadata date (but not the metadata creator) was edited to reflect the date of these changes. The metadata available from a harvester may supersede metadata bundled within a download file. Compare the metadata dates to determine which metadata file is most recent. Person who carried out this activity:
    U.S. Geological Survey
    Attn: VeeAnn A. Cross
    Marine Geologist
    384 Woods Hole Rd.
    Woods Hole, MA

    508-548-8700 x2251 (voice)
    508-457-2310 (FAX)
    vatnipp@usgs.gov
    Date: 20-Jul-2018 (process 6 of 8)
    USGS Thesaurus keywords added to the keyword section. Person who carried out this activity:
    U.S. Geological Survey
    Attn: VeeAnn A. Cross
    Marine Geologist
    384 Woods Hole Road
    Woods Hole, MA

    508-548-8700 x2251 (voice)
    508-457-2310 (FAX)
    vatnipp@usgs.gov
    Date: 18-Nov-2019 (process 7 of 8)
    Crossref DOI link was added as the first link in the metadata. Person who carried out this activity:
    U.S. Geological Survey
    Attn: VeeAnn A. Cross
    Marine Geologist
    384 Woods Hole Road
    Woods Hole, MA

    508-548-8700 x2251 (voice)
    508-457-2310 (FAX)
    vatnipp@usgs.gov
    Date: 08-Sep-2020 (process 8 of 8)
    Added keywords section with USGS persistent identifier as theme keyword. Person who carried out this activity:
    U.S. Geological Survey
    Attn: VeeAnn A. Cross
    Marine Geologist
    384 Woods Hole Road
    Woods Hole, MA

    508-548-8700 x2251 (voice)
    508-457-2310 (FAX)
    vatnipp@usgs.gov
  3. What similar or related data should the user be aware of?
    Barnhardt, Walter A., Andrews, Brian D., and Butman, Bradford, 2006, High-Resolution Geologic Mapping of the Inner Continental Shelf: Nahant to Gloucester, Massachusetts: Open-File Report 2005-1293, U.S. Geological Survey, Reston, VA.

    Online Links:

    Ackerman, Seth D., Butman, Bradford, Barnhardt, Walter A., Danforth, William W., and Crocker, James M., 2006, High-Resolution Geologic Mapping of the Inner Continental Shelf: Boston Harbor and Approaches, Massachusetts: Open-File Report 2006-1008, U.S. Geological Survey, Reston, VA.

    Online Links:

    Barnhardt, Walter A., Andrews, Brian D., Ackerman, Seth D., Baldwin, Wayne E., and Hein, Christopher J., 2009, High-Resolution Geologic Mapping of the Inner Continental Shelf: Cape Ann to Salisbury Beach, Massachusetts: Open-File Report 2007-1373, U.S. Geological Survey, Reston, VA.

    Online Links:

    Barnhardt, Walter A., Ackerman, Seth D., Andrews, Brian D., and Baldwin, Wayne E., 2010, Geophysical and Sampling Data from the Inner Continental Shelf: Duxbury to Hull, Massachusetts.: http://pubs.usgs.gov/of/2009/1072/ 2009-1072, U.S. Geological Survey, Reston, VA.

    Online Links:


How reliable are the data; what problems remain in the data set?

  1. How well have the observations been checked?
  2. How accurate are the geographic locations?
    The SWATHplus transducers were mounted on a rigid, vertical pole, at the bow of the R/V Rafael, approximately 0.5 meters below the water line. Navigation antennas (one Differential Global Positioning System (DGPS) antenna and two Real-Time Kinematic (RTK) GPS antennas) were mounted on a horizontal crossbar atop the vertical transducer mount pole. The horizontal positions for soundings were acquired with an Octopus F180 Attitude and Positioning System integrated with a Novatel DGPS. Horizontal sounding positions were recorded to raw sonar data files (SXR) via SWATHplus acquisition software (version 3.06.05.00). Position data from an Ashtech Surveyor RTK GPS, a Novatel DL-V3 RTK GPS, and a CSI LGBX Pro DGPS were recorded by HYPACK survey software to HYPACK raw files. A conservative estimate of the positional accuracy of the CSI LGBX Pro DGPS unit is ± 2 meters.
  3. How accurate are the heights or depths?
    The manufacturer specifications for the SWATHplus interferometric sonar system indicate the vertical accuracy of data collected is approximately 1% of the water depth. In the Red Brook Harbor survey area, 1% of the water depth translates to a vertical accuracy range of 0 to 0.11 meters. RTK GPS was used to establish water-level heights relative to Mean Lower Low Water (MLLW) at decimeter-scale accuracies. Tide-correction was performed in post-processing (see process steps). Refraction artifacts were minimized by acquiring sound velocity profiles throughout the survey area to correct vertical offsets to soundings resulting from variations in the speed of sound within the water column. Daily changes in vessel draft due to fuel and water usage were not considered. Based on acquisition sensor accuracy, tide correction, and correction for speed of sound variability in the water column, it is estimated that the overall vertical accuracy of these bathymetric data is approximately 0.5 meters.
  4. Where are the gaps in the data? What is missing?
    All quality main survey line bathymetric data that were collected within the Red Brook Harbor survey area were incorporated in this grid. Soundings were processed and edited using Computer Aided Resource Information System (CARIS) Hydrographic Information Processing System (HIPS; ver. 6.1). Although the soundings were manually edited, small data spikes may exist at outer edges of some swaths. In addition, small gaps between adjacent survey lines may exist in the shallowest areas of the survey. Tielines were used to verify tide corrections during post-processing, but were not used in generating this grid.
  5. How consistent are the relationships among the observations, including topology?
    This grid was interpolated to close data gaps that occurred along-track at nadir, and between adjacent lines.

How can someone get a copy of the data set?

Are there legal restrictions on access or use of the data?
Access_Constraints: None
Use_Constraints:
Public domain data from the U.S. Government are freely redistributable with proper metadata and source attribution. Please recognize the U.S. Geological Survey as the source of this information. Not to be used for navigation.
  1. Who distributes the data set? (Distributor 1 of 1)
    Aaron Turecek
    U.S. Geological Survey
    Geographer
    384 Woods Hole Rd.
    Woods Hole, MA
    USA

    508-548-8700 x2230 (voice)
    508-457-2310 (FAX)
    aturecek@usgs.gov
  2. What's the catalog number I need to order this data set? Downloadable Data
  3. What legal disclaimers am I supposed to read?
    Neither the U.S. Government, the Department of the Interior, nor the USGS, nor any of their employees, contractors, or subcontractors, make any warranty, express or implied, nor assume any legal liability or responsibility for the accuracy, completeness, or usefulness of any information, apparatus, product, or process disclosed, nor represent that its use would not infringe on privately owned rights. The act of distribution shall not constitute any such warranty, and no responsibility is assumed by the USGS in the use of these data or related materials. Any use of trade, product, or firm names is for descriptive purposes only and does not imply endorsement by the U.S. Government.
  4. How can I download or order the data?
    • Availability in digital form:
      Data format: WinZip file containing the ESRI GRID of swath bathymetric data from the Red Brook Harbor survey area and associated metadata. in format AIG (version ArcGIS 9.3) Size: 0.7
      Network links: http://pubs.usgs.gov/of/2010/1091/GIS/raster/bathy/rb_bathy_5m.zip
      Media you can order: DVD-ROM (Density 4.75 Gbytes) (format UDF)
    • Cost to order the data: none

  5. What hardware or software do I need in order to use the data set?
    These data are available as an Environmental Systems Research Institute (ESRI) 32-bit floating point GRID. The grid consists of two folders, one with the "grid name", and one "info" folder. The two folders for each grid are compressed into one file using WinZip (ver. 9.0) software. To utilize these data, the user must have software capable of uncompressing the WinZip file and importing and viewing an ESRI grid. The two folders for each grid must be uncompressed to the same folder. Extracting grids from different publications into the same folder is not recommended and will likely render some of your grids unusable.

Who wrote the metadata?

Dates:
Last modified: 16-Nov-2021
Metadata author:
Aaron Turecek
U.S. Geological Survey
Geographer
384 Woods Hole Rd.
Woods Hole, MA
USA

508-548-8700 x2230 (voice)
508-457-2310 (FAX)
whsc_data_contact@usgs.gov
Contact_Instructions:
The metadata contact email address is a generic address in the event the metadata contact is no longer with the USGS or the email is otherwise invalid.
Metadata standard:
FGDC Content Standards for Digital Geospatial Metadata (FGDC-STD-001-1998)

This page is <https://cmgds.marine.usgs.gov/catalog/whcmsc/open_file_report/ofr2010-1091/rb_bathy_5m.grd.faq.html>
Generated by mp version 2.9.50 on Tue Nov 16 10:06:40 2021