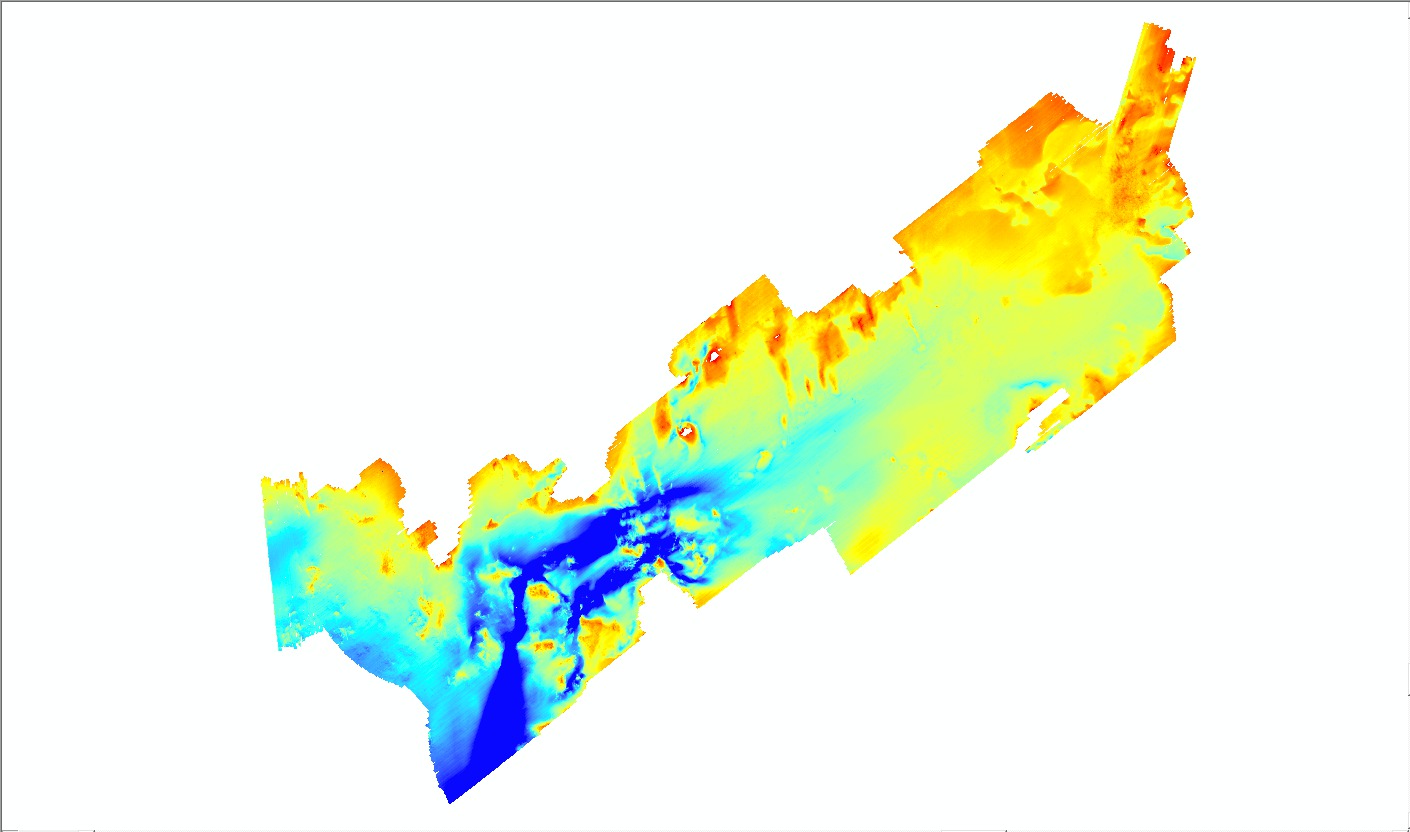
5 meter ArcRaster grid of bathymetry data collected in Buzzards Bay by the U.S. Geological Survey and the National Oceanic and Atmospheric Administration offshore of Massachusetts in 2004, 2009, 2010, and 2011 (BB_bathy5m, UTM Zone 19N, Esri BINARY GRID)
These data were collected under a cooperative agreement between the Massachusetts Office of Coastal Zone Management (CZM) and the U.S. Geological Survey (USGS), Coastal and Marine Geology Program, Woods Hole Coastal and Marine Science Center (WHSC). Initiated in 2003, the primary objective of this program is to develop regional geologic framework information for the management of coastal and marine resources. Accurate data and maps of seafloor geology are important first steps toward protecting fish habitat, delineating marine resources, and assessing environmental changes due to natural or human impacts. The project is focused on the inshore waters of coastal Massachusetts, primarily in water depths of 5 to 30 meters (m) deep. Data collected for the mapping cooperative have been released in a series of USGS Open-File Reports (
http://woodshole.er.usgs.gov/project-pages/coastal_mass/). The data collected in the study area in Buzzards Bay, Massachusetts, include high-resolution geophysics (bathymetry, backscatter intensity, and seismic reflection) and ground validation (sediment samples, video tracklines, and bottom photographs). The geophysical data are released in USGS Open-File Report 2012-1002, High-Resolution Geophysical Data from the Inner Continental Shelf: Buzzards Bay, Massachusetts (
http://pubs.usgs.gov/of/2012/1002/). The sampling data have not been prepared for publication yet. The geophysical data were collected during four separate surveys conducted between 2004 and 2011 (National Oceanic and Atmospheric Administration (NOAA) survey H11319 (in 2004; bathymetry only) and USGS surveys 2009-002-FA, 2010-004-FA, and 2011-004-FA)) and cover 410 square kilometers of the inner continental shelf.
More information about the individual USGS surveys conducted as part of the Buzzards Bay project can be found on WHCS Field Activity Web pages:
2009-002-FA:
http://woodshole.er.usgs.gov/operations/ia/public_ds_info.php?fa=2009-002-FA
2010-004-FA:
http://woodshole.er.usgs.gov/operations/ia/public_ds_info.php?fa=2010-004-FA
2011-004-FA:
http://woodshole.er.usgs.gov/operations/ia/public_ds_info.php?fa=2011-004-FA
Information about the NOAA survey can be found at:
H11319:
http://surveys.ngdc.noaa.gov/mgg/NOS/coast/H10001-H12000/H11319/DR/