Hillshaded-relief image produced from lead-line and single-beam sonar soundings, swath interferometric, multibeam, and lidar datasets (bb_navd88_hs_10m, Esri grid, UTM Zone 19N, WGS 84)

Metadata also available as - [Outline] - [Parseable text] - [XML]

Frequently anticipated questions:


What does this data set describe?

Title:
Hillshaded-relief image produced from lead-line and single-beam sonar soundings, swath interferometric, multibeam, and lidar datasets (bb_navd88_hs_10m, Esri grid, UTM Zone 19N, WGS 84)
Abstract:
Geologic, sediment texture, and physiographic zone maps characterize the sea floor of Buzzards Bay, Massachusetts. These maps were derived from interpretations of seismic-reflection profiles, high-resolution bathymetry, acoustic-backscatter intensity, bottom photographs, and surficial sediment samples. The interpretation of the seismic stratigraphy and mapping of glacial and Holocene marine units provided a foundation on which the surficial maps were created. This mapping is a result of a collaborative effort between the U.S. Geological Survey and the Massachusetts Office of Coastal Zone Management to characterize the surface and subsurface geologic framework offshore of Massachusetts.
  1. How might this data set be cited?
    Foster, David S., 2014, Hillshaded-relief image produced from lead-line and single-beam sonar soundings, swath interferometric, multibeam, and lidar datasets (bb_navd88_hs_10m, Esri grid, UTM Zone 19N, WGS 84): Open-File Report 2014-1220, U.S. Geological Survey, Coastal and Marine Geology Program, Woods Hole Coastal and Marine Science Center, Woods Hole, MA.

    Online Links:

    This is part of the following larger work.

    Foster, David S., Baldwin, Wayne E., Barnhardt, Walter A., Schwab, William C., Ackerman, Seth D., Andrews, Brian D., and Pendleton, Elizabeth A., 2014, Shallow Geology, Sea-Floor Texture, Physiographic Zones of Buzzards Bay, Massachusetts: Open-File Report 2014-1220, U.S. Geological Survey, Reston, VA.

    Online Links:

  2. What geographic area does the data set cover?
    West_Bounding_Coordinate: -71.132099
    East_Bounding_Coordinate: -70.592494
    North_Bounding_Coordinate: 41.769097
    South_Bounding_Coordinate: 41.366862
  3. What does it look like?
    http://pubs.usgs.gov/of/2014/1220/GIS_catalog/SourceData/bb_navd88_hs_browse.png (PNG)
    Topographic and Bathymetric hillshade image
  4. Does the data set describe conditions during a particular time period?
    Beginning_Date: 1934
    Ending_Date: 31-Aug-2011
    Currentness_Reference:
    ground condition
  5. What is the general form of this data set?
    Geospatial_Data_Presentation_Form: raster digital data
  6. How does the data set represent geographic features?
    1. How are geographic features stored in the data set?
      This is a Raster data set. It contains the following raster data types:
      • Dimensions 4373 x 4407 x 1, type Pixel
    2. What coordinate system is used to represent geographic features?
      Grid_Coordinate_System_Name: Universal Transverse Mercator
      Universal_Transverse_Mercator:
      UTM_Zone_Number: 19
      Transverse_Mercator:
      Scale_Factor_at_Central_Meridian: 0.999600
      Longitude_of_Central_Meridian: -69.000000
      Latitude_of_Projection_Origin: 0.000000
      False_Easting: 500000.000000
      False_Northing: 0.000000
      Planar coordinates are encoded using row and column
      Abscissae (x-coordinates) are specified to the nearest 10.000000
      Ordinates (y-coordinates) are specified to the nearest 10.000000
      Planar coordinates are specified in meters
      The horizontal datum used is D_WGS_1984.
      The ellipsoid used is WGS_1984.
      The semi-major axis of the ellipsoid used is 6378137.000000.
      The flattening of the ellipsoid used is 1/298.257224.
  7. How does the data set describe geographic features?
    Entity_and_Attribute_Overview:
    NODATA is represented by white (255). There are no attributes associated with a TIFF image
    Entity_and_Attribute_Detail_Citation: U.S. Geological Survey

Who produced the data set?

  1. Who are the originators of the data set? (may include formal authors, digital compilers, and editors)
    • David S. Foster
  2. Who also contributed to the data set?
  3. To whom should users address questions about the data?
    David S. Foster
    U.S. Geological Survey
    Geologist
    U.S. Geological Survey
    Woods Hole, MA
    USA

    508-548-8700 x2271 (voice)
    508-457-2310 (FAX)
    dfoster@usgs.gov

Why was the data set created?

This hillshaded relief image was created as a single continuous surface of the shoreline and sea floor for Buzzards Bay. These data in both this final form and at the input resolutions helped define the sediment texture and distribution maps presented as interpretive data layers in USGS OFR 2014-1220

How was the data set created?

  1. From what previous works were the data drawn?
    Poppe and others, 2007 (source 1 of 8)
    Poppe, L.J., Ackerman, S.D., Foster, D.S., Blackwood, D.S., Butman, B., Moser, M.S., and Stewart, H.F., 2007, Sea-floor character and surface processes in the vicinity of Quicks Hole, Elizabeth Islands, Massachusetts: Open-File Report 2006-1357, U.S. Geological Survey, Reston, VA.

    Online Links:

    Type_of_Source_Media: online
    Source_Contribution:
    This publication provides the source multibeam bathymetry for the Quicks Hole area of Buzzards Bay. Two 29-foot launches deployed from the NOAA Ship Thomas Jefferson were used to acquire bathymetric and backscatter data during 2004. The multibeam bathymetric data were collected with hull-mounted 455-kHz RESON 8125 and 240-kHz RESON 8101 systems. The sidescan sonar data were acquired with a hull-mounted Klein 5250 system operating at 100 kHz. Sediment samples and bottom photos were collected aboard the R/V Rafael with a modified Van Veen grab sampler and SEABOSS, respectively.
    Pendleton and others, 2012 (source 2 of 8)
    Pendleton, E.A., Twichell, D.C., Foster, D.S., Worley, C.R, Irwin, B.J., and Danforth, W.W., 2012, High-resolution geophysical data from the sea floor surrounding the Western Elizabeth Islands, Massachusetts: Open-File Report 2011-1184, U.S. Geological Survey, Reston, VA.

    Online Links:

    Type_of_Source_Media: online
    Source_Contribution:
    This report provided source swath bathymetry for the area of Buzzards Bay surrounding the western Elizabeth Islands. Surveying was conducted aboard the RV Rafael in September 2010. Interferometric-sonar, sidescan-sonar, and chirp seismic-reflection systems were deployed simultaneously during the cruise. Bathymetric sounding data were collected with an SEA SWATHplus 234-kilohertz (kHz) interferometric sonar system. Sidescan-sonar (acoustic-backscatter) data were acquired with a Klein 3000 dual-frequency (100 and 500 kHz) sidescan-sonar system.
    Turecek and others, 2012 (source 3 of 8)
    Turecek, A.M., Danforth, W.W., Baldwin, W.E., and Barnhardt, W.A., 2012, High-resolution geophysical data collected within Red Brook Harbor, Buzzards Bay, Massachusetts, in 2009: Open-File Report 2010-1091, U.S. Geological Survey, Reston, VA.

    Online Links:

    Type_of_Source_Media: online
    Source_Contribution:
    This report provided the source swath bathymetry data for Buzzards Bay in the area of Red Brook Harbor. Surveying was conducted aboard the R/V Rafael. Bathymetric data were collected with an SEA SWATHplus 234-kilohertz (kHz) interferometric sonar system. Acoustic backscatter, a measure of the intensity of returns from an insonified area of the sea floor, was recorded by the SEA SWATHplus interferometric sonar system.
    Ackerman and others, 2013 (source 4 of 8)
    Ackerman, S.D., Andrews, B.D., Foster, D.S., Baldwin, W.E., and Schwab, W.C., 2013, High-Resolution Geophysical Data from the Inner Continental Shelf: Buzzards Bay, Massachusetts: Open-File Report 2012-1002, U.S. Geological Survey, Reston, VA.

    Online Links:

    Type_of_Source_Media: online
    Source_Contribution:
    This report provided the source swath and multibeam bathymetry for Buzzards Bay. The mapping was conducted during research cruises aboard the NOAA Ship RUDE (2004), the Megan T. Miller (2009 and 2010) and the Scarlett Isabella (2011). The NOAA Ship RUDE acquired bathymetric soundings in 2004 using a RESON SeaBat 8125 455-kHz multibeam-echosounder system. All other surveys used the following systems: bathymetric data were acquired in the Buzzards Bay survey area using a Systems Engineering and Assessment, Ltd. (SEA) SWATHplus-M 234-kilohertz (kHz) interferometric sonar system; acoustic backscatter data were collected with a Klein 3000 dual-frequency sidescan-sonar (132 and 445 kHz).
    Pendleton and others, 2014 (source 5 of 8)
    Pendleton, E.A., Andrews, B.D., Danforth, W.W., and Foster, D.S., 2014, High-resolution geophysical data collected aboard the U.S. Geological Survey research vessel Rafael to supplement existing datasets from Buzzards Bay and Vineyard Sound, Massachusetts: Open-File Report 2013-1020, U.S. Geological Survey, Reston, VA.

    Online Links:

    Type_of_Source_Media: online
    Source_Contribution:
    This report provided the source swath bathymetry for Buzzards Bay in the area of Naushon Island. These areas were surveyed with the RV Rafael in 2011. Swath bathymetry data were collected with an SEA SWATHplus 234-kilohertz (kHz) interferometric sonar system. Sidescan-sonar (acoustic-backscatter) data were acquired with a Klein 3000 dual-frequency (100 and 500 kHz) sidescan-sonar system.
    Poppe and others, 2008 (source 6 of 8)
    Poppe, L.J., McMullen, K.Y., Foster, D.S., Blackwood, D.S., Williams, S.J., Ackerman, S.D., Barnum, S.R., and Brennan, R.T., 2008, Sea-floor character and sedimentary processes in the vicinity of Woods Hole, Massachusetts: Open File Report 2008-1004, U.S. Geological Survey, Reston, VA.

    Online Links:

    Type_of_Source_Media: online
    Source_Contribution:
    This publication provides the source multibeam bathymetry for Woods Hole. Two 29-foot launches deployed from the NOAA Ship Whiting were used to acquire bathymetric and backscatter data during 2001. The bathymetric data were collected with a hull-mounted 240-kHz RESON 8101 shallow-water system aboard launch 1005. The sidescan-sonar data were acquired with a hull-mounted Klein T-5000 system operating at 455 kHz aboard launch 1014.
    Lidar (source 7 of 8)
    U.S. Army Corps of Engineers, and Joint Airborne LiDAR Bathymetry Center of Expertise, 2008, Massachusetts LiDAR Grid Data in Coastal Areas: Fugro Pelagos, Inc, San Diego, CA.

    Type_of_Source_Media: raster digital data
    Source_Contribution:
    The source lidar data for the very nearshore (< -5 m) region. Lidar (Light Detection and Ranging) data were acquired with a SHOALS-1000T (for hydrographic & topographic data) using the Joint Airborne Joint Airborne LiDAR Bathymetry Center of Expertise (JALBTCX) lidar plane. These data were provided by the USACOE to the USGS and the Massachusetts Office of Coastal Zone Management, who requested the USACOE to collect these data. These data are now publically available in LAS lidar format via NOAA's Digital Coast website: (http://csc.noaa.gov/htdata/lidar1_z/geoid12a/data/116/)
    NOAA Single Beam Soundings (source 8 of 8)
    NOAA National Geophysical Data Center, unknown, NOS Hydrographic Survey Data.

    Online Links:

    Type_of_Source_Media: online
    Source_Contribution:
    These data include NOAA lead-line and single-beam sonar soundings, which were used to cover areas where no swath bathymetry or lidar data exist.
  2. How were the data generated, processed, and modified?
    Date: 2013 (process 1 of 16)
    Collected the source datasets: NOAA data from NOS hydrographic surveys in the 1900s (lead-line and single-beam soundings) were downloaded from the NGDC website individually (http://maps.ngdc.noaa.gov/viewers/bathymetry/) in XYZ ASCII format; these data were in Geographic NAD83 horizontal datum and referenced to Mean Lower Low Water vertical datum. Data from NOAA NOS Hydrographic surveys conducted since 2000 were received directly from NGDC via personal communication and transfer of the CARIS HIPS/SIP HDCS directory (fully processed hydrographic survey data) by hard drive or FTP server. The 2000 era data used were in either XYZ or CARIS BASE surface format; these data were in UTM Zone 19N horizontal datum and referenced to Mean Lower Low Water vertical datum. The following NOAA NOS survey data were used: 1930s - H05622, H05628, H05630, H06445; 1950s - H06742, H08170; 1970s - H09615, H09628, H09644, H09645, H09646, H09647, H09661, H09668, H09669, H09712, H09724; 1990s - F00378, F00406, H10434, H10458, H10461, H10496, H10511, H10520, H10530, H10575; 2000s - H11076 (we received XYZ directly from NGDC), H11077 (we received XYZ directly from NGDC), H11318 (covered by USGS 2009/2010 data), H11319 (incorporated into USGS 2009/2010 data). Gridded data from surveys H11076 and H11077 can be downloaded in Esri grid format as listed in the Source Citations (NOAA Single-Beam Soundings). Person who carried out this activity:
    Seth Ackerman
    U.S. Geological Survey
    Geologist
    U.S. Geological Survey
    Woods Hole, MA
    USA

    508-5488700 x2331 (voice)
    508-457-2310 (FAX)
    sackerman@usgs.gov
    Date: 2013 (process 2 of 16)
    USGS data from recent swath bathymetry surveys used the in-house CARIS HDCS data (final BASE surfaces that were exported to Esri format grids for the following projects/publications): Buzzards Bay OFR 2012-1002 (USGS Field Activities 2009-002-FA, 2010-004-FA, 2011-004-FA, NOAA Hydrographic Survey H11319); Red Brook Harbor OFR 2010-1091 (USGS Field Activity 2009-018-FA); Western Elizabeth Islands OFR 2011-1184 (USGS Field Activity 2010-003-FA); Elizabeth Islands OFR 2013-1020 (USGS Field Activity 2011-003). These data may be downloaded in Esri grid format as listed in the Source Citations (Poppe and others, 2007;Poppe and others, 2008; Pendleton and others, 2012; Turecek and others, 2012; Ackerman and others, 2013; Pendleton and others, 2014). These data are in UTM Zone 19N horizontal datum and referenced to Mean Lower Low Water vertical datum. US Army Corp of Engineerslidar data used the topobathy 32-bit GeoTIFFs that were received directly from USACOE; these data (Tiles 01, 02, 03 from 2005-2007 survey) are also available in LAS Lidar format via NOAA Digital Coast at (http://csc.noaa.gov/htdata/lidar1_z/geoid12a/data/116/) Person who carried out this activity:
    Seth Ackerman
    U.S. Geological Survey
    Geologist
    U.S. Geological Survey
    Woods Hole, MA
    USA

    508-548-8700 x2331 (voice)
    508-457-2310 (FAX)
    sackerman@usgs.gov
    Date: 2013 (process 3 of 16)
    Created CARIS Point Cloud CSAR files for all of the XYZ datasets using CARIS BASE Editor v4.0.5. Person who carried out this activity:
    Seth Ackerman
    U.S. Geological Survey
    Geologist
    384 Woods Hole Road
    Woods Hole, MA
    USA

    508-548-8700 x2315 (voice)
    508-457-2310 (FAX)
    sackerman@usgs.gov
    Date: 2013 (process 4 of 16)
    CARIS CSAR format surfaces were created for each of the individual point cloud dataset of the NOAA survey data: 1. Point cloud CSAR files were brought into CARIS BASE Editor 2. Create TIN from point cloud file 3. TIN Edge Removal process was run using the default parameters, usually twice. In few cases a "coverage hole" was manually digitized to ensure that the TIN did not extend across land/islands/shoals that were not mapped (these features were digitized off a NOAA nautical chart). 4. Interpolate Surface from TIN (results in a ***_surface.csar file for each point cloud dataset) 5. Point cloud files and surface files were grouped by decade in BASE Editor for ease of data management. 6. The "Data End Date" property for each survey surface was populated with the final survey day for each hydrographic survey on the basis of information from the NOAA Descriptive Reports. Person who carried out this activity:
    Seth Ackerman
    U.S. Geological Survey
    Geologist
    384 Woods Hole Road
    Woods Hole, MA
    USA

    508-457-2331 (voice)
    508-457-2310 (FAX)
    sackerman@usgs.gov
    Date: 2013 (process 5 of 16)
    Combined all the data sources in CARIS BASE Editor (Tools -> Surfaces -> Combine...) 1. (General). Choose all the surfaces to include, set output CSAR filename (D:\BuzzardsBay\Bathy_working\output_csar\BB_Combine_ALL_2Aug2013.csar) 2. (Options). Choose Horizontal Coordinate system - UTM - WGS84 Zone 19N (Key UTM-19N), Resolution = 10m, Name of primary z layer = "depth" 3. (Extent). Zoom out to the full extent of the input datasets and use the cross-hair to set the output extent 4. (Conflicts). Imported the conflict file rule_NewestPriority.crfx which was created in this dialogue previously and defines the rule to use as "Where the attribute EndDate is greatest" meaning that priority goes to the dataset with the more recent Data End Date value in the case of overlapping data. Person who carried out this activity:
    Seth Ackerman
    U. S. Geological Survey
    Geologist
    384 Woods Hole Road
    Woods Hole, MA
    USA

    508-548-8700 x2315 (voice)
    508-457-2310 (FAX)
    sackerman@usgs.gov
    Date: 2013 (process 6 of 16)
    Exported the combined CSAR grid to XYZ file (BB_Combine_ALL_22Aug2013.xyz.txt) Person who carried out this activity:
    Seth Ackerman
    U.S. Geological Survey
    Geologist
    384 Woods Hole Road
    Woods Hole, MA
    USA

    508-548-8700 x2315 (voice)
    508-457-2310 (FAX)
    sackerman@usgs.gov
    Date: 2013 (process 7 of 16)
    Using VDatum - NOAA's Vertical Datum Transformation 3.2, converted from MLLW to NAVD88 vertical datum (BB_Combine_ALL_22Aug2013Nodata.xyz.txt) Person who carried out this activity:
    Seth Ackerman
    U.S. Geological Survey
    Geologist
    384 Woods Hole Road
    Woods Hole, MA
    USA

    508-548-8700 x2315 (voice)
    508-457-2310 (FAX)
    sackerman@usgs.gov
    Date: 2013 (process 8 of 16)
    In CARIS BASE Editor v4.0.5: Created a CSAR from the new XYZ grid with NAVD88 heights (BB_Combine_ALL_22Aug2013Nodata.xyz.csar) Person who carried out this activity:
    Seth Ackerman
    U.S. Geological Survey
    Geologist
    384 Woods Hole Road
    Woods Hole, MA
    USA

    508-548-8700 x2315 (voice)
    508-457-2310 (FAX)
    sackerman@usgs.gov
    Date: 2013 (process 9 of 16)
    In Global Mapper v14.2.5: Converted ACOE LiDAR 32-bit GeoTIFFs to gridded XYZ, then exported XYZ file (LIDAR_XYZ_fromGlobalMapper.xyz) Person who carried out this activity:
    Seth Ackerman
    U.S. Geological Survey
    Geologist
    384 Woods Hole Road
    Woods Hole, MA
    USA

    508-548-8700 x2315 (voice)
    508-457-2310 (FAX)
    sackerman@usgs.gov
    Date: 2013 (process 10 of 16)
    In CARIS BASE Editor v4.0.5: imported LiDAR XYZ file to create CSAR grid (LIDAR_XYZ_fromGlobalMapper.csar) then combined the bathy data (BB_Combine_ALL_22Aug2013Nodata.xyz.csar) with the LIDAR data (LIDAR_XYZ_fromGlobalMapper.csar), the LIDAR data took precedence, to create a combined CSAR surface BB_Combine_FINAL_28Aug2013.csar), then exported the combined bathy and bathy LiDAR grid to an Esri ASCII grid (BB_Combine_wLIDAR_28Aug2013.asc). The original LiDAR GeoTIFFs were in Geographic NAD83 horizontal datum and NAVD88 vertical datum. They were reprojected and transformed to UTM Zone 19N horizontal datum during the import to CARIS BASE Editor CSAR format. Person who carried out this activity:
    Seth Ackerman
    U.S. Geological Survey
    Geologist
    384 Woods Hole Road
    Woods Hole, MA
    USA

    508-548-8700 x2315 (voice)
    508-457-2310 (FAX)
    sackerman@usgs.gov
    Date: 2013 (process 11 of 16)
    In ArcMap 10.1: Using ArcToolbox - conversion tools - to Raster - ASCII to Raster: input BB_Combine_wLIDAR_28Aug2013.asc, output D:\BuzzardsBay\Bathy_working\FINAL_GRID\temp, float Using ArcToolbox - Spatial Analyst Tools - Extraction - Extract by Mask: Clipped the grid "temp" by the shapefile BuzzBay_WaterOnly_shape.shp, output temp_clip Using ArcToolbox - Spatial Analyst Tools - Extraction - Extract by Attributes: Clipped the grid to "value < 0", output D:\BuzzardsBay\Bathy_working\FINAL_GRID\BB_NAVD88_10m Person who carried out this activity:
    Seth Ackerman
    U.S. Geological Survey
    Geologist
    384 Woods Hole Road
    Woods Hole, MA
    USA

    508-548-8700 x2315 (voice)
    508-457-2310 (FAX)
    sackerman@usgs.gov
    Date: 2014 (process 12 of 16)
    Using 3D Analyst, a hillshade was created using Surface Analysis - Hillshade. The azimuth was 315, the altitude was 45, and the z-factor was 2. The hillshade grid was converted to a TIFF by right-clicking on the grid in the table of contents and choosing "export data" and TIFF image format. Person who carried out this activity:
    David S. Foster
    U.S. Geological Survey
    Geologist
    384 Woods Hole Road
    Woods Hole, MA
    USA

    508-548-8700 x2271 (voice)
    508-457-2310 (FAX)
    dfoster@usgs.gov
    Data sources used in this process:
    • \GIS_catalog\SourceData\bathy\bb_navd88_10m
    Date: 12-May-2016 (process 13 of 16)
    Edits to the metadata were made to fix any errors that MP v 2.9.32 flagged. This is necessary to enable the metadata to be successfully harvested for various data catalogs. In some cases, this meant adding text "Information unavailable" or "Information unavailable from original metadata" for those required fields that were left blank. Other minor edits were probably performed (title, publisher, publication place, etc.). Empty fields were deleted. Links to the data were fixed. The metadata date (but not the metadata creator) was edited to reflect the date of these changes. The metadata available from a harvester may supersede metadata bundled within a download file. Compare the metadata dates to determine which metadata file is most recent. Person who carried out this activity:
    U.S. Geological Survey
    Attn: VeeAnn A. Cross
    Marine Geologist
    384 Woods Hole Rd.
    Woods Hole, MA

    508-548-8700 x2251 (voice)
    508-457-2310 (FAX)
    vatnipp@usgs.gov
    Date: 20-Jul-2018 (process 14 of 16)
    USGS Thesaurus keywords added to the keyword section. Person who carried out this activity:
    U.S. Geological Survey
    Attn: VeeAnn A. Cross
    Marine Geologist
    384 Woods Hole Road
    Woods Hole, MA

    508-548-8700 x2251 (voice)
    508-457-2310 (FAX)
    vatnipp@usgs.gov
    Date: 18-Nov-2019 (process 15 of 16)
    Crossref DOI link was added as the first link in the metadata. Person who carried out this activity:
    U.S. Geological Survey
    Attn: VeeAnn A. Cross
    Marine Geologist
    384 Woods Hole Road
    Woods Hole, MA

    508-548-8700 x2251 (voice)
    508-457-2310 (FAX)
    vatnipp@usgs.gov
    Date: 08-Sep-2020 (process 16 of 16)
    Added keywords section with USGS persistent identifier as theme keyword. Person who carried out this activity:
    U.S. Geological Survey
    Attn: VeeAnn A. Cross
    Marine Geologist
    384 Woods Hole Road
    Woods Hole, MA

    508-548-8700 x2251 (voice)
    508-457-2310 (FAX)
    vatnipp@usgs.gov
  3. What similar or related data should the user be aware of?
    U.S. Geological Survey, 2013, Geologic Mapping of the Seafloor Offshore of Massachusetts: U.S. Geological Survey, Coastal and Marine Geology Program, Woods Hole Coastal and Marine Science Center, Woods Hole, MA.

    Online Links:

    Other_Citation_Details:
    Geologic mapping of the Massachusetts inner continental shelf is a cooperative effort that was initiated in 2003 by the U.S. Geological Survey (USGS) and the Massachusetts Office of Coastal Zone Management (CZM). The National Oceanic and Atmospheric Administration (NOAA-NOS) is also an important partner and contributes hydrographic data that are integrated into the maps. The overall goal of this cooperative is to determine the geologic framework of the sea floor inside the 3-mile limit of State waters, using high-resolution geophysical techniques, sediment sampling, and sea-floor photography. These topographic and bathymetric source data related to the composite topographic and bathymetric grid are cited in detail in the source citation section of this metadata file.

How reliable are the data; what problems remain in the data set?

  1. How well have the observations been checked?
  2. How accurate are the geographic locations?
    The horizontal accuracy of the source multibeam bathymetry (DGPS) is reported at +/- 3 meters. The horizontal accuracy of the swath bathymetry (DGPS and/or RTK-GPS) is conservatively estimated to be +/- 10m. The lidar data was collected to meet the +/- 3-m accuracy specification. This composite topographic and bathymetric grid is assumed to be horizontally accurate to within 20-meters, as additional errors could have been introduced during resampling, vertical and horizontal reprojections, and mosaicking.Horizontal accuracy for lead-line and single-beam sonar soundings are not documented. See NOAA survey descriptive reports for individual survey positioning methods.
  3. How accurate are the heights or depths?
    The vertical accuracy for NOAA lead-line and singl-beam sonar soundings are not documented. NOAA survey methods and processing of sounding data are in descriptive reports. All XYZ sounding data downloaded from NGDC are in tenths of meters. The vertical accuracy of the source multibeam bathymetry (RESON SeaBat 8101) is reported at +/- 30 to 50-cm. The vertical accuracy of the swath bathymetry is estimated to be +/- 0.1 to 0.6-m. The lidar data wer collected to meet the +/- 30-cm accuracy specification. This composite topographic and bathymetric grid is assumed to be vertically accurate to within 1-m, as additional errors could have been introduced during resampling, vertical and horizontal reprojections, and mosaicking.
  4. Where are the gaps in the data? What is missing?
    This image includes lead-line soundings, single-beam sonar, swath interferometric, multibeam, and lidar data collected during several surveys in Buzzards Bay. The input grids can be downloaded by visiting the publications listed in the Source Information.
  5. How consistent are the relationships among the observations, including topology?
    This hillshaded-relief image was created from several smaller bathymetry and lidar datasets that were processed and published in various formats and datums (see Source Information for the individual input data). NOAA single-beam sonar soundings were merged with the swath bathymetry. Each acoustic bathymetric source dataset was imported into CARIS BASE Editor were they were combined into a single 10-m per pixel DEM with priority generally given to the higher resolution and more recently collected dataset for overlapping areas. The entire grid was converted to the North American Vertical Datum of 1988 (NAVD 88) using VDATUM (version 3.2). The output of VDATUM was imported back into CARIS BASE Editor and was combined with the lidar data that was already referenced to the NAVD 88 vertical datum. The final output bathymetric DEM is comprised of the best available bathymetric data for Buzzards Bay at the time of this publication.

How can someone get a copy of the data set?

Are there legal restrictions on access or use of the data?
Access_Constraints None
Use_Constraints Not to be used for navigation. Public domain data from the U.S. Government are freely redistributable with proper metadata and source attribution. Please recognize the U.S. Geological Survey (USGS) as the source of this information.
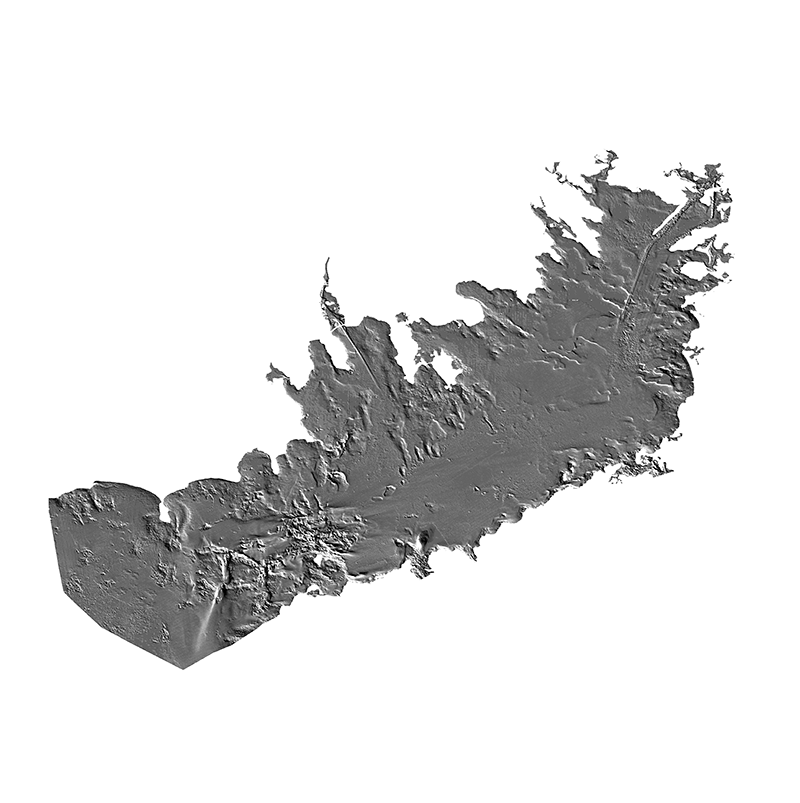
  1. Who distributes the data set? (Distributor 1 of 1)
    David S. Foster
    U.S. Geological Survey
    Geologist
    384 Woods Hole Rd.
    Woods Hole, MA
    USA

    508-548-8700 x2271 (voice)
    508-457-2310 (FAX)
    dfoster@usgs.gov
  2. What's the catalog number I need to order this data set? Downloadable Data
  3. What legal disclaimers am I supposed to read?
    Neither the U.S. Government, the Department of the Interior, nor the USGS, nor any of their employees, contractors, or subcontractors, make any warranty, express or implied, nor assume any legal liability or responsibility for the accuracy, completeness, or usefulness of any information, apparatus, product, or process disclosed, nor represent that its use would not infringe on privately owned rights. The act of distribution shall not constitute any such warranty, and no responsibility is assumed by the U.S. Geological Survey in the use of these data or related materials. Any use of trade, product, or firm names is for descriptive purposes only and does not imply endorsement by the U.S. Government
  4. How can I download or order the data?
  5. What hardware or software do I need in order to use the data set?
    The image contained in the zip file is available as a GeoTIFF with a world file. To utilize this data, the user must have an image viewer, or an image processing or GIS software package capable of importing a TIFF image.

Who wrote the metadata?

Dates:
Last modified: 18-Mar-2024
Metadata author:
U.S. Geological Survey
Attn: David S. Foster
Geologist
384 Woods Hole Rd.
Woods Hole, MA
USA

508-548-8700 x2271 (voice)
508-457-2310 (FAX)
whsc_data_contact@usgs.gov
Contact_Instructions:
The metadata contact email address is a generic address in the event the person is no longer with USGS. (updated on 20240318)
Metadata standard:
FGDC Content Standards for Digital Geospatial Metadata (FGDC-STD-001-1998)

This page is <https://cmgds.marine.usgs.gov/catalog/whcmsc/open_file_report/ofr2014-1220/bb_navd88_hs_10m_meta.faq.html>
Generated by mp version 2.9.51 on Mon Mar 25 16:05:44 2024