Online Links:
Online Links:
| Range of values | |
|---|---|
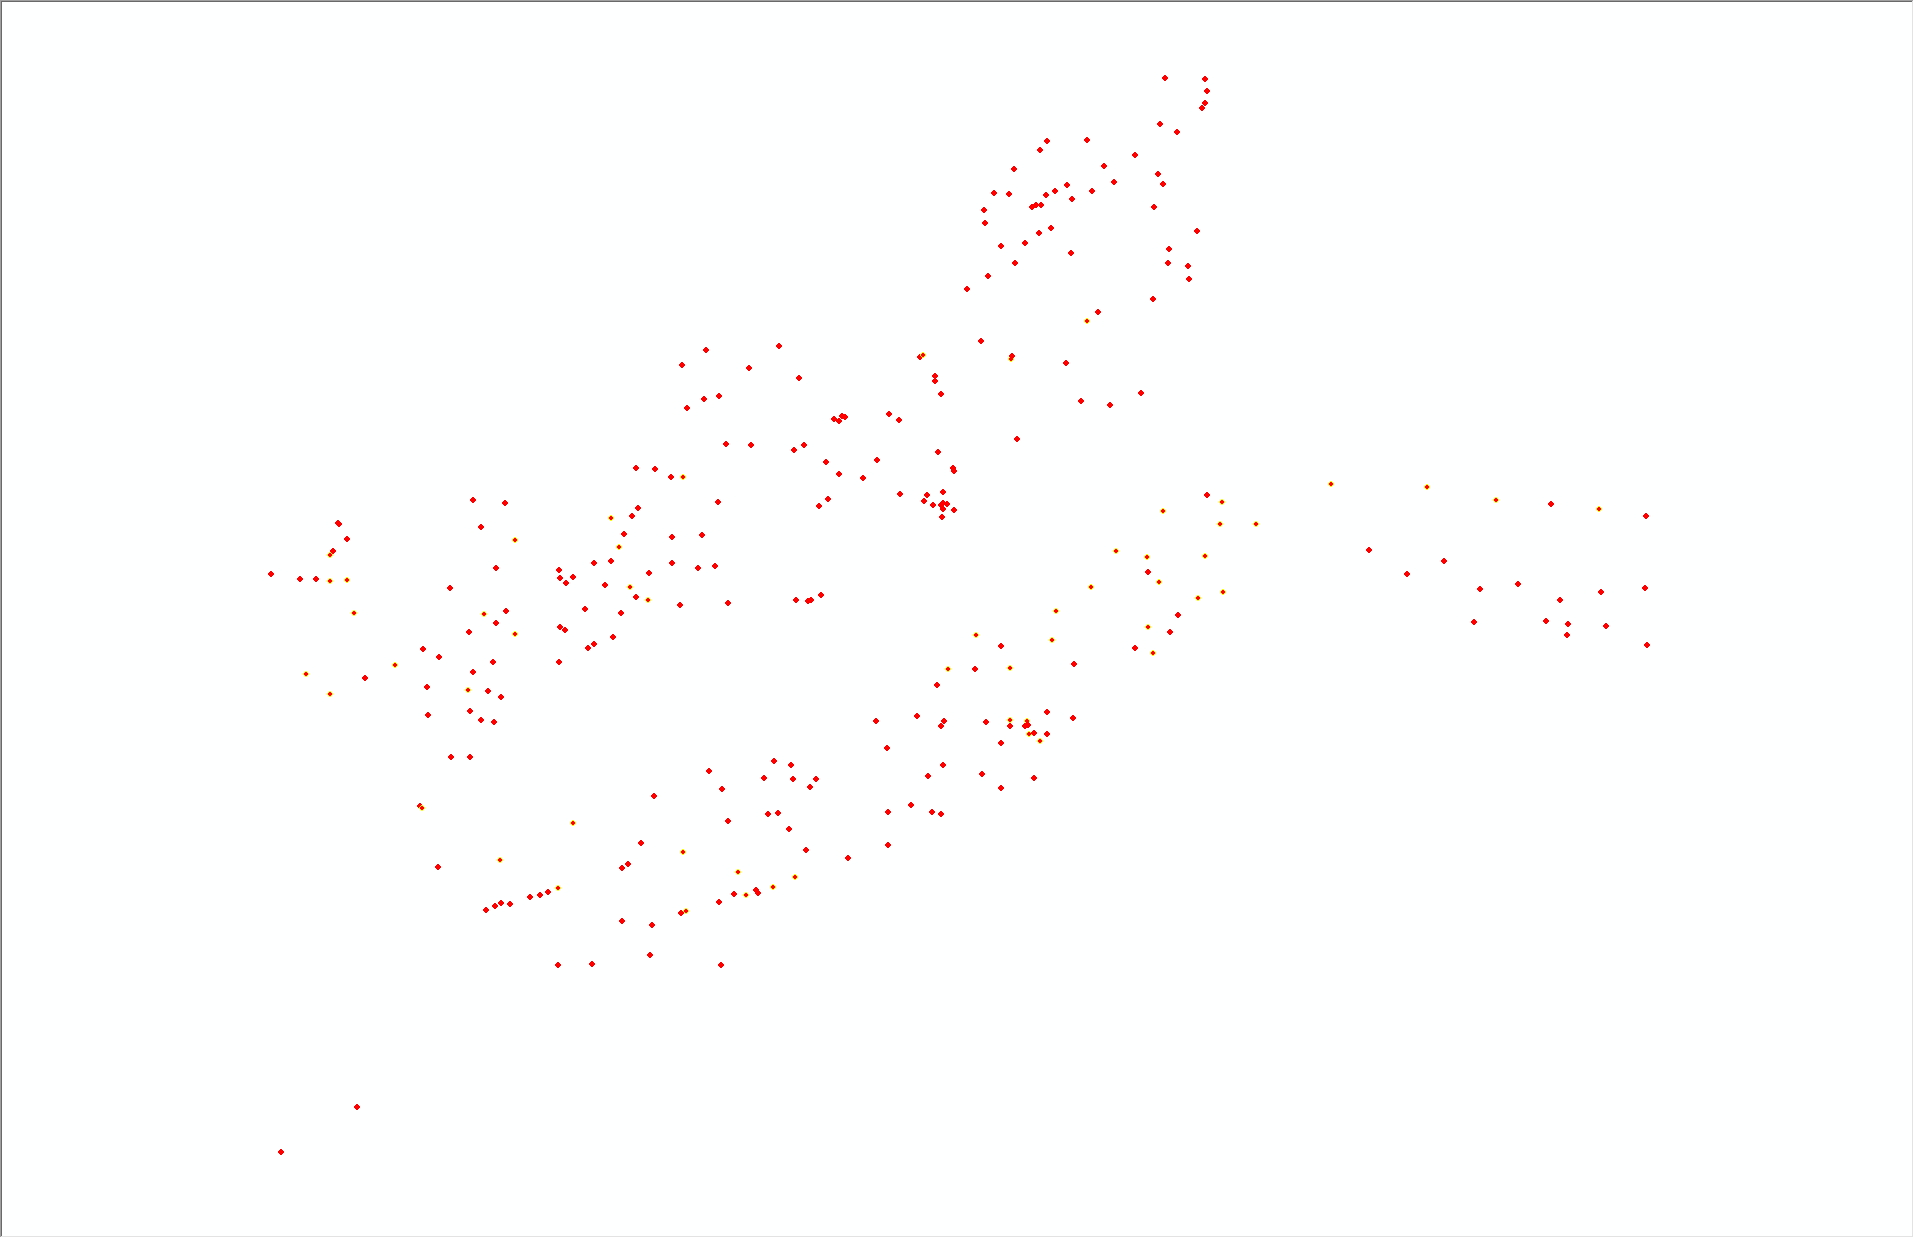
| Minimum: | 41.267740 |
| Maximum: | 41.649430 |
| Units: | Decimal degrees |
| Resolution: | 0.000001 |
| Range of values | |
|---|---|
| Minimum: | -71.096530 |
| Maximum: | -70.457302 |
| Units: | Decimal degrees |
| Resolution: | 0.000001 |
| Range of values | |
|---|---|
| Minimum: | 7.5 |
| Maximum: | 41.7 |
| Units: | meters |
| Range of values | |
|---|---|
| Minimum: | 0 |
| Maximum: | 0 |
| Units: | centimeters |
| Range of values | |
|---|---|
| Minimum: | 2 |
| Maximum: | 2 |
| Units: | centimeters |
| Value | Definition |
|---|---|
| BIG SEABOSS GRAB | sample collected with Van Veen grab sampler on the BIG SEABOSS |
| Range of values | |
|---|---|
| Minimum: | 9 |
| Maximum: | 9 |
| Range of values | |
|---|---|
| Minimum: | 9 |
| Maximum: | 13 |
| Range of values | |
|---|---|
| Minimum: | 2010 |
| Maximum: | 2010 |
| Range of values | |
|---|---|
| Minimum: | 12 |
| Maximum: | 12 |
| Range of values | |
|---|---|
| Minimum: | 15 |
| Maximum: | 15 |
| Range of values | |
|---|---|
| Minimum: | 2010 |
| Maximum: | 2010 |
| Range of values | |
|---|---|
| Minimum: | 16.1516 |
| Maximum: | 461.7900 |
| Units: | grams |
| Resolution: | 0.0001 |
| Range of values | |
|---|---|
| Minimum: | 0 |
| Maximum: | 83.75 |
| Units: | percent |
| Resolution: | 0.01 |
| Range of values | |
|---|---|
| Minimum: | 2.55 |
| Maximum: | 99.88 |
| Units: | percent |
| Resolution: | 0.01 |
| Range of values | |
|---|---|
| Minimum: | 0.03 |
| Maximum: | 73.12 |
| Units: | percent |
| Resolution: | 0.01 |
| Range of values | |
|---|---|
| Minimum: | 0 |
| Maximum: | 33.36 |
| Units: | percent |
| Resolution: | 0.01 |
| Value | Definition |
|---|---|
| CLAYEY SILT | Sediment whose main phase is silt, but with significant clay. |
| GRAVEL | Sediment whose main phase (equal to or greater than 50 percent) is greater than 2 mm. |
| GRAVELLY SEDIMENT | Sediment whose phase is equal to or greater than 10 percent, but less than 50 percent gravel, but with significant other sediment. |
| MUD | Sediment whose main phase is less than 0.062 mm based on visual observation |
| SAND | Sediment whose main phase is less than 2 mm, but greater than or equal to 0.062 mm. |
| SAND SILT CLAY | Sediment with significant (over 20 percent) sand, silt, and clay. |
| SANDY SILT | Sediment whose main phase is silt, but with significant sand. |
| SILTY SAND | Sediment whose main phase is clay, but with significant silt. |
| Range of values | |
|---|---|
| Minimum: | -5.32 |
| Maximum: | 7.36 |
| Units: | phi |
| Resolution: | 0.01 |
| Range of values | |
|---|---|
| Minimum: | -3.91 |
| Maximum: | 7.19 |
| Units: | phi |
| Resolution: | 0.01 |
| Range of values | |
|---|---|
| Minimum: | 0.38 |
| Maximum: | 3.45 |
| Units: | phi |
| Resolution: | 0.01 |
| Range of values | |
|---|---|
| Minimum: | -0.57 |
| Maximum: | 4.81 |
| Units: | unitless |
| Resolution: | 0.01 |
| Range of values | |
|---|---|
| Minimum: | -1.81 |
| Maximum: | 47.04 |
| Units: | unitless |
| Resolution: | 0.01 |
| Range of values | |
|---|---|
| Minimum: | 0 |
| Maximum: | 73.13 |
| Units: | percent |
| Resolution: | 0.01 |
| Range of values | |
|---|---|
| Minimum: | 0 |
| Maximum: | 24.07 |
| Units: | percent |
| Resolution: | 0.01 |
| Range of values | |
|---|---|
| Minimum: | 0 |
| Maximum: | 12.33 |
| Units: | percent |
| Resolution: | 0.01 |
| Range of values | |
|---|---|
| Minimum: | 0 |
| Maximum: | 12.66 |
| Units: | percent |
| Resolution: | 0.01 |
| Range of values | |
|---|---|
| Minimum: | 0 |
| Maximum: | 24.35 |
| Units: | percent |
| Resolution: | 0.01 |
| Range of values | |
|---|---|
| Minimum: | 0.01 |
| Maximum: | 44.03 |
| Units: | percent |
| Resolution: | 0.01 |
| Range of values | |
|---|---|
| Minimum: | 0.06 |
| Maximum: | 83.70 |
| Units: | percent |
| Resolution: | 0.01 |
| Range of values | |
|---|---|
| Minimum: | 0.14 |
| Maximum: | 88.16 |
| Units: | percent |
| Resolution: | 0.01 |
| Range of values | |
|---|---|
| Minimum: | 0.06 |
| Maximum: | 79.16 |
| Units: | percent |
| Resolution: | 0.01 |
| Range of values | |
|---|---|
| Minimum: | 0.01 |
| Maximum: | 74.45 |
| Units: | percent |
| Resolution: | 0.01 |
| Range of values | |
|---|---|
| Minimum: | 0 |
| Maximum: | 15.75 |
| Units: | percent |
| Resolution: | 0.01 |
| Range of values | |
|---|---|
| Minimum: | 0.01 |
| Maximum: | 23.51 |
| Units: | percent |
| Resolution: | 0.01 |
| Range of values | |
|---|---|
| Minimum: | 0.01 |
| Maximum: | 28.5 |
| Units: | percent |
| Resolution: | 0.01 |
| Range of values | |
|---|---|
| Minimum: | 0 |
| Maximum: | 25.79 |
| Units: | percent |
| Resolution: | 0.01 |
| Range of values | |
|---|---|
| Minimum: | 0 |
| Maximum: | 19.23 |
| Units: | percent |
| Resolution: | 0.01 |
| Range of values | |
|---|---|
| Minimum: | 0 |
| Maximum: | 9.97 |
| Units: | percent |
| Resolution: | 0.01 |
| Range of values | |
|---|---|
| Minimum: | 0 |
| Maximum: | 4.16 |
| Units: | percent |
| Resolution: | 0.01 |
Online Links:
Online Links:
Online Links:
Online Links:
Online Links:
Online Links:
| Access_Constraints | None |
|---|---|
| Use_Constraints | Public domain data from the U.S. Government are freely redistributable with proper metadata and source attribution. Please recognize the U.S. Geological Survey as the source of this information. |
| Data format: | A zip file containing the geospatial data in shapefile format and as a comma-delimited text file, and metadata describing the data set of sediment sample locations collected with the SEABOSS. in format Shapefile (version ArcGIS 10.1) Zip file of Esri point shapefile Size: 0.083 |
|---|---|
| Network links: |
https://pubs.usgs.gov/of/2014/1221/GIS/shapefile/BBVS_SedimentSamples.zip https://pubs.usgs.gov/of/2014/1221/html/appendix1.html |
| Media you can order: | DVD-ROM (Density 4.75 Gbytes) (format UDF) |
| Data format: | A comma-delimited text file containing navigation and grain-size analysis data. The first record contains field headings. in format CSV (version CSV file) Comma-delimited file Size: 0.025 |
|---|---|
| Network links: |
https://pubs.usgs.gov/of/2014/1221/GIS/shapefile/BBVS_SedimentSamples.csv https://pubs.usgs.gov/of/2014/1221/html/appendix1.html |
| Media you can order: | DVD-ROM (Density 4.75 Gbytes) (format UDF) |