Online Links:
Online Links:
| Value | Definition |
|---|---|
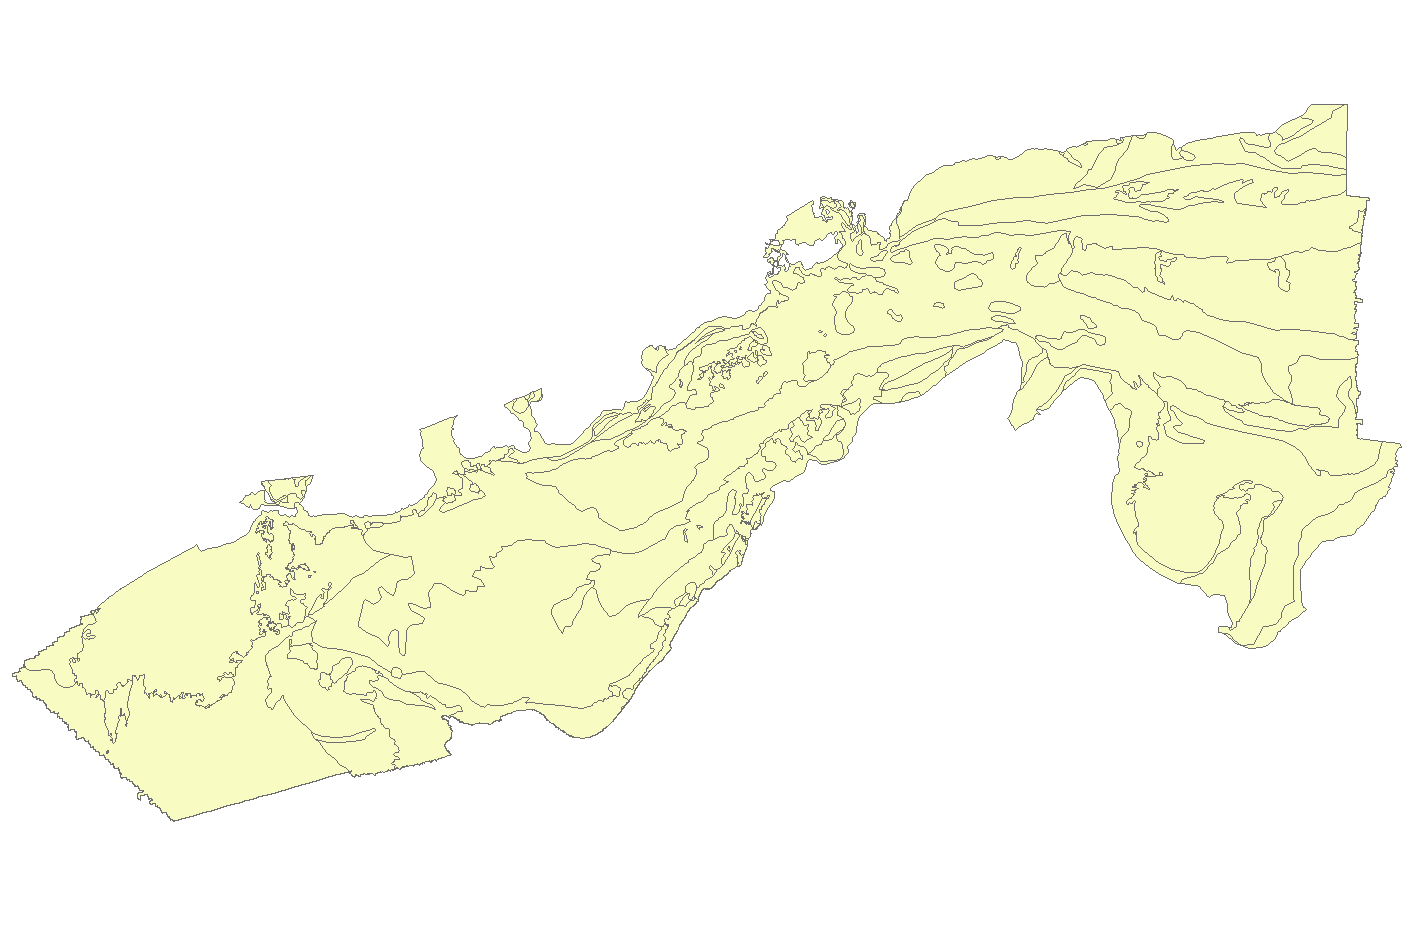
| Rocky Zone | Rocky zones are rugged areas of high bathymetric relief, characterized by fields of mounded boulders and cobble near the terminal moraines, to relatively flat, gravel-covered, and isolated till highs in central portions of the sounds. Water depths range from 1 to 30 m. Although boulders and coarse-grained sediment are found within all physiographic zones defined here, they dominate the sea floor in rocky rones. |
| Nearshore Basin | Nearshore basins are areas of shallow, low relief sea floor adjacent to the mainland and separated from offshore areas by islands and shoals. Water depths range from 0 to 35 m. Along their landward margins, the basin sediment merges with the intertidal zone, often a nearshore ramp, in a gradational contact. |
| Nearshore Ramp | Nearshore ramps are areas of gently sloping sea floor with generally shore-parallel bathymetric contours. Water depths range from 0 to 30 m. This zone is covered by primarily sandy sediment, though patches of cobbles and boulders crop out on the sea floor in places. Nearshore ramps are typically adjacent to arcuate shoreline areas and grade into deeper-water nearshore basin, hardbottom plain, or outer basin zones. |
| Ebb Tidal Delta | Ebb-tidal deltas are lobate sandy shoals found on the side of inlets that form through the interaction of waves and ebbing tidal currents. Water depths range from 1 to 14 m. Ebb-tidal deltas in the study area are located on the soundward sides of several bays located along the south coast of Cape Cod on Nantucket Sound, as well as adjacent to tidal passages between the Elizabeth Islands |
| Hard-Bottom Plains | Hard-bottom plains are mostly low-relief but rough zones of sea floor composed primarily of coarse sands and gravels that are situated adjacent and between the shoal/sand wave zones in the sounds. Water depths range from 4 to 30 m. |
| Outer Basin | Outer basins are low-relief and mostly smooth zones of sea floor located in water depths greater than 30 m. The only outer basin identified in the study area lies beyond the western mouth of Vineyard Sound, on the margin of Rhode Island Sound. The broad depression is characterized by primarily muddy sands |
| Coastal Embayment | Coastal embayments include several small bays and harbors in the vicinity of Woods Hole and along the shorelines of the Elizabeth Islands. |
| Shell Zones | Shell zones are areas that are nearly completely covered by carbonate shells. A portion of sea floor between LHommediue and Hedge Fence shoals in western Nantucket Sound was mapped where high densities of slipper shells (Crepidula fornicata) cover the sea floor. Despite high acoustic backscatter in sidescan-sonar data, sediment samples recovered primarily muddy sediments beneath the shells. The shell zone water depths range from 15 to 18 m. |
| Shoal - Sand Waves | Shoal/sand wave areas are sea-floor zones dominated by linear to sinuous, high relief bedforms (up to 16 m locally) primarily composed of sandy sediments that have been reworked from adjacent glacial deposits by energetic tidal currents. Water depths range from approximately 3 to 30 m. The largest shoals form elongate chains in central portions of the Sounds that geologic and geophysical data suggest are at least partly cored by Pleistocene glacial material, which crops out at the sea floor locally along their lengths. |
| Range of values | |
|---|---|
| Minimum: | 0.000939 |
| Maximum: | 72.066428 |
| Units: | square kilometers |
| Resolution: | 0.000001 |
Online Links:
Online Links:
Online Links:
Online Links:
Online Links:
Online Links:
Online Links:
Online Links:
Online Links:
Online Links:
Online Links:
Online Links:
Online Links:
Online Links:
| Access_Constraints | None |
|---|---|
| Use_Constraints | Public domain data from the U.S. Government are freely redistributable with proper metadata and source attribution. Please recognize the U.S. Geological Survey (USGS) as the source of this information. Additionally, there are limitations associated with qualitative sediment mapping interpretations. Because of the scale of the source geophysical data and the spacing of samples, not all changes in sea floor texture are captured. The data were mapped between 1:5,000 and 1:20,000, but the recommended scale for application of these data is 1:25,000. |
| Data format: | WinZip v. 14.5 file contains qualitatively derived polygons that define sea floor physiographic zones in Vineyard and western Nantucket Sounds, MA and the associated metadata in format Shapefile (version ArcMap 9.3.1) Esri Polygon Shapefile Size: 0.475 |
|---|---|
| Network links: |
https://pubs.usgs.gov/of/2016/1119/GIS_catalog/PhysiographicZones/VineyardNantucketSound_Pzones.zip https://pubs.usgs.gov/of/2016/1119/ofr20161119_data_catalog.html |