Oceanographic and hydrographic monitoring data of a shallow-water placement of dredged sediment in South San Francisco Bay, California, 2023-2025
By Samantha C. McGill, Jessica R. Lacy, Andrew W. Stevens, Rachel M. Allen, Peter Dartnell, Joanne C Thede, Angela C. Tan, and Gerry A. Hatcher
https://doi.org/10.5066/P14D723N
Dates
Published: Aug. 20, 2025
Summary
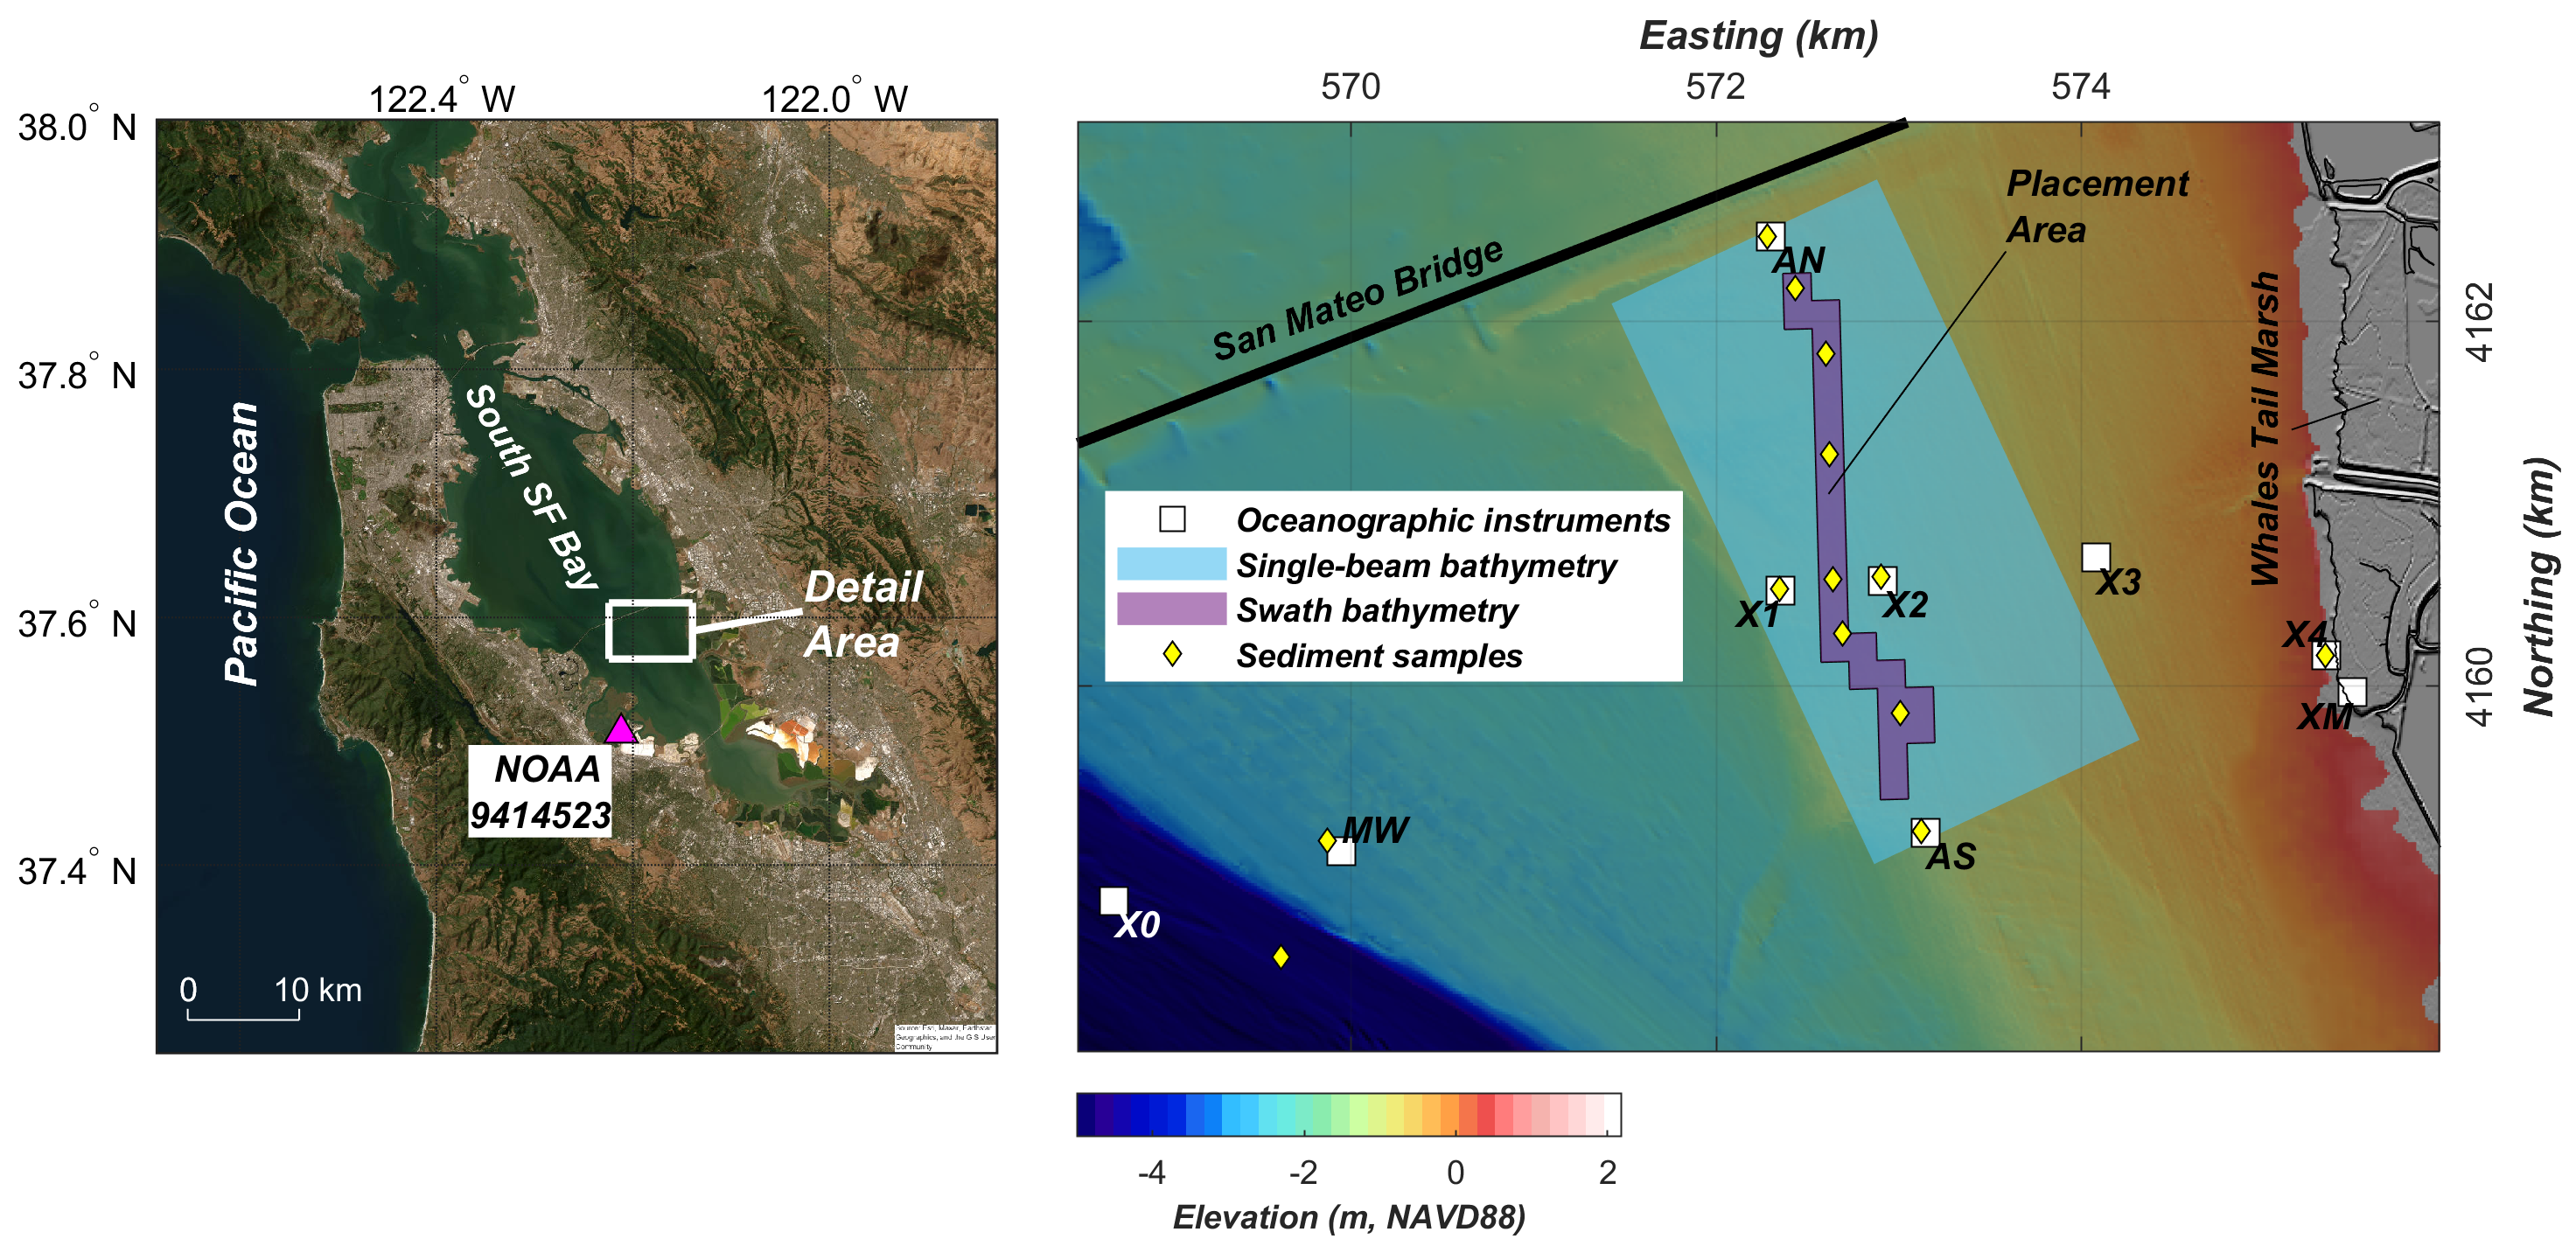
The U.S. Geological Survey Pacific Coastal and Marine Science Center collected oceanographic and hydrographic monitoring data for a pilot project to place dredged sediment in bay shallows to nourish marshes conducted by the US Army Corps of Engineers, San Francisco District. Dredged material was placed in the shallows of South San Francisco Bay during December 2023. Monitoring spanned from 2023 to 2025; data collection started prior to the placement of dredged sediment and continued during and after placement. Oceanographic time-series instruments were deployed along cross-shore and along-shore transects. The cross-shore transect comprised stations located on the marsh, in the intertidal and subtidal shallows, and near the navigational channel that traverses South San Francisco Bay. The along-shore transect stations were located north and south of the placement area. Oceanographic data includes pressure, salinity, temperature, turbidity, wave statistics, currents, suspended particle size distributions, and suspended sediment concentration. Bayfloor bathymetry was surveyed 2 times prior to placement and 7 times following placement. Sediment bed properties were measured and near surface sediment-bed profile images were collected several times during the study. Meteorological observations were collected from November 2023 to February 2025. Information on station location, instrumentation, and measured variables are included in a summary table; additional details are included in metadata files and data attributes.
Mooring (physical oceanography) Data
-
Oceanographic time-series monitoring data of a shallow-water placement of dredged sediment in south San Francisco Bay, California, 2023-2025
Oceanographic and meteorological time-series monitoring data were collected by the U.S. Geological Survey (USGS) Pacific Coastal and Marine Science Center from 2023 to 2025, to monitor a pilot shallow-water placement of dredged sediment project led by the US Army Corps of Engineers San Francisco District. Data were collected at nine stations located in the shallows offshore of Whales Tail Marsh in south San Francisco Bay, CA. Stations were positioned around the placement site of the dredged material. Data were collected prior to, during, and after the sediment was placed. Stations consisted of platforms deployed along 2 transects: one along-shore and one cross-shore. Stations in the cross-shore transect included: XM, located approximately 25 meters from the bay edge on Whales Tail marsh; X4 located slightly offshore of the marsh; X3 just offshore (west) of X4; X2 (same location as XG and XL) east/marsh side of the placement area; X1 western side of the placement area; and X0 just east of the navigational channel. A wave-met buoy MW was close to and slightly east of X0. Along-shore transect platforms included AN and AS, north and south of the placement area, respectively. Data types include pressure, velocity, turbidity, suspended particle size distribution, conductivity, temperature, wave statistics, and wind speed and direction, barometric pressure and air temperature. Data files are grouped by deployment (A-E) then by station name (OR) instrument type, except for data recorded at station X0 and MW, which have their own folders. At several stations there were periods of low water when sensors were no longer submerged, resulting in spurious data. In addition, most instruments experienced some degree of biofouling. Users are advised to assess data quality carefully, and to check the metadata for instrument information, as platform deployment times and data-processing methods varied. Turbidity values (in NTU or volts) can be converted to SSC (in milligrams per liter) via the calibration coefficient (slope value) located in the “Support Files” section below, DMP_Turbidity_to_SSC_calibration_constants.csv. Turbidity data were recorded using either a 1x gain or a 5x gain setting however, all calibration coefficients were obtained using 5x gain data. Therefore, users should refer to the “Deployment Gain Setting” column in the support file to determine the gain setting of the data in use. Data collected at 1x gain must be scaled to 5x gain before comparison with other 5x datasets or conversion to SSC. To convert a sensor from 1x gain to 5x gain, simply multiply the turbidity data by 5. To convert a 1x gain data to SSC, use the following equation: (SSC = 5 * turbidity data * slope), where slope is calibration coefficient obtained from the support file. To convert a sensor that was deployed using a 5x gain setting to SSC, simply multiply the turbidity data by the appropriate slope value from the support file.
Data Files
DMP23_Deployment_A.zip - 1.0 GB - MD5:b50fbb0ea3d35de6b0aecb09b11443e9
DMP23_Deployment_B.zip - 1.6 GB - MD5:a61cd74382269912c94d3b8f1f615344
DMP23_Deployment_C.zip - 1.6 GB - MD5:549bbada229384b07fdd87e14c2def47
DMP23_Deployment_D.zip - 881.8 MB - MD5:209e9135728938fa16d46356dac21269
DMP23_Deployment_E.zip - 825.1 MB - MD5:f7bd5e3c1c2325ea48d3a9d1dd2895c0
DMP23_MW.zip - 105.9 MB - MD5:ef81258688646e1f51fb5b0273cf0c11
DMP23_X0.zip - 22.3 MB - MD5:4314217afb6e388129553da3e9cea403
Other Data Access
Metadata Files
DMP23_timeseries_metadata.xml - 38.2 KB
DMP23_timeseries_metadata.txt - 37.1 KB
Support Files
DMP_Turbidity_to_SSC_calibration_constants.csv - 1.3 KB
DMP23_time_series_file_table.csv - 3.5 KB
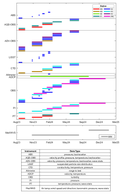 A figure displaying the different instruments and data types collected over the duration of the project.
Sediment Properties Data
-
Properties of sediment collected throughout the strategic placement of dredge material in south San Francisco Bay, California, 2023-2025
Bed sediment samples were collected from several sites within south San Francisco Bay, California, USA. Stations sampled were located within or adjacent to an area defined for strategic sediment placement. These stations were more specifically located either near instrumented stations where time-series data were collected, on/near a mound of placed sediment, or in a channel adjacent to an instrumented station. Time-series data are provided on the home page for this data release. Sediment samples were collected by ship-side push core sampling or subsampling a Gomex box corer with push cores. Push cores, which ranged in total length from 6 to 16 centimeters (cm), were sectioned by depth. The uppermost six sections from each core were 1 cm thick, and the following sections were 2 cm thick. Samples were analyzed for sediment properties including bulk density, particle size distribution, and percent carbon.
Data Files
DMP23_sediment_properties.csv - 359.3 KB - MD5:ed26dbb528a59f270710ab7e11340977
Metadata Files
DMP23_sediment_properties_metadata.xml - 79.6 KB
DMP23_sediment_properties_metadata.txt - 77.8 KB
Turbidity Data
-
Suspended sediment concentrations from water samples collected in south San Francisco Bay, California, 2023-2024
Water samples were collected in south San Francisco Bay between August 2023 and August 2024 to measure suspended sediment concentration. The water samples were collected near USGS instrument platforms (see time-series data page) with a peristaltic pump. The suspended sediment concentrations of the samples were determined at the USGS Pacific Coastal and Marine Science Center sediment lab. Measured suspended sediment concentrations were used to calculate calibration coefficients that can be used to convert time series of turbidity data to time series of suspended sediment concentrations. These calibration coefficients can be found in file: DMP23_Turbidity_to_SSC_calibration_constants.csv, one of the support files for the time-series data section of this data release.
Data Files
DMP23_SSC.csv - 15.5 KB - MD5:8290833288260e007a345341fe15eaf8
Metadata Files
DMP23_SSC_metadata.xml - 18.6 KB
DMP23_SSC_metadata.txt - 18.2 KB
Digital Elevation Model (DEM) Data
-
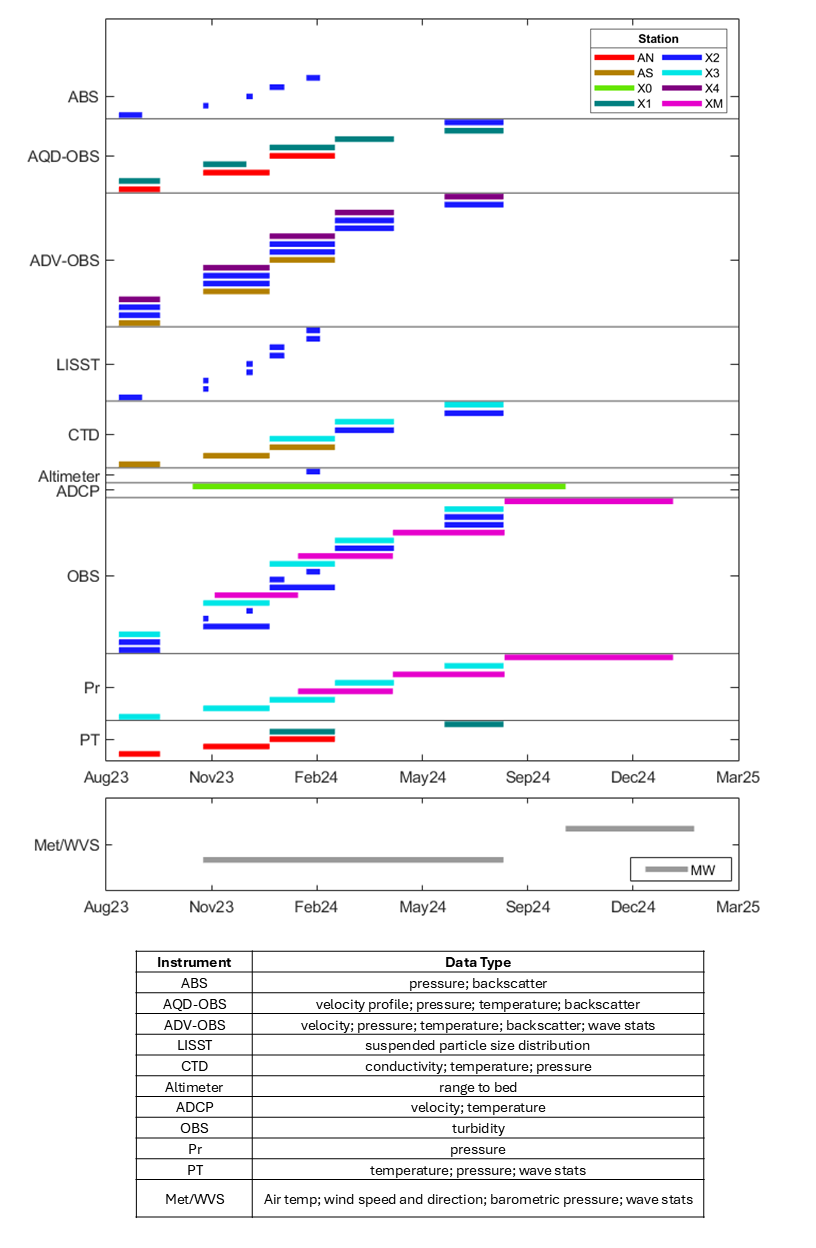
Gridded bathymetric data from repeat surveys of south San Francisco Bay, California, 2023-2025
Repeat bathymetric surveys were performed between October 2023 and January 2025 (U.S. Geological Survey field activity number 2023-655-FA) in the shallows of south San Francisco Bay, California using either a 234 kHz SwathPlus interferometric sonar or 200 kHz single beam sonar system. Gridded bathymetric surfaces derived from the processed single beam sonar data were produced with using linear interpolation. The bathymetric datasets are provided in GeoTIFF format.
Data Files
DMP23_bathymetric_surfaces.zip - 51.3 MB - MD5:820ab8a145949484cc3cdf03e6ebf684
Metadata Files
DMP23_bathymetric_surfaces_metadata.xml - 21.1 KB
DMP23_bathymetric_surfaces_metadata.txt - 20.7 KB
 Elevations derived from each bathymetry survey.
Photo Data
-
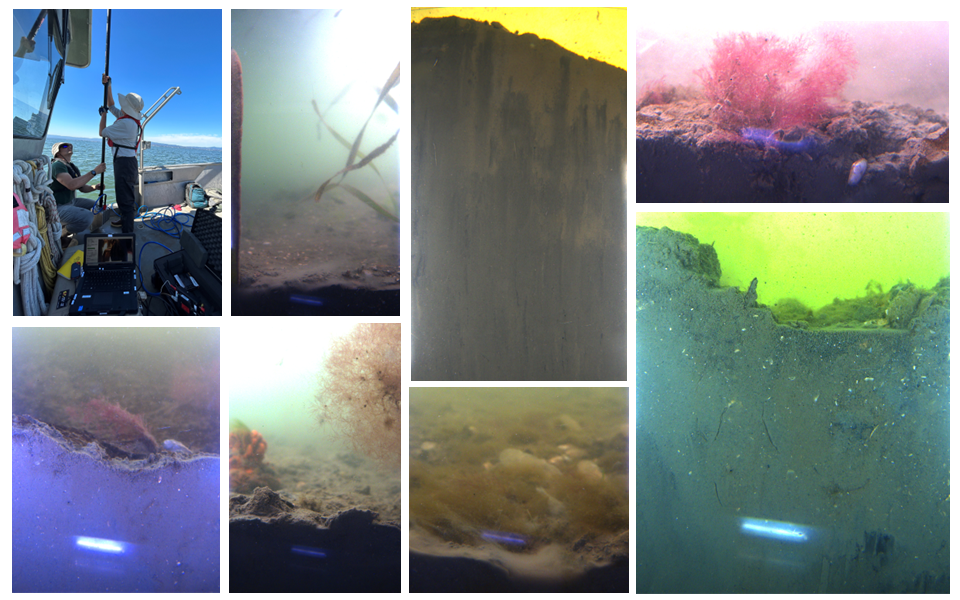
In situ sediment profile images from south San Francisco Bay, California, 2023-2025
In situ images of the sediment-water interface and sediment profiles were collected to characterize the top layer of the sediment bed (less than 15 cm sediment depth) prior to dredged material placement and post dredge material placement in south San Francisco Bay, California. Several sites within the placement area, as well as sites outside of the placement area, and near time-series stations were collected. The photos were acquired during four separate trips: August 2023 (pre-placement), October 2023 (pre-placement), January 2023 (post-placement), and February (greater than 1 year post-placement). The sediment profile imaging system consisted of a Blackfly S Board-level BFS-GE-50S5C0BD2 camera that incorporates a Sony IMX264 sensor and has an m12-mount type wide-angle 4.4 mm lens. The resulting field of view was approximately 7x15 cm at the window, with a resolution of 0.0667 mm per pixel when the vertically (portrait) oriented window of the housing was pushed into the sediment bed. The camera was secured horizontally in Sediment Profile Imaging (SPI) camera waterproof housing from OceanInstruments, which was lowered to the bay floor at the different stations and pushed from above into the sediment bed using a rigidly attached pole. The images captured using the system show a profile view which includes a surface view of the sediment bed where the window was above the water-sediment interface, and/or a high-resolution sediment profile where the window extended vertically down into the sediment bed and was flush with the sediment. The maximum depth below the water-sediment interface recorded by the sediment profile imaging camera was approximately 15 cm.
Data Files
In situ sediment bed images from South San Francisco Bay, California, 2023-2025
Metadata Files
 Multiple images of the bed in south San Francisco Bay captured by the camera as well as a photograph of the camera used to acquire bay floor images and the camera system setup.
Sidescan Data
-
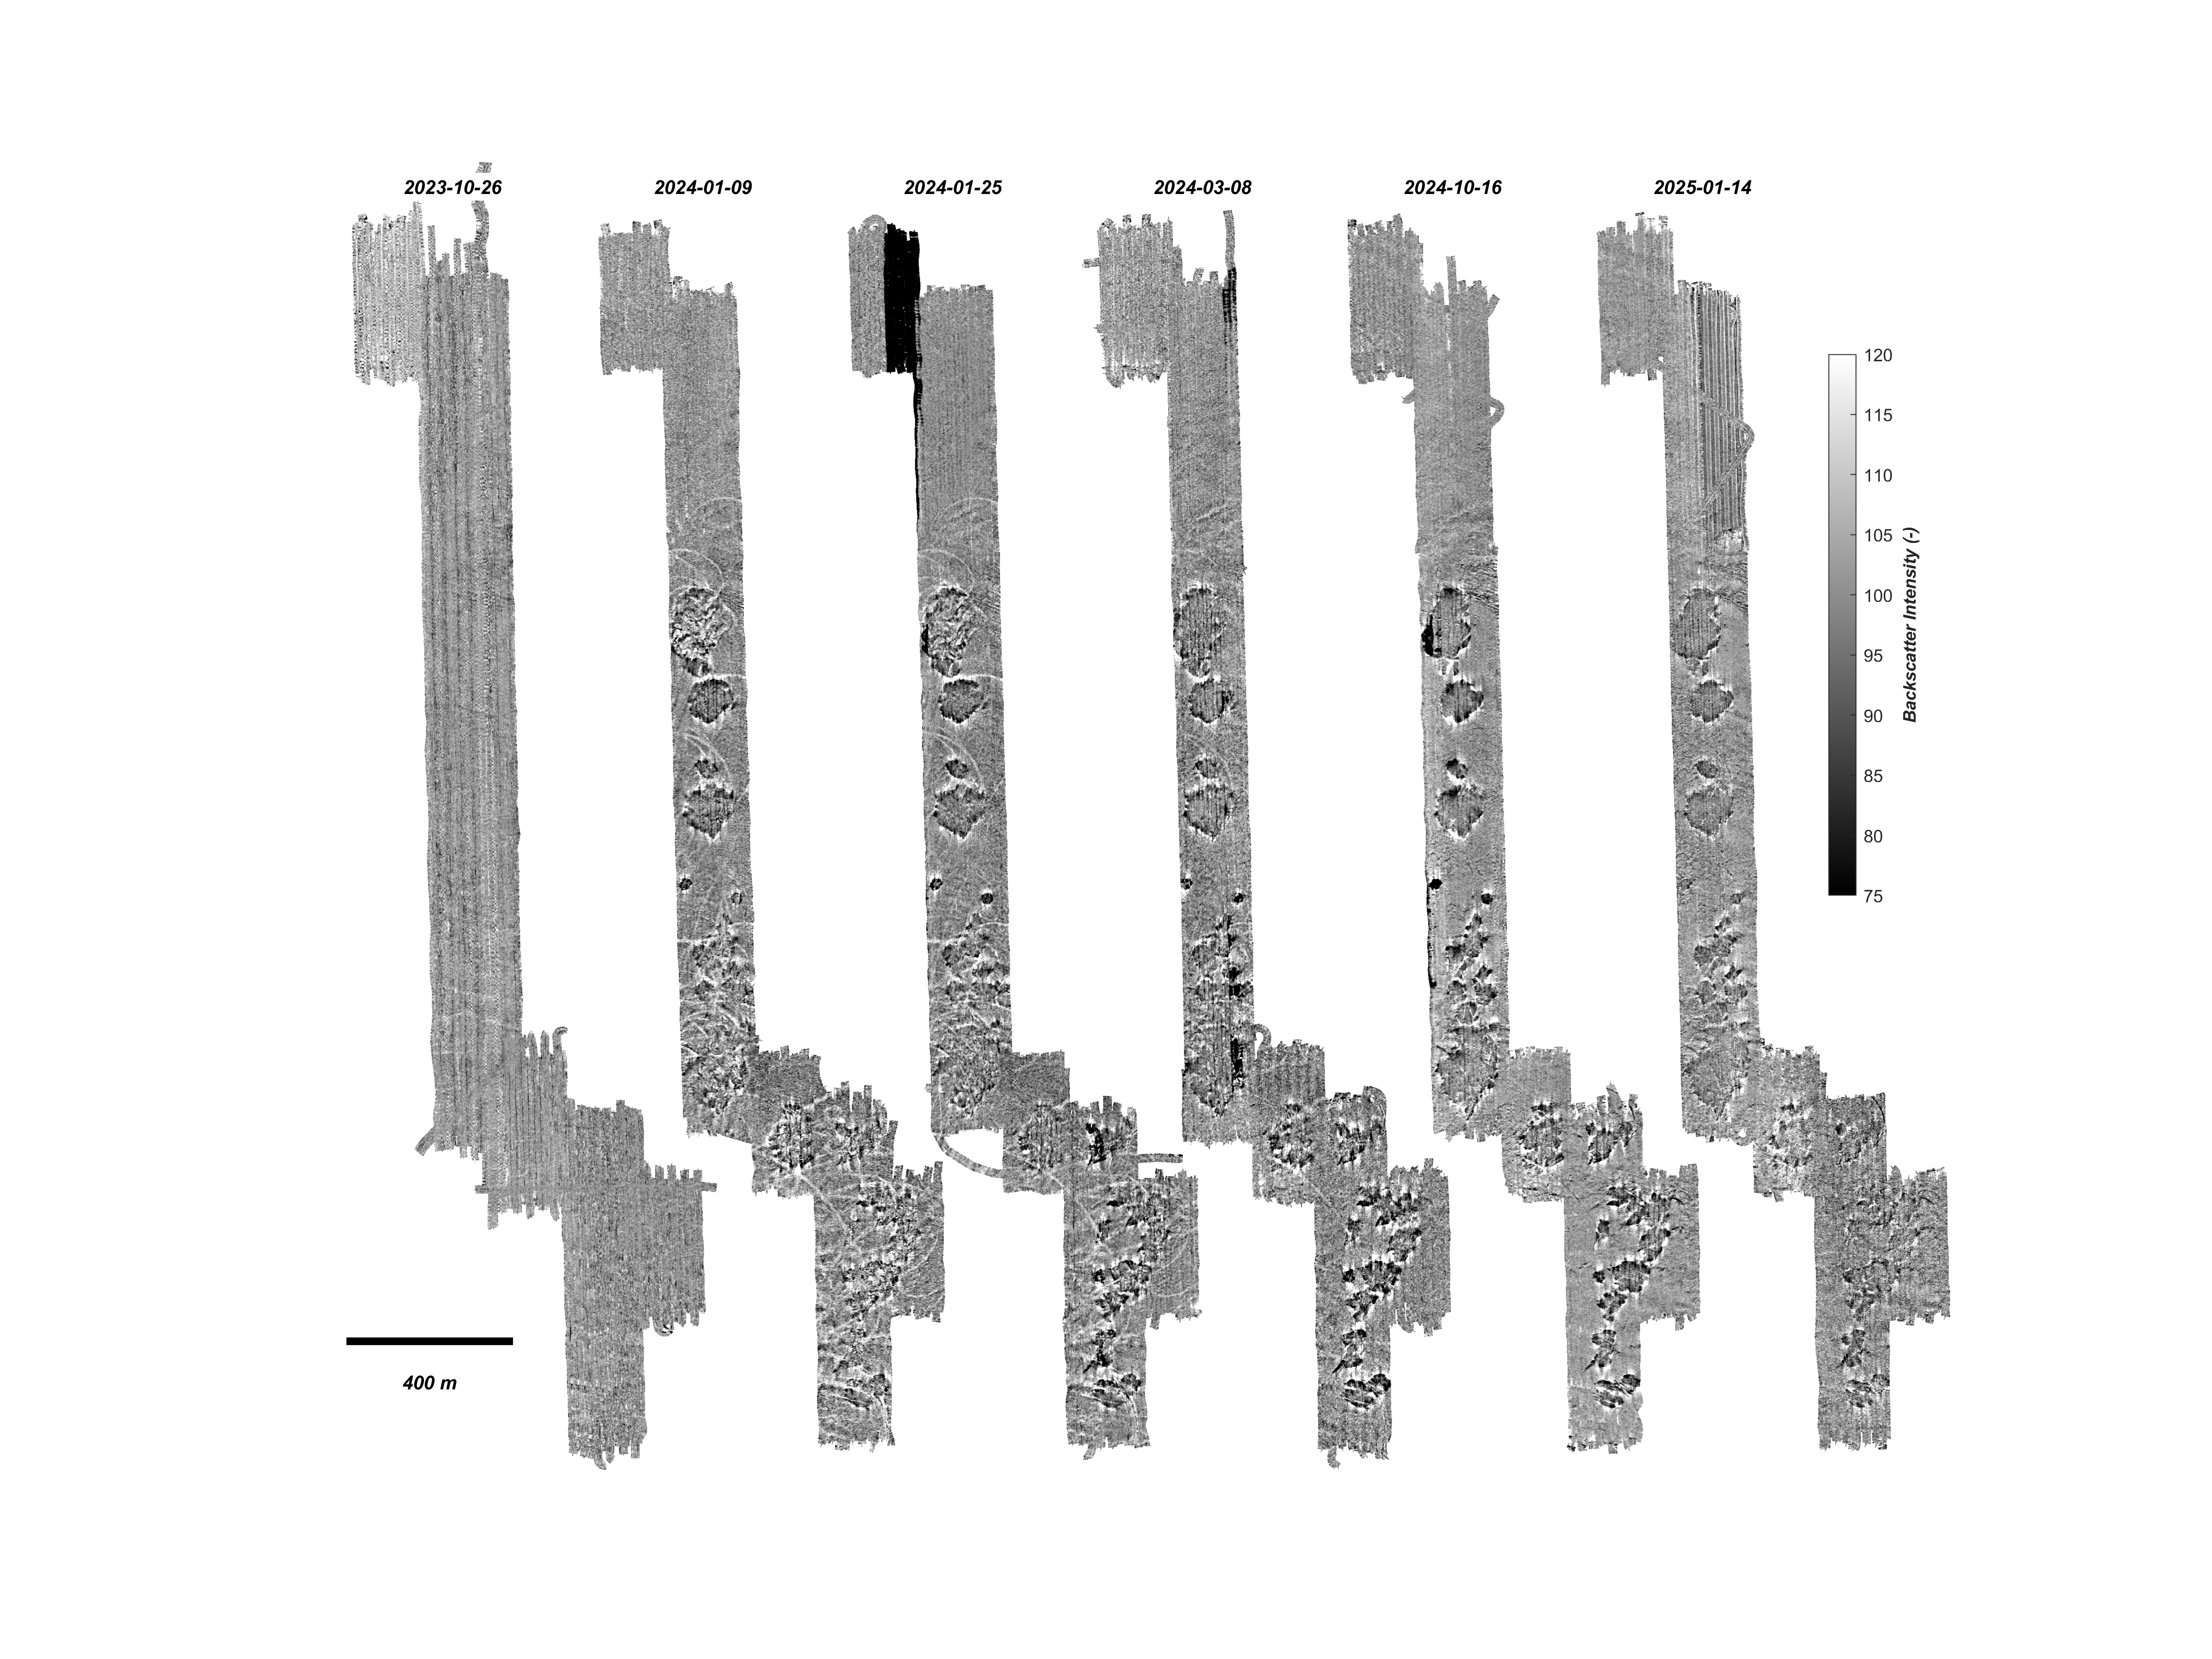
Acoustic-backscatter data from repeat side-scan sonar surveys of south San Francisco Bay, California, 2023-2025
Acoustic-backscatter data were collected with a 234 kHz SwathPlus interferometric side-scan sonar during repeat bathymetric surveys of south San Francisco Bay, California between 2023 and 2025. Data were collected and processed by the U.S. Geological Survey (USGS), Pacific Coastal and Marine Science Center (PCMSC) with fieldwork activity number 2023-655-FA. Data are provided as a GeoTIFF images.
Data Files
DMP23_backscatter_intensity.zip - 5.1 MB - MD5:5d42bc2995e109dcc8abceed6458f7c9
Metadata Files
DMP23_backscatter_intensity_metadata.xml - 15.2 KB
DMP23_backscatter_intensity_metadata.txt - 14.8 KB
 Maps showing acoustic backscatter for each SwathPlus survey.
Suggested Citation
McGill, S.C., Lacy, J.R., Stevens, A.W., Allen, R.M., Dartnell, P., Thede, J.C., Tan, A.C., and Hatcher, G.A., 2025, Hydrodynamic, bathymetric, and sediment transport data spanning dredge material placement in south San Francisco Bay, California, 2023-2025: U.S. Geological Survey data release, https://doi.org/10.5066/P14D723N.
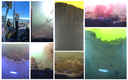
Overview Image