Ocean wave time-series data simulated with a global-scale numerical wave model under the influence of historical and projected CMIP6 wind and sea ice fields (ver. 2.0, October 2024)
By Li H. Erikson, Liv M. Herdman, Chris Flanary, Anita C. Engelstad, Prasad Pusuluri, Patrick L. Barnard, Curt D. Storlazzi, Michael W. Beck, Borja G. Reguero, and Kai A. Parker
https://doi.org/10.5066/P9KR0RFM
Dates
Published: July 7, 2022
Last Revised: Oct. 26, 2024 (ver. 2.0)
Summary
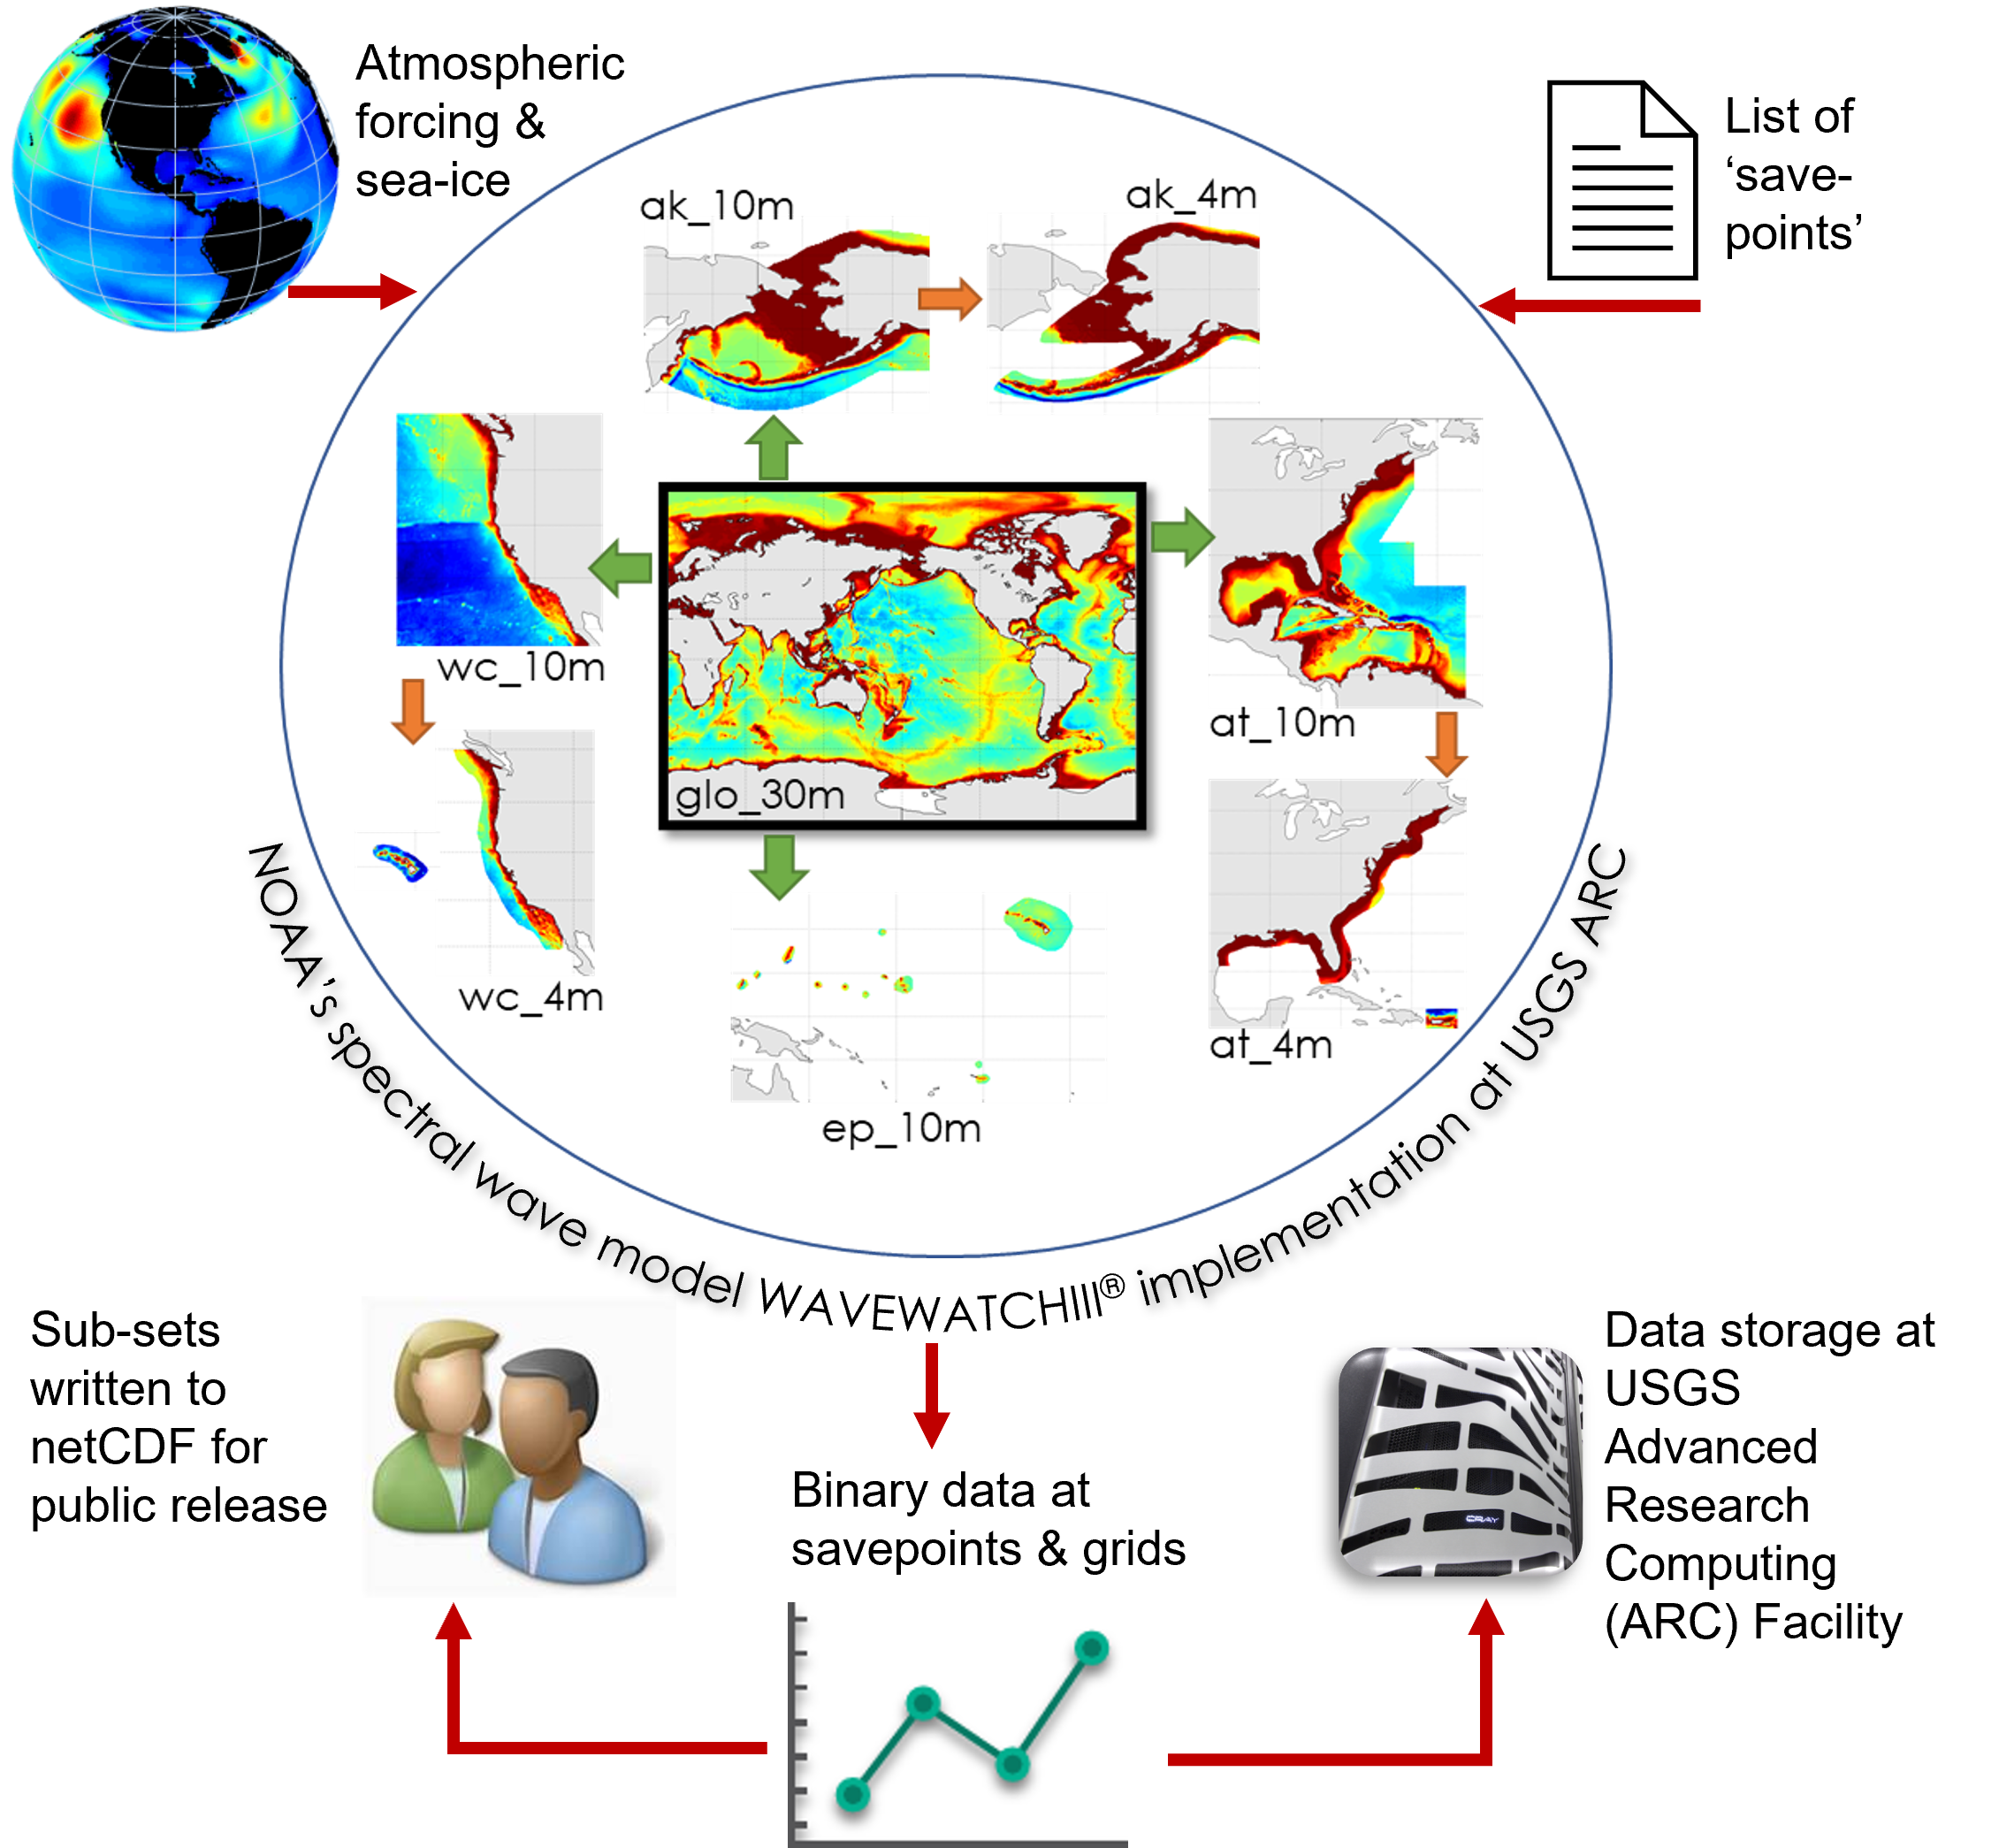
Hourly time-series of waves at the 20m, 50m, and 100m isobaths, along all U.S. open coasts for the historical (1979-2014) and projected (2020-2050) period: Those data (estimates of historical and long-term future conditions) were developed by running the National Oceanic and Atmospheric Administration’s (NOAA) WaveWatch3 wave model forced with winds and sea ice extents from four separate high-resolution global climate models (GCMs) of the 6th generation intercomparison project (CMIP6).
Wave Data
-
Ocean wave time-series data along the U.S. West Coast and surrounding Hawai’i simulated with a global-scale numerical wave model under the influence of CMIP6 wind and sea ice fields (ver. 2.0, October 2024)
This dataset presents historical (1979-2014) and projected (2020-2050) hourly time-series of wave heights, wave periods, incident wave directions, and directional spreading at distinct points along the U.S. West Coast and surrounding Hawai’i. The time-series were developed by running the National Oceanic and Atmospheric Administration’s (NOAA’s) WAVEWATCHIII model. Wind and sea-ice fields from seven different Global Climate or General Circulation Models from the CMIP6 High-Resolution Model Intercomparison Project were used to simulate waves across the globe at a 0.5-degree resolution (approximately 50 km, depending on latitude) and further downscaled to 10- (approximately 18 km) and 4-arc-minute (approximately 7 km) model grids. Point model output data extracted from NOAA’s 4 arc-minute grid for the U.S. West Coast and Hawai’i (wc_4m) are provided herein.
Data Files
WavePnts_CMCC_wc_4m_Fut.nc - 3.6 GB
WavePnts_CMCC_wc_4m_His.nc - 4.2 GB
WavePnts_CNRM_wc_4m_Fut.nc - 3.6 GB
WavePnts_CNRM_wc_4m_His.nc - 4.2 GB
WavePnts_ECEarth_wc_4m_Fut.nc - 3.6 GB
WavePnts_ECEarth_wc_4m_His.nc - 4.2 GB
WavePnts_GFDL_wc_4m_Fut_LimitedUse.nc - 3.6 GB
WavePnts_GFDL_wc_4m_His.nc - 4.2 GB
WavePnts_HadGemHH_wc_4m_Fut.nc - 3.6 GB
WavePnts_HadGemHH_wc_4m_His.nc - 4.2 GB
WavePnts_HadGemHM_wc_4m_Fut.nc - 3.6 GB
WavePnts_HadGemHM_wc_4m_His.nc - 4.2 GB
WavePnts_HadGemSST_wc_4m_Fut.nc - 3.6 GB
WavePnts_HadGemSST_wc_4m_His.nc - 4.2 GB
Metadata Files
WavePnts_metadata_wc_4m.xml - 66.4 KB
WavePnts_metadata_wc_4m.txt - 64.5 KB
 Water depth at model savepoints (meters)
 -
Ocean wave time-series data along the Alaska coast simulated with a global-scale numerical wave model under the influence of CMIP6 wind and sea ice fields (ver. 2.0, October 2024)
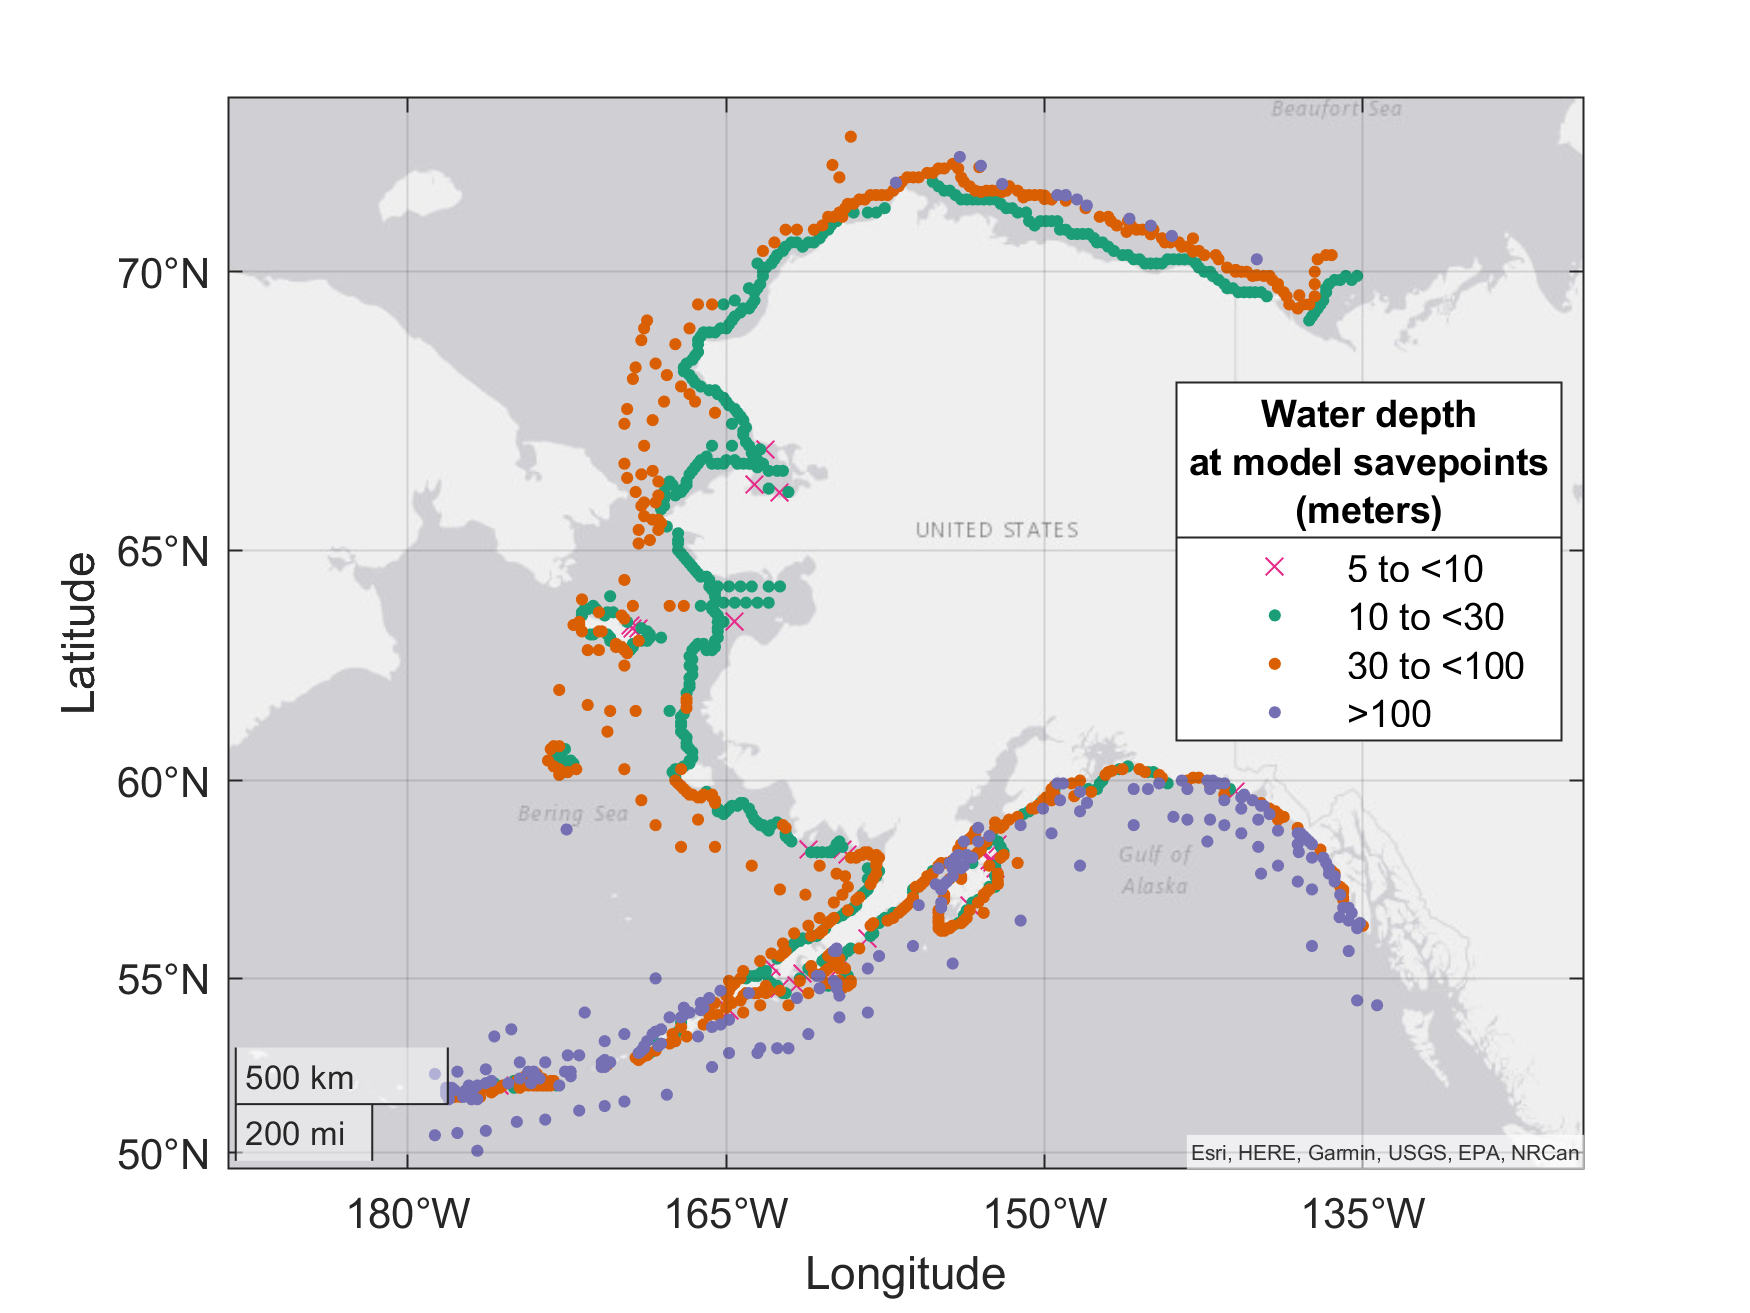
This dataset presents historical (1979-2014) and projected (2020-2050) hourly time-series of wave heights, wave periods, incident wave directions and directional spreading at distinct points along the open coast of Alaska. The time-series were developed by running the National Oceanic and Atmospheric Administration’s (NOAA’s) WAVEWATCHIII model. Wind and sea ice fields from seven different Global Climate or General Circulation Models from the CMIP6 High-Resolution Model Intercomparison Project were used to simulate waves across the globe at a 0.5-degree resolution (approximately 50 kms, depending on latitude) and further downscaled to 10- (approximately 18 kilometer) and 4-arc-minute (approximately 7 kilometer) model grids. Point model output data extracted from NOAA’s 4-arc-minute grid for Alaska (ak_4m) are provided herein.
Data Files
WavePnts_CMCC_ak_4m_Fut.nc - 7.7 GB
WavePnts_CMCC_ak_4m_His.nc - 8.9 GB
WavePnts_CNRM_ak_4m_Fut.nc - 7.7 GB
WavePnts_CNRM_ak_4m_His.nc - 8.8 GB
WavePnts_ECEarth_ak_4m_Fut.nc - 7.7 GB
WavePnts_ECEarth_ak_4m_His.nc - 8.9 GB
WavePnts_GFDL_ak_4m_Fut_LimitedUse.nc - 7.6 GB
WavePnts_GFDL_ak_4m_His.nc - 8.8 GB
WavePnts_HadGemHH_ak_4m_Fut.nc - 7.8 GB
WavePnts_HadGemHH_ak_4m_His.nc - 8.9 GB
WavePnts_HadGemHM_ak_4m_Fut.nc - 7.7 GB
WavePnts_HadGemHM_ak_4m_His.nc - 8.9 GB
WavePnts_HadGemSST_ak_4m_Fut.nc - 7.8 GB
WavePnts_HadGemSST_ak_4m_His.nc - 8.9 GB
Metadata Files
WavePnts_metadata_ak_4m.xml - 66.8 KB
WavePnts_metadata_ak_4m.txt - 64.9 KB
 Water depth at model savepoints (meters)
 -
Ocean wave time-series data surrounding Hawai’i and U.S. territories in the Pacific Ocean simulated with a global-scale numerical wave model under the influence of CMIP6 wind and sea ice fields (ver. 2.0, October 2024)
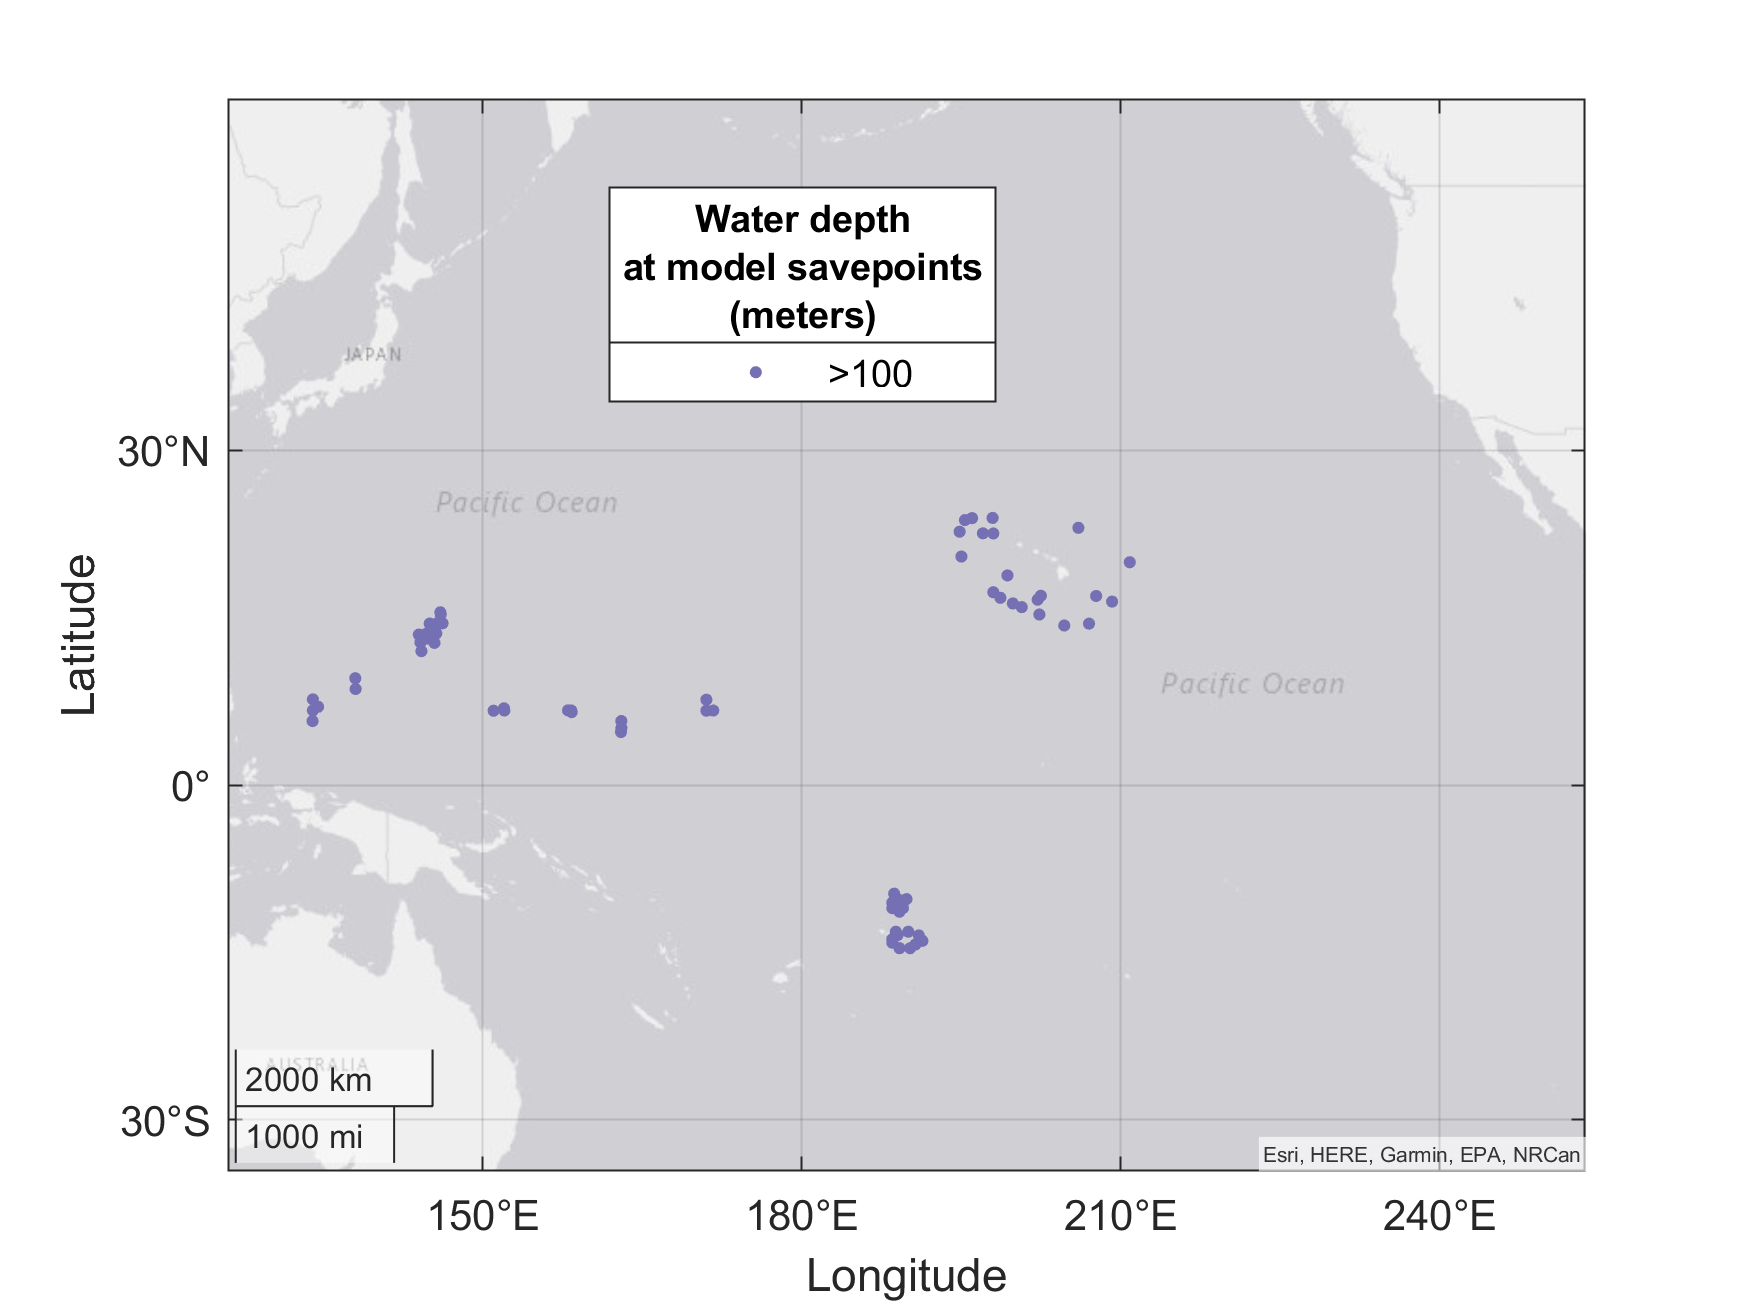
This dataset presents historical (1979-2014) and projected (2020-2050) hourly time-series of wave heights, wave periods, incident wave directions, and directional spreading at distinct points surrounding Hawai’i and U.S. territories in the Pacific Ocean. The time-series were developed by running the National Oceanic and Atmospheric Administration’s (NOAA’s) WAVEWATCHIII model. Wind and sea ice fields from seven different Global Climate or General Circulation Models from the CMIP6 High-Resolution Model Intercomparison Project were used to simulate waves across the globe at a 0.5-degree resolution (approximately 50 kms, depending on latitude) and further downscaled to 10- (approximately 18 kilometer) and 4-arc-minute (approximately 7 kilometer) model grids. Point model output data extracted from NOAA’s 10-arc-minute grid for Hawai’i and U.S. territories in the Pacific Ocean (ep_10m) are provided herein.
Data Files
WavePnts_CMCC_ep_10m_Fut.nc - 527.7 MB
WavePnts_CMCC_ep_10m_His.nc - 612.8 MB
WavePnts_CNRM_ep_10m_Fut.nc - 527.6 MB
WavePnts_CNRM_ep_10m_His.nc - 612.7 MB
WavePnts_ECEarth_ep_10m_Fut.nc - 527.7 MB
WavePnts_ECEarth_ep_10m_His.nc - 612.8 MB
WavePnts_GFDL_ep_10m_Fut.nc - 527.6 MB
WavePnts_GFDL_ep_10m_His.nc - 612.7 MB
WavePnts_HadgemHH_ep_10m_Fut.nc - 527.6 MB
WavePnts_HadGemHH_ep_10m_His.nc - 612.7 MB
WavePnts_HadGemHM_ep_10m_Fut.nc - 527.7 MB
WavePnts_HadGemHM_ep_10m_His.nc - 612.7 MB
WavePnts_HadgemSST_ep_10m_Fut.nc - 527.6 MB
WavePnts_HadgemSST_ep_10m_His.nc - 612.6 MB
Metadata Files
WavePnts_metadata_ep_10m.xml - 65.9 KB
WavePnts_metadata_ep_10m.txt - 64.0 KB
 Water depth at model savepoints (meters)
 -
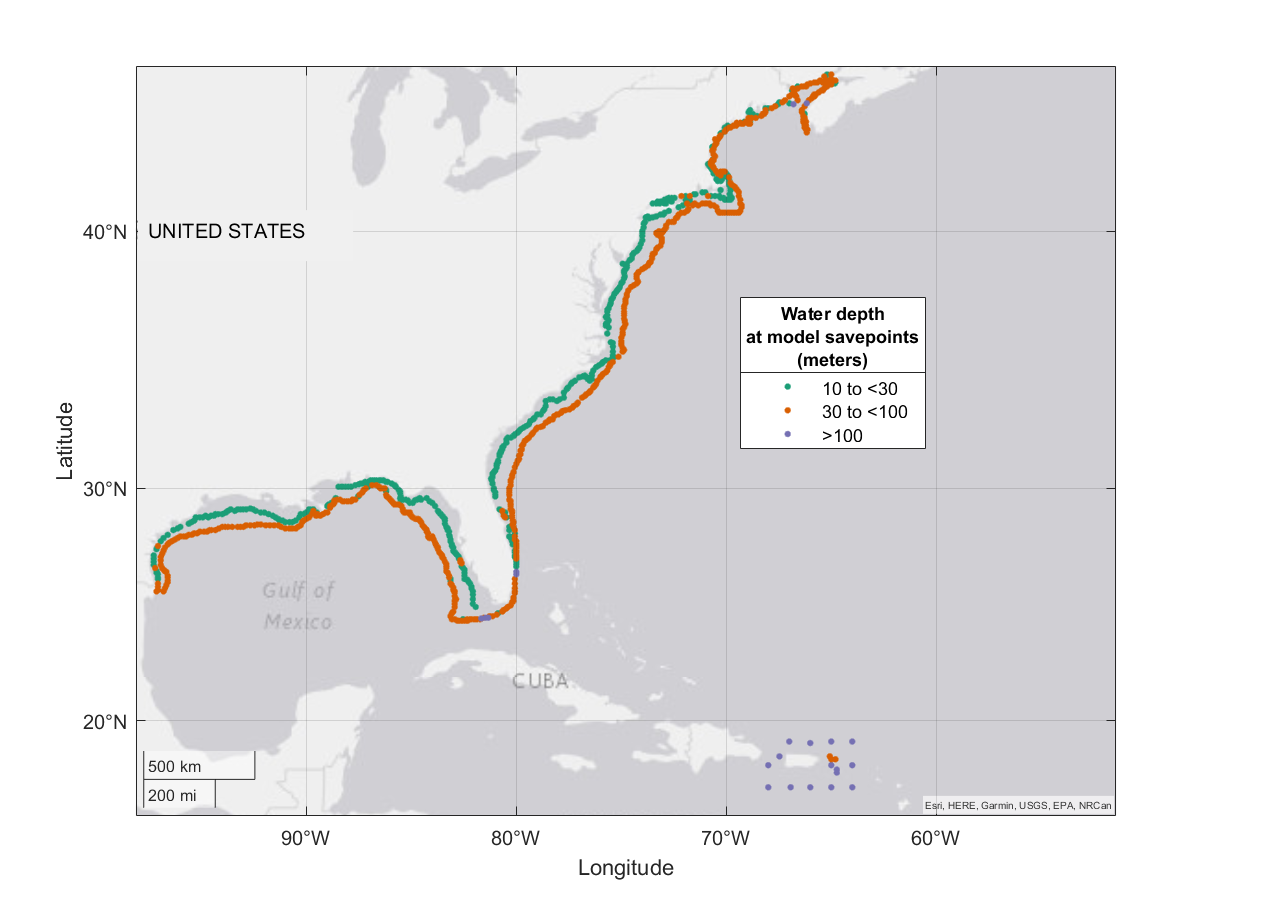
Ocean wave time-series data along the U.S. Atlantic, Gulf of Mexico, and Puerto Rico coasts simulated with a global-scale numerical wave model under the influence of CMIP6 wind and sea ice fields (ver. 2.0, October 2024)
This dataset presents historical (1979-2014) and projected (2020-2050) hourly time-series of wave heights, wave periods, incident wave directions, and directional spreading at distinct points along the U.S. Atlantic, Gulf of Mexico, and Puerto Rico. The time-series were developed by running the National Oceanic and Atmospheric Administration’s (NOAA’s) WAVEWATCHIII model. Wind and sea ice fields from seven different Global Climate or General Circulation Models from the CMIP6 High-Resolution Model Intercomparison Project were used to simulate waves across the globe at a 0.5-degree resolution (approximately 50 kms, depending on latitude) and further downscaled to 10- (approximately 18 km) and 4-arc-minute (approximately 7 km) model grids. Point model output data extracted from NOAA’s 4-arc-minute grid for the Gulf of Mexico and NW Atlantic (at_4m) are provided herein.
Data Files
WavePnts_CMCC_at_4m_Fut.nc - 6.5 GB
WavePnts_CMCC_at_4m_His.nc - 7.5 GB
WavePnts_CNRM_at_4m_Fut.nc - 6.5 GB
WavePnts_CNRM_at_4m_His.nc - 7.5 GB
WavePnts_ECEarth_at_4m_Fut.nc - 6.5 GB
WavePnts_ECEarth_at_4m_His.nc - 7.5 GB
WavePnts_GFDL_at_4m_Fut.nc - 6.5 GB
WavePnts_GFDL_at_4m_His.nc - 7.5 GB
WavePnts_HadGemHH_at_4m_Fut.nc - 6.5 GB
WavePnts_HadGemHH_at_4m_His.nc - 7.5 GB
WavePnts_HadGemHM_at_4m_Fut.nc - 6.5 GB
WavePnts_HadGemHM_at_4m_His.nc - 7.5 GB
WavePnts_HadGemSST_at_4m_Fut.nc - 6.5 GB
WavePnts_HadGemSST_at_4m_His.nc - 7.5 GB
Metadata Files
WavePnts_metadata_at_4m.xml - 66.5 KB
WavePnts_metadata_at_4m.txt - 64.6 KB
 Water depth at model savepoints (meters)

Supplemental Files
- VersionHistory_P9KR0RFM.txt - 4.2 KB
Suggested Citation
Erikson, L.H., Herdman, L., Flanary, C., Engelstad, A., Pusuluri, P., Barnard, P.L., Storlazzi, C.D., Beck, M., Reguero, B., Parker, K., 2022, Ocean wave time-series data simulated with a global-scale numerical wave model under the influence of projected CMIP6 wind and sea ice fields (ver. 2.0, October 2024): U.S. Geological Survey data release, https://doi.org/10.5066/P9KR0RFM.
Revision History
First release: 2022
Revised: October 2024 (ver. 2.0)
Changes in Version 2.0
"We would like to add data for historical CMIP6 wind and sea ice fields to the existing data tabs (e.g. add 'WavePnts_MODEL_wc_4m_His.nc files for each model under the 'Ocean wave time-series data along the U.S. West Coast and surrounding Hawai’i simulated with a global-scale numerical wave model under the influence of CMIP6 wind and sea ice fields' tab)
The file format is the same as for the already published data. The methods did not change. We will have to adjust/expand the metadata."
Overview Image