Survey tracklines of swath bathymetry collected by the U.S. Geological Survey in Moultonborough Bay, Lake Winnipesaukee, New Hampshire in 2005 (Geographic, WGS 84, Esri polyline shapefile, 2005-004-FA_BATHYTRK.SHP)

Metadata also available as - [Outline] - [Parseable text] - [XML]

Frequently anticipated questions:


What does this data set describe?

Title:
Survey tracklines of swath bathymetry collected by the U.S. Geological Survey in Moultonborough Bay, Lake Winnipesaukee, New Hampshire in 2005 (Geographic, WGS 84, Esri polyline shapefile, 2005-004-FA_BATHYTRK.SHP)
Abstract:
In freshwater bodies of New Hampshire, the most problematic aquatic invasive plant species is Myriophyllum heterophyllum or variable leaf water-milfoil. Once established, variable leaf water-milfoil forms dense beds that can alter the limnologic characteristics of a waterbody, impacting natural lacustrine communities and their habitats. Variable leaf water-milfoil infestations also disrupt recreational uses of waterbodies and have negatively affected swimming, boating, fishing, and property values in and around several lakes and ponds in New Hampshire.
In 1965, Moultonborough Bay, Lake Winnipesaukee became the first waterbody in New Hampshire where variable leaf water-milfoil was observed. Variable leaf water-milfoil is native to the Southeastern and Midwestern areas of the United States where more alkaline waters appear to limit the growth of this plant. Outside its native range, however, it adapts well to the relatively acidic, low-alkalinity, and nutrient-poor conditions of oligotrophic lakes and bays similar to Moultonborough Bay.
In 2005, the New Hampshire Department of Environmental Services (NHDES) collaborated with the U.S. Geological Survey to investigate the distribution (presence and density) of variable leaf water-milfoil in Moultonborough Bay. This study utilized geophysical systems and conventional water-quality measurements to identify lake-floor environments that may provide suitable habitat for the establishment and growth of variable leaf water-milfoil. The results of the study are intended to assist resource managers in federal and state agencies by providing methods for detecting variable leaf water-milfoil and for identifying areas susceptible to infestation. Ultimately, this information may lead to early detection, prevention, and more effective mitigation strategies.
Field activity information for this cruise is available on-line through the U.S. Geological Survey Coastal and Marine Geoscience Data System https://cmgds.marine.usgs.gov/fan_info.php?fa=2005-004-FA.
  1. How might this data set be cited?
    U.S. Geological Survey, 2014, Survey tracklines of swath bathymetry collected by the U.S. Geological Survey in Moultonborough Bay, Lake Winnipesaukee, New Hampshire in 2005 (Geographic, WGS 84, Esri polyline shapefile, 2005-004-FA_BATHYTRK.SHP): data release DOI:10.5066/F71N7Z4H, U.S. Geological Survey, Coastal and Marine Geology Program, Woods Hole Coastal and Marine Science Center, Woods Hole, Massachusetts.

    Online Links:

    This is part of the following larger work.

    Denny, J.F., Danforth, W.W., Worley, C.R., and Irwin, B.J., 2014, High-resolution geophysical and sample data collected in Moultonborough Bay, Lake Winnipesaukee, New Hampshire in 2005, USGS Field Activity 2005-004-FA: data release DOI:10.5066/F71N7Z4H, U.S. Geological Survey, Reston, VA.

    Online Links:

  2. What geographic area does the data set cover?
    West_Bounding_Coordinate: -71.390530
    East_Bounding_Coordinate: -71.361113
    North_Bounding_Coordinate: 43.728563
    South_Bounding_Coordinate: 43.710474
  3. What does it look like?
    https://cmgds.marine.usgs.gov/data/field-activity-data/2005-004-FA/data/bathymetry/2005-004-FA_bathytrk.jpg (JPEG)
    Image showing survey tracklines of swath bathymetry collected by the U.S. Geological Survey in Moultonborough Bay, Lake Winnipesaukee, New Hampshire, 2005
  4. Does the data set describe conditions during a particular time period?
    Calendar_Date: 26-Jul-2005
    Currentness_Reference:
    ground condition
  5. What is the general form of this data set?
    Geospatial_Data_Presentation_Form: vector digital data
  6. How does the data set represent geographic features?
    1. How are geographic features stored in the data set?
      This is a Vector data set. It contains the following vector data types (SDTS terminology):
      • String (70)
    2. What coordinate system is used to represent geographic features?
      Horizontal positions are specified in geographic coordinates, that is, latitude and longitude. Latitudes are given to the nearest 0.000001. Longitudes are given to the nearest 0.000001. Latitude and longitude values are specified in Decimal degrees. The horizontal datum used is D_WGS_1984.
      The ellipsoid used is WGS_1984.
      The semi-major axis of the ellipsoid used is 6378137.000000.
      The flattening of the ellipsoid used is 1/298.257224.
  7. How does the data set describe geographic features?
    2005-004-FA_bathytrk
    Swath bathymetric survey lines collected by the U.S. Geological Survey in Moultonborough Bay, Lake Winnipesaukee, New Hampshire, 2005 (Source: U.S. Geological Survey)
    FID
    Internal feature number. (Source: Esri) Sequential unique whole numbers that are automatically generated.
    Shape
    Feature geometry. (Source: Esri) Coordinates defining the features.
    Length
    length of line segment in UTM, Zone 19N, WGS84, meters (Source: U.S. Geological Survey)
    Range of values
    Minimum:26.45
    Maximum:4764.76
    Line
    Line and file number for corresponding bathymetric files. This information is used during data acquisition, processing and archival. Format: L1F1, where L = Line; 1 = Line number; F= File; 1 = File number. (Source: U.S. Geological Survey) String up to 50 characters
    System
    Swath Bathymetric acquisition system used to collect bathymetric data (Source: U.S. Geological Survey) String up to 50 characters
    Freq
    Frequency of the sonar system used to acquire the data. Frequency is listed in kilohertz (kHz). (Source: U.S. Geological Survey) String up to 50 characters
    Cruise_ID
    Unique USGS field activity identification number in the format YYYY-NNN-FA where YYYY is the field activity year, NNN represents the number assigned to the field activity within that year, and FA stands for field activity. (Source: U.S. Geological Survey) String up to 50 characters
    Acq_Date
    Date of data acquisition. Format MM/DD/YYYY. (Source: U.S. Geological Survey) String up to 20 characters
    Jday
    Julian Day during which sonar data were collected (2005) (Source: U.S. Geological Survey)
    ValueDefinition
    207Julian day is the integer number representing the interval of time in days since January 1 of the year of collection.

Who produced the data set?

  1. Who are the originators of the data set? (may include formal authors, digital compilers, and editors)
  2. Who also contributed to the data set?
  3. To whom should users address questions about the data?
    Jane F. Denny
    U.S. Geological Survey
    Geologist
    384 Woods Hole Road
    Woods Hole, Massachusetts
    USA

    508-548-8700 x 2311 (voice)
    508-457-2310 (FAX)
    jdenny@usgs.gov

Why was the data set created?

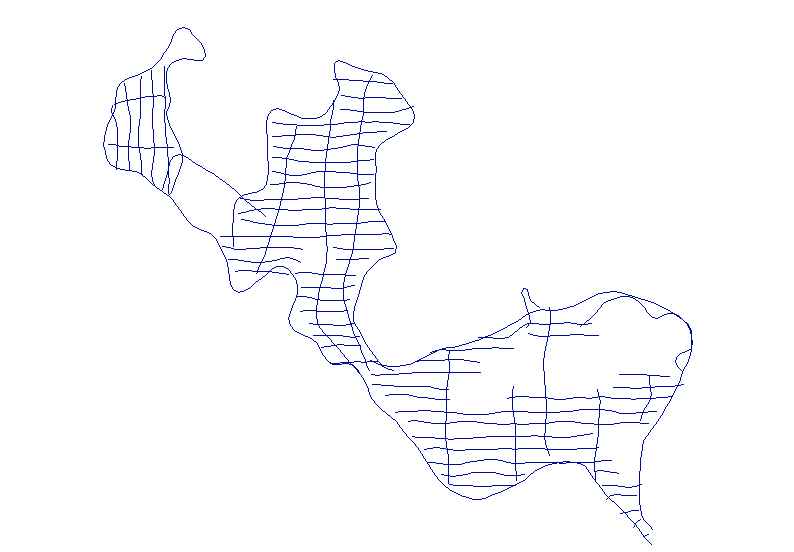
This shapefile contains approximately 37 kilometers of bathymetric trackline data collected with an interferometric sonar (Systems Engineering and Assessment Ltd. (SEA) 2000 series) by the U.S. Geological Survey during USGS survey 2005-04-FA. These data were collected in Moultonborough Bay, Lake Winnipesaukee, New Hampshire as part of a collaborative USGS and New Hampshire Department of Environmental Services research program to assess the distribution of variable leaf water-milfoil. The bathymetric trackline data are used to show where bathymetric data were collected, and to provide an archive of the these data.

How was the data set created?

  1. From what previous works were the data drawn?
    none (source 1 of 1)
    U.S. Geological Survey, Unpublished Material, Raw Bathymetric Data.

    Type_of_Source_Media: online
    Source_Contribution:
    Swath-bathymetric and acoustic-backscatter data were acquired with a SEA, Ltd., Submetrix 2000 Series interferometric sonar operating at a 234-kHz frequency. The SEA Submetrix 2000 Series transducers were mounted at the bow of the USGS R/V Rafael. Approximately 37 km of swath bathymetric data were collected.
    SEA RTS2000 acquisition software (version year 2005) was used to digitally log the bathymetric data at a maximum 50-meter range (100-meter swath width) and 2048 samples per ping in the SEA SXR format. In shallow water areas, the swath width did not achieve the full 50-meter range, but varied from roughly 5x water depth to the maximum 50-meter range (i.e. swath width varied from approximately 15 meters to 100 meters depending on water depth). Data collection parameters are saved as a RTS2000 session file in SEA SXS format.
    An Octopus F180R Attitude and Positioning system (see: http://www.codaoctopus.com/motion/f180/index.asp) recorded ship motion (heave, pitch, roll, and yaw). These data were transmitted via network connection to the RTS2000 data acquisition software. The Octopus F180R Inertial Measurement Unit (IMU) was mounted directly above the SEA Submetrix 2000 Series transducers, to minimize lever arm offsets that can lead to positioning errors. The F180R uses two L1 antennas for position and heading accuracy. The antennas are mounted on a rigid horizontal pole, 3 meters above the F180R IMU, with a horizontal separation of 1 meter and are offset from the IMU in a forward/aft configuration. The forward offset of the primary antenna from the IMU is 0.5 meters, with no port/starboard offset.
    Eight sound-velocity profiles were acquired during survey operations at roughly 1 to 3 hour intervals using an Applied Microsystems SV Plus Velocimeter (Applied Microsystems, 2008). Sound-velocity profiles 1 - 3 were collected during JD 206 for lines 1 - 42. Sound-velocity profiles 4 - 8 were collected during JD207 for lines 43 - 112. Only lines 43 - 112 were used to generate the final bathymetric grid.
    Vertical accuracy of the raw data based on system specifications may approximate 1% of water depth, 0.01 to 0.15 meters within the survey area. However, overall vertical accuracies on the order of 0.5 meters are assumed based on the following considerations: WAAS navigation vertical accuracies; the Coda Octopus F180 Attitude and Positioning system, used to correct for vessel roll, pitch, heave, and yaw, has a theoretical vertical accuracy of a few mm; refraction artifacts were minimized by acquiring a range of sound velocity profiles with a hand-casted Applied MicroSystems SV Plus sound velocimeter during the survey. Changes in ship draft due to water and fuel usage were not considered. Vertical resolution is on the order of 0.1 meters.
  2. How were the data generated, processed, and modified?
    Date: 2005 (process 1 of 10)
    Converting Raw (SXR) to Field-Processed (SXP) Files:
    Raw SXR bathymetry data were acquired with the SEA RTS2000 (version year 2005) software and used to generate field-processed SEA RTS2000 SXP files. The following information was stored within the RTS2000 session files and applied to the raw bathymetric soundings: eight sound velocity profiles to minimize refraction artifacts due to fluctuations from the speed of sound in the water column, roll offsets calculated during pre-survey patch test, draft of the transducer below the water line, and the measured angles and relative positions of the swath bathymetric transducers. The RTS2000 software applies the pitch, roll, heave, yaw and heading data supplied by the F180R IMU, to compensate depth solutions across the swath for any ship motion. Some bathymetric filtering was applied during acquisition, however final processing, filtering and editing were completed with The University of New Brunswick, Ocean Mapping Group (OMG) SwathEd software suite (see process step 2).
    Jane F. Denny performed this and all subsequent process steps. Person who carried out this activity:
    Jane F. Denny
    U.S. Geological Survey
    Geologist
    384 Woods Hole Road
    Woods Hole, Massachusetts
    USA

    508-548-8700 x2311 (voice)
    508-457-2310 (FAX)
    jdenny@usgs.gov
    Date: 2005 (process 2 of 10)
    Generating Bathymetric Grid: University of New Brunswick, Ocean Mapping Group (OMG) SwathEd Multibeam Processing Software (Beaudoin, 2002)
    Bathymetric data (raw SXR files), sound velocity profiles, and system configuration information (antenna offsets, transducer offsets, water level, attitude and positioning) were used to generate a composite bathymetric grid using the University of New Brunswick's Ocean Mapping Group (OMG) SwathEd multibeam processing software. The raw Submetrix 2000 Series data were "unraveled" and reformatted into the OMG format. This process creates several files on disk: a) bathymetric soundings (*.merged) b) raw backscatter (*.ss) c) navigation (*.ascii_nav and *.nav) d) parameter files describing the configuration of the system (i.e. offsets between motion reference unit and GPS antenna, etc.). This process also incorporates the sound velocity profiles in order to properly account for any refraction due to fluctuations in the speed of sound within the water column.
    Date: 2005 (process 3 of 10)
    Reformatting Navigation:
    A C-shell script was used to reformat the ASCII text files (output of the unravel) to include: easting, northing, line number, Julian day, hour, minute, second, longitude, latitude, and concatenate the line files into one comma-delimited ASCII text file.
    Date: 2005 (process 4 of 10)
    The text file (*.csv) was imported into Esri ArcMap 9.0 using Tools - Add XY Data and converted to an event theme. The event theme was then saved to a point shapefile and the projection was defined as Geographic Coordinate System, WGS84 (GCS_WGS_1984). The point shapefile was visually inspected for spurious data points and these data points were manually deleted.
    Date: 2005 (process 5 of 10)
    The point shapefile containing 10-second navigation was used as an input for a VACExtras (version 1.8), a VB collection of tools developed by VeeAnn Cross (USGS-WHSC), which converts point data to a new polyline shapefile, based on the order of records contained within one attribute field. The line number field was used to define the point grouping to create a line.
    Date: 2005 (process 6 of 10)
    System, Freq, Cruise ID, Acq_Date, and Jday fields were added to the attribute table within ArcMap 9.0. The length of each line segment was calculated and included in a new attribute field (Length) using XTools Pro for ArcGIS desktop (version 5.3.0), specifying UTM Zone 19 N, WGS84 - meters.
    Date: 2014 (process 7 of 10)
    ArcGIS 9.3, Xtools 7.1.0 (Build 738) was used to convert polyines to points using Xtools, Feature Conversion, Convert Features to Points, generating a new shapefile. Xtools was then used to add X,Y coordinates to the new shapefile table, using Xtools, Table Operations, Add X,Y,Z coordinates. The table was then exported to a text file using, Xtools, Table Operations, Export table to txt. The txt file was saved as a *.csv. The *csv can then be used outside of the ArcGIS 9.3 environment to generate trackline data, if neeed.
    Date: 06-Apr-2017 (process 8 of 10)
    The online links to the data were updated to reflect the new server hosting the data. Additionally, other small edits could be made to the metadata, such as modifying http to https where appropriate. The metadata date (but not the metadata creator) was edited to reflect the date of these changes. Person who carried out this activity:
    U.S. Geological Survey
    Attn: VeeAnn A. Cross
    Marine Geologist
    384 Woods Hole Road
    Woods Hole, MA

    508-548-8700 x2251 (voice)
    508-457-2310 (FAX)
    vatnipp@usgs.gov
    Date: 20-Jul-2018 (process 9 of 10)
    USGS Thesaurus keywords added to the keyword section. Person who carried out this activity:
    U.S. Geological Survey
    Attn: VeeAnn A. Cross
    Marine Geologist
    384 Woods Hole Road
    Woods Hole, MA

    508-548-8700 x2251 (voice)
    508-457-2310 (FAX)
    vatnipp@usgs.gov
    Date: 08-Sep-2020 (process 10 of 10)
    Added keywords section with USGS persistent identifier as theme keyword. Person who carried out this activity:
    U.S. Geological Survey
    Attn: VeeAnn A. Cross
    Marine Geologist
    384 Woods Hole Road
    Woods Hole, MA

    508-548-8700 x2251 (voice)
    508-457-2310 (FAX)
    vatnipp@usgs.gov
  3. What similar or related data should the user be aware of?
    Argue, Denise M., Kiah, Richard G., Denny, Jane F., Deacon, Jeffrey R., Danforth, William W., Johnston, Craig M., and Smagula, Amy P., 2007, Relation of Lake-Floor Characteristics to the Distribution of Variable Leaf Water-Milfoil in Moultonborough Bay, Lake Winnipesaukee, New Hampshire, 2005: Scientific Investigations Report 2007-5125, U.S. Geological Survey, Reston, Virginia.

    Online Links:

    Beaudoin, Jonathan, 2002, Hitchhiker's Guide to Swathed...: Online Manual http://www.omg.unb.ca/~jonnyb/processing/definitive_swathed/index.html, University of New Brunswick Ocean Mapping Group, Fredericton, New Brunswick, Canada.

    Online Links:


How reliable are the data; what problems remain in the data set?

  1. How well have the observations been checked?
    All attributes were checked in a consistent manner.
  2. How accurate are the geographic locations?
    Navigation was acquired with Wide Area Augmentation System (WAAS), which is accurate to + or - 1 to 2 meters, horizontally. The forward, or primary, Coda Octopus F180R Attitude and Positioning system antenna was used to acquire data and transmit via a network connection to the SEA RTS2000 data collection software. The F180R Attitude and Positioning system uses 2 L1 antennas for position and heading and an Inertial Measurement Unit (IMU) for motion sensing. The F180R IMU is mounted on the rigid bow mount used to deploy the SEA Submetrix 2000 Series bathymetric system, and is located directly above the SEA Submetrix 2000 Series transducers. The F180R antennas are mounted on a rigid horizontal pole, 3 meters above the F180R IMU, offset in a forward/aft configuration. These offsets were corrected within the RTS2000 acquisition software.
  3. How accurate are the heights or depths?
  4. Where are the gaps in the data? What is missing?
    This shapefile contains lines 43 - 112 of swath bathymetric data collected on JD 207(07/26/2005) during USGS field activity 2005-004-FA. Lines 1 - 42 were collected during JD206 and completely covered the survey area, however the sidescan-sonar system (Edgetech 4200) failed during survey operations. The backup sidescan-sonar system (Klein 3000 sidescan-sonar) was configured during JD207. As such, the survey area was resurveyed on JD 207 and those data were used for generating bathymetric surfaces and interpretations.
  5. How consistent are the relationships among the observations, including topology?
    All bathymetric data were collected during USGS cruise 2005-004-FA using a SEA 2000 series 234-kHz swath bathymetric system and an Octopus F180R Attitude and Positioning System. Quality control was conducted during processing of the data. Any spurious data or artifacts were removed or minimized.

How can someone get a copy of the data set?

Are there legal restrictions on access or use of the data?
Access_Constraints: None.
Use_Constraints:
Public domain data from the U.S. Government are freely redistributable with proper metadata and source attribution. Please recognize the U.S. Geological Survey as the originator of the dataset.
  1. Who distributes the data set? (Distributor 1 of 1)
    Jane F. Denny
    U.S. Geological Survey
    Geologist
    384 Woods Hole Road
    Woods Hole, Massachusetts
    USA

    508-548-8700 x2311 (voice)
    508-457-2310 (FAX)
    jdenny@usgs.gov
  2. What's the catalog number I need to order this data set? The file 2005-004-FA_bathytrk.zip contains the shapefile 2005-004-FA_bathytrk.shp and other files associated with the shapefile. In addition to the shapefile, the zip file also contains the data in CSV format (2005-004-FA_bathytrk.csv), the browse graphic (2005-004-FA_bathytrk.jpg) and the FGDC CSDGM metadata in the following formats: XML, HTML, FAQ and text.
  3. What legal disclaimers am I supposed to read?
    Neither the U.S. Government, the Department of the Interior, nor the USGS, nor any of their employees, contractors, or subcontractors, make any warranty, express or implied, nor assume any legal liability or responsibility for the accuracy, completeness, or usefulness of any information, apparatus, product, or process disclosed, nor represent that its use would not infringe on privately owned rights. The act of distribution shall not constitute any such warranty, and no responsibility is assumed by the USGS in the use of these data or related materials. Any use of trade, product, or firm names is for descriptive purposes only and does not imply endorsement by the U.S. Government.
  4. How can I download or order the data?
  5. What hardware or software do I need in order to use the data set?
    This zip file contains data available in Esri shapefile format. The zip file also contains associated metadata. The user must have ArcGIS or ArcView 3.0 or greater software to read and process the data file. In lieu of ArcView or ArcGIS, the user may utilize another GIS application package capable of importing the data. A free data viewer, ArcGIS Explorer, capable of displaying the data is available from Esri at www.esri.com.

Who wrote the metadata?

Dates:
Last modified: 18-Mar-2024
Metadata author:
Jane F. Denny
U.S. Geological Survey
Geologist
384 Woods Hole Road
Woods Hole, Massachusetts
USA

508-548-8700 x2311 (voice)
508-457-2310 (FAX)
whsc_data_contact@usgs.gov
Contact_Instructions:
The metadata contact email address is a generic address in the event the person is no longer with USGS. (updated on 20240318)
Metadata standard:
FGDC Content Standards for Digital Geospatial Metadata (FGDC-STD-001-1998)

Generated by mp version 2.9.50 on Thu Mar 28 16:00:19 2024