Chirp sub-bottom profiler 500-shot point interval navigation collected by the U.S. Geological Survey offshore of Fire Island, NY in 2011 (Geographic, WGS 84, Esri Point Shapefile)

Metadata also available as - [Outline] - [Parseable text] - [XML]

Frequently anticipated questions:


What does this data set describe?

Title:
Chirp sub-bottom profiler 500-shot point interval navigation collected by the U.S. Geological Survey offshore of Fire Island, NY in 2011 (Geographic, WGS 84, Esri Point Shapefile)
Abstract:
The U.S. Geological Survey (USGS) mapped approximately 336 square kilometers of the lower shoreface and inner-continental shelf offshore of Fire Island, New York in 2011 using interferometric sonar and high-resolution chirp seismic-reflection systems. These spatial data support research on the Quaternary evolution of the Fire Island coastal system and provide baseline information for research on coastal processes along southern Long Island. For more information about the WHCMSC Field Activity, see https://cmgds.marine.usgs.gov/fan_info.php?fan=2011-005-FA.
  1. How might this data set be cited?
    U.S. Geological Survey, 2015, Chirp sub-bottom profiler 500-shot point interval navigation collected by the U.S. Geological Survey offshore of Fire Island, NY in 2011 (Geographic, WGS 84, Esri Point Shapefile): data release DOI:10.5066/F75X2704, U.S. Geological Survey, Coastal and Marine Geology Program, Woods Hole Coastal and Marine Science Center, Woods Hole, Massachusetts.

    Online Links:

    This is part of the following larger work.

    Denny, Jane F., Schwab, William C., Baldwin, Wayne E., Bergeron, Emile, and Moore, Eric, 2015, High-resolution geophysical data collected offshore of Fire Island, New York in 2011, USGS Field Activity 2011-005-FA: data release DOI:10.5066/F75X2704, U.S. Geological Survey, Reston, VA.

    Online Links:

  2. What geographic area does the data set cover?
    West_Bounding_Coordinate: -73.278147
    East_Bounding_Coordinate: -72.745661
    North_Bounding_Coordinate: 40.749798
    South_Bounding_Coordinate: 40.544405
  3. What does it look like?
    https://cmgds.marine.usgs.gov/data/field-activity-data/2011-005-FA/data/seismics/2011-005-FA_chirp500sht.jpg (JPEG)
    Image showing chirp sub-bottom profiler 500-shot point interval navigation collected by the U.S. Geological Survey on the inner-continental shelf offshore of Fire Island, NY, 2011.
  4. Does the data set describe conditions during a particular time period?
    Beginning_Date: 21-May-2011
    Ending_Date: 05-Jun-2011
    Currentness_Reference:
    ground condition during 20110521 - 20110605
  5. What is the general form of this data set?
    Geospatial_Data_Presentation_Form: vector digital data
  6. How does the data set represent geographic features?
    1. How are geographic features stored in the data set?
      This is a Vector data set. It contains the following vector data types (SDTS terminology):
      • Entity point (9760)
    2. What coordinate system is used to represent geographic features?
      Horizontal positions are specified in geographic coordinates, that is, latitude and longitude. Latitudes are given to the nearest 0.000001. Longitudes are given to the nearest 0.000001. Latitude and longitude values are specified in Decimal degrees. The horizontal datum used is D_WGS_1984.
      The ellipsoid used is WGS_1984.
      The semi-major axis of the ellipsoid used is 6378137.000000.
      The flattening of the ellipsoid used is 1/298.257224.
  7. How does the data set describe geographic features?
    2011-005-FA_chirp500sht
    500-shot point interval navigation for chirp sub-bottom data collected by the U.S. Geological Survey during field activity 2011-005-FA offshore of Fire Island, NY, 2011. (Source: U.S. Geological Survey)
    FID
    Internal feature number. (Source: ESRI) Sequential unique whole numbers that are automatically generated.
    Shape
    Feature geometry. (Source: ESRI) Coordinates defining the features.
    East
    Easting coordinate in UTM zone 18N, meters, WGS84 (Source: U.S. Geological Survey)
    Range of values
    Minimum:645669.89
    Maximum:690447.74
    Units:meters
    North
    Norhting coordinate in UTM, zone 18N, meters, WGS84 (Source: U.S. Geological Survey)
    Range of values
    Minimum:4489705.56
    Maximum:4513363.82
    Units:meters
    Lon
    Longitude coordinate in decimal degrees, WGS84 (Source: U.S. Geological Survey)
    Range of values
    Minimum:-73.278147
    Maximum:-72.745661
    Units:decimal degrees
    Lat
    Latitude coordinate in decimal degrees, WGS84 (Source: U.S. Geological Survey)
    Range of values
    Minimum:40.544405
    Maximum:40.749798
    Units:decimal degrees
    LineName
    Line and file number for corresponding seismic files. This information is used during data acquisition, processing and archival. Format: L1F1, where L = Line; 1 = Line number; F= File; 1 = File number. (Source: U.S. Geological Survey) String up to 254 characters.
    Shot
    Shot number (first, last, every 500 shot) (Source: U.S. Geological Survey)
    Range of values
    Minimum:1
    Maximum:27823
    Year
    Calendar year in which data were collected (USGS Field activity 2011-005-FA; 2011) (Source: U.S. Geological Survey)
    ValueDefinition
    2011Calendar year in which data were collected
    JulDay
    Julian Day during which sonar data were collected (2011) (Source: U.S. Geological Survey)
    Range of values
    Minimum:141
    Maximum:156
    Units:Julian day is the integer number representing the interval of time in days since January 1 of the year of collection.
    UTC
    UTC time of seismic shot (HH:MM:SS) (Source: U.S. Geological Survey) String up to 8 characters.
    oldEast
    pre-layback calculation Easting coordinate in UTM Zone 18N meters, WGS84. (Source: U.S. Geological Survey)
    Range of values
    Minimum:645635.24
    Maximum:690407.77
    Units:meters
    oldNorth
    pre-layback calculation Northing coordinate in UTM Zone 18N meters, WGS84. (Source: U.S. Geological Survey)
    Range of values
    Minimum:4489745.46
    Maximum:4513348.58
    Units:meters
    Survey
    Unique USGS field activity identification number in the format YYYY-NNN-FA where YYYY is the field activity year, NNN represents the number assigned to the field activity within that year, and FA stands for field activity. (Source: U.S. Geological Survey) String up to 30 characters.
    Acq_System
    Seismic system used to acquire data during USGS field activity 2011-005-FA. (Source: U.S. Geological Survey) String up to 20 characters.
    Ship
    Survey vessel. (Source: U.S. Geological Survey) String up to 30 characters.
    Entity_and_Attribute_Overview:
    The unique shot CSV file has the following column headings: East, North, Lon, Lat, LineName, Shot, Year, JulDay, UTC, OldEast, OldNorth, Survey, Acq_system, and ship. OldEast and OldNorth document pre-layback shot/trace positions in eastings and northings. The PNG seismic reflection images can be hyperlinked to their trackline location in ArcGIS. The 500 shot point intervals correspond to the x-axis ticks on the PNG images.
    Entity_and_Attribute_Detail_Citation: U.S. Geological Survey

Who produced the data set?

  1. Who are the originators of the data set? (may include formal authors, digital compilers, and editors)
  2. Who also contributed to the data set?
  3. To whom should users address questions about the data?
    Jane F. Denny
    U.S. Geological Survey
    Geologist
    384 Woods Hole Road
    Woods Hole, Massachusetts
    USA

    508-548-8700 x 2311 (voice)
    508-457-2310 (FAX)
    jdenny@usgs.gov

Why was the data set created?

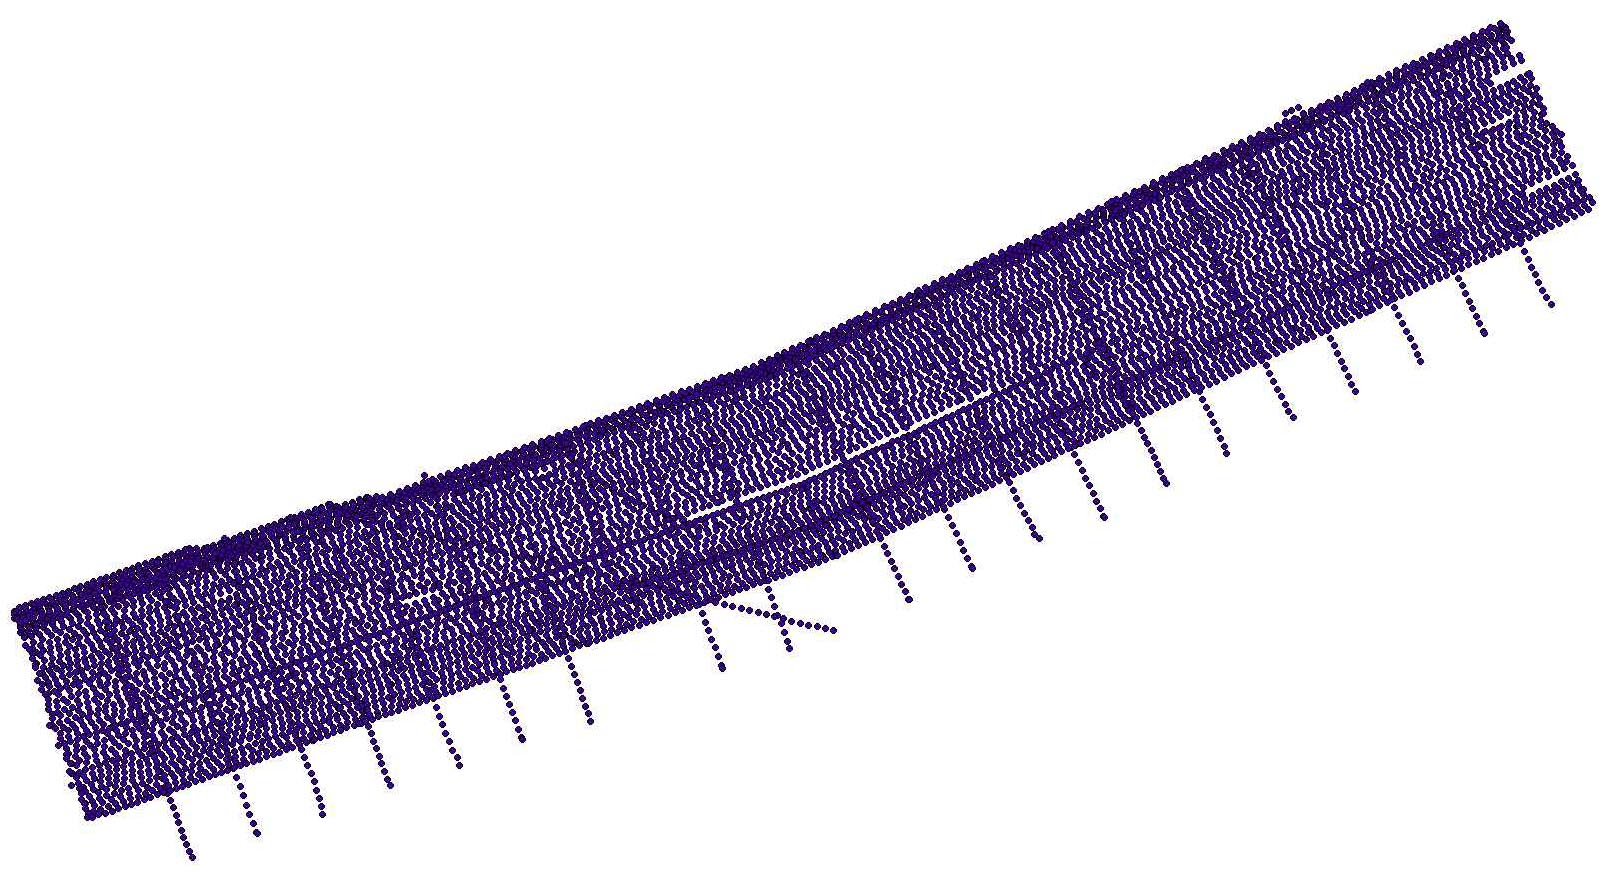
This shapefile contains 500-shot point interval navigation for approximately 2200 kilometers of chirp sub-bottom data collected with an Edgetech Geo-Star FSSB sub-bottom profiling system and an SB-0512i towfish (0.5 - 12 kHz) during USGS field activity 2011-005-FA. The shot point navigation allows features in the seismic data to be correlated to features visible within other geophysical datasets.

How was the data set created?

  1. From what previous works were the data drawn?
    chirp data (source 1 of 1)
    U.S. Geological Survey, Unpublished Material, Raw seismic data.

    Type_of_Source_Media: disc
    Source_Contribution:
    Shallow geologic framework and surficial geology were interpreted from approximately 2200 trackline kilometers of chirp seismic-reflection profiles that were collected during U.S. Geological Survey field activity 2011-005-FA ( https://cmgds.marine.usgs.gov/fan_info.php?fan=2011-005-FA). Final, post-processed profiles were used to make the interpretations. Survey: Survey lines were run at an average speed of 5 knots. Lines 14 through 27 were run at a 75-m line spacing to achieve full coverage of the seafloor with sonar systems in a priority area of interest in the nearshore, in water depths less than 15 meters. Lines 28 through 92 were run at a 150-m line spacing, with the exception of tie lines (lines 52 through 60, 65 through 67, 89 through 92), which were run at approximately a 2-km line spacing. Seismic Data: Chirp seismic data were collected using an EdgeTech Geo-Star FSSB sub-bottom profiling system and an SB-0512i towfish (0.5-12 kHz), which was mounted on a catamaran and towed astern of the M/V Scarlett Isabella. Chesapeake Technologies' SonarWiz (v.5.03.0016) seismic acquisition software was used to control the Geo-Star topside unit, digitally log trace data in the SEG-Y Rev. 1 format (IEEE floating point), and record DGPS navigation coordinates to the SEG-Y trace headers (in arc seconds of Latitude and Longitude, multiplied by a scalar of 100). Data were acquired using a 0.25-s shot rate, a 5-ms pulse length, and a 0.5 to 8 kHz frequency sweep. Recorded trace lengths were approximately 200 ms (4340 samples/trace and .000046-s sample interval).
  2. How were the data generated, processed, and modified?
    Date: 2011 (process 1 of 7)
    Processing Seismic Data: SIOSEIS (version 2010.2.25) was used to read SEG-Y files, renumber shots starting from one, and write out new SEG-Y files. The original shot numbers, which were assigned by SonarWiz sequentially over the duration of an acquisition session despite SEG-Y file changes, are preserved in the raw SEG-Y data. Wayne E. Baldwin performed this and all subsequent process steps. Person who carried out this activity:
    Wayne E. Baldwin
    U.S. Geological Survey
    Geologist
    384 Woods Hole Road
    Woods Hole, MA
    USA

    508-548-8700 x2226 (voice)
    508-457-2310 (FAX)
    wbaldwin@usgs.gov
    Date: 2011 (process 2 of 7)
    Seismic Unix (version 4.2) was used to read renumbered SEG-Y files, write a Seismic Unix file, and extract SEG-Y trace header information, including shot number, longitude, latitude, year, Julian day, and time of day (UTC). Geographic coordinates (WGS84) were converted to UTM zone 18 coordinates (WGS84) using Proj (version 4.6.0). Header information from each SEG-Y file were saved to text files after an AWK (no version) filter was used to maintain the first and last shots, shots at multiples of 100, and shots with unique navigation coordinates. End shots and shots at multiples of 100 may not have unique navigation coordinates. Separate text files containing the first and last shots and even 500 shot intervals were also saved. A 500 shot interval was chosen because it corresponds to the annotation interval provided along the top of the seismic-reflection profile PNG images.
    Date: 2011 (process 3 of 7)
    An AWK (no version) script was used to apply layback to seismic navigation. The script utilized a read-and-do loop to calculate and apply layback offsets to trace positions. During the initial loop through the script: 1) Easting and northing coordinates (UTM Zone 18, WGS84) for the first five traces of input navigation were read and easting and northing differentials between the consecutive positions were calculated; 2) The signs (+/-) of the differential values were compared to a look-up table to determine the appropriate conversion of the arc tangent (atan2(dy,dx)) angle between consecutive positions to a polar azimuth; 3) The average of the polar azimuths was calculated; 4) The sine and cosine of the average azimuth was calculated and multiplied by the linear distance between the catamaran and the shipboard DGPS receiver (51.5m lines l14f1- l74f1; 43.2m lines l75f1 - ll92f1), providing absolute values for easting and northing offsets, respectively; 5) A look-up table was used to determine the quadrant of the average azimuth and appropriately add or subtract the calculated offsets to the easting and northing coordinates of the first three input traces, producing final layback positions for those traces; 6) Layback and original easting and northing coordinates for the three adjusted traces were printed to a new layback navigation file that also retained additional attributes input records; and 7) Easting and northing coordinates of the fourth and fifth traces, the three azimuths computed between traces two, three, four, and five, and the average azimuth were held as input for calculations conducted in the subsequent loop. During subsequent loops through the script: 1) Easting and northing coordinates for three additional traces from input navigation were read, and easting and northing differentials were calculated between the consecutive positions, including the last trace position held from the previous loop; 2) Three new polar azimuths were calculated using the differential values, then a new average azimuth was calculated from the three that were held, the new three, and the average held from the previous loop (the previously calculated average was factored into the new average to smooth "kinks" along the layback navigation that can result from significantly different average azimuths calculated from one loop to the next); 3) new layback offset values were computed, and applied to the easting and northing coordinates of the last two traces input during the previous loop, and the first trace input during the present loop; 4) layback and original easting and northing coordinates for the three adjusted traces were appended to the layback navigation file started in the previous loop; and 5) easting and northing coordinates of the second and third traces, the three new azimuths, and the average azimuth from the present loop were held as input for calculations conducted in the subsequent loop. Near the end of the input navigation file: 1) if less than three traces were present during a new loop, the layback offsets calculated during the previous loop were applied to remaining trace coordinates; 2) layback and original easting and northing coordinates for the remaining adjusted traces were appended to the layback navigation file; and 3) the script reached its end, closed, and saved the layback navigation file. In this fashion, the script approximated a moving window, in which the average of six trace-to-trace azimuths was used to calculate layback offsets for three central trace positions. Exceptions were at the start of a file, where the first three input trace positions were adjusted using offsets calculated from the average of only four azimuths, and possibly at the end of a file, where remaining traces may have been adjusted using the offsets calculated during the previous loop.
    Date: 2011 (process 4 of 7)
    AWK was used to filter the unique navigation text files to generate additional text files containing the first and last shots, and even 500 shot positions for each seismic line. The 500 shot text files were concatenated into a comma-delimited text file. The text file was imported into ArcMap (version 9.3) using 'Add XY data' and saved as points (Geographic, WGS84) in the Esri shapefile format. The following fields were manually added to the attribute table: Survey, Acq_system, and Ship.
    Date: 18-Apr-2017 (process 5 of 7)
    The online links to the data were updated to reflect the new server hosting the data. Additionally, other small edits could be made to the metadata, such as modifying http to https where appropriate. The metadata date (but not the metadata creator) was edited to reflect the date of these changes. Person who carried out this activity:
    U.S. Geological Survey
    Attn: VeeAnn A. Cross
    Marine Geologist
    384 Woods Hole Road
    Woods Hole, MA

    508-548-8700 x2251 (voice)
    508-457-2310 (FAX)
    vatnipp@usgs.gov
    Date: 20-Jul-2018 (process 6 of 7)
    USGS Thesaurus keywords added to the keyword section. Person who carried out this activity:
    U.S. Geological Survey
    Attn: VeeAnn A. Cross
    Marine Geologist
    384 Woods Hole Road
    Woods Hole, MA

    508-548-8700 x2251 (voice)
    508-457-2310 (FAX)
    vatnipp@usgs.gov
    Date: 08-Sep-2020 (process 7 of 7)
    Added keywords section with USGS persistent identifier as theme keyword. Person who carried out this activity:
    U.S. Geological Survey
    Attn: VeeAnn A. Cross
    Marine Geologist
    384 Woods Hole Road
    Woods Hole, MA

    508-548-8700 x2251 (voice)
    508-457-2310 (FAX)
    vatnipp@usgs.gov
  3. What similar or related data should the user be aware of?
    Schwab, William C., Baldwin, Wayne E., Hapke, Cheryl J., Lentz, Erika E., Gayes, Paul T., Denny, Jane F., List, Jeffrey H., and Warner, John C., 2013, Geologic Evidence for Onshore Sediment Transport from the Inner Continental Shelf: Fire Island, New York: Journal of Coastal Research Volume 29, Issue 3, pp. 526-544., Coastal Education and Research Foundation, Inc., Florida, USA.

    Online Links:

    Foster, David S., Swift, Ann B., and Schwab, William C., 1999, Stratigraphic Framework Maps of the nearshore area of southern Long Island from Fire Island to Montauk Point, NY: Open-File Report 99-559, U.S. Geological Survey, Reston, VA.

    Online Links:

    Schwab, William C., Thieler, E. Robert, Denny, Jane F., Danforth, William W., and Hill, Jenna C., 2000, Seafloor sediment distribution off southern Long Island, New York: Open-File Report 00-243, U.S. Geological Survey, Reston, VA.

    Online Links:

    Schwab, W.C., Denny, J.F., and Baldwin, W.E., 2014, Maps Showing Bathymetry and Modern Sediment Thickness on the Inner Continental Shelf Offshore of Fire Island, New York, Pre-Hurricane Sandy: Open File Report 2014-1203, U.S. Geological Survey, Reston, VA.

    Online Links:

    Other_Citation_Details:
    This publication contains the backscatter image generated from data collected during WHCMSC field activity 2011-005-FA.
    Schwab, W.C., Baldwin, W.E., and Denny, J.F., 2014, Maps Showing the Change in Modern Sediment Thickness on the Inner Continental Shelf Offshore of Fire Island, New York, Between 1996-97 and 2011: Open File Report 2014-1238, U.S. Geological Survey, Reston, VA.

    Online Links:

    Schwab, William C., Baldwin, Wayne E., Denny, Jane F., Hapke, Cheryl J., Gayes, Paul T., List, Jeffrey H., and Warner, John C., 2014, Modification of the Quaternary stratigraphic framework of the inner-continental shelf by Holocene marine transgression: An example offshore of Fire Island, New York: Marine Geology Volume 355, Elsevier B.V., Amsterdam, Netherlands.

    Online Links:

    Goff, J.A., Flood, R.D., Austin, J.A., Schwab, W.C., Christensen, B., Browne, C.M., Denny, J.F., and Baldwin, W.E., 2015, The impact of Hurricane Sandy on the shoreface and inner shelf of Fire Island, New York: Large bedform migration and limited erosion: Continental Shelf Research v. 98, pp. 13-25, Elsevier B.V., Amsterdam, Netherlands.

    Online Links:


How reliable are the data; what problems remain in the data set?

  1. How well have the observations been checked?
    All attributes were evaluated during processing as standard quality control to ensure attributes contain accurate and relevant information and values. For each seismic trackline there is a starting shot point (1) and ending shot point (x) with even 500-shot intervals in the shapefile. The CSV file contains unique shot point navigation. No duplicate shots exist.
  2. How accurate are the geographic locations?
    The Edgetech SB-0512i was mounted on a catamaran sled and towed at the sea surface 51.5 m (lines l14f1 - l74f1) and 43.2 m (lines l75f1 - l92f1) astern of the M/V Scarlett Isabella. Position data were provided by a Differential Global Positioning System (DGPS) navigation receiver (F180 (lines l14f1 - l74f1) and BR2G (lines l75f1 - l92f1)). Layback navigation was generated to account for towfish position. Positional accuracy is assumed to be ± 10 m.
  3. How accurate are the heights or depths?
  4. Where are the gaps in the data? What is missing?
    All chirp subbottom shot point navigation (500-shot interval) collected during USGS Woods Hole Coastal and Marine Science Center field activity 2011-05-FA are included and were used for seismic interpretation (Lines 14 - 92). Only swath bathymetric data were collected for lines 1 - 13, as the nearshore zone was targeted for tightly spaced bathymetric surveying for feature identification.
  5. How consistent are the relationships among the observations, including topology?
    All subbottom data were collected during USGS cruise 2011-005-FA using an Edgetech SB-512i chirp subbottom profiler. Seismic trackline navigation was generated from unique shot navigation for the seismic system. The unique shot navigation data were evaluated during processing for spurious points; all spurious points were removed prior to generating the trackline navigation.

How can someone get a copy of the data set?

Are there legal restrictions on access or use of the data?
Access_Constraints: none
Use_Constraints:
Public domain data from the U.S. Government are freely redistributable with proper metadata and source attribution. Please recognize the U.S. Geological Survey as the originator of the dataset.
  1. Who distributes the data set? (Distributor 1 of 1)
    Jane F. Denny
    U.S. Geological Survey
    Geologist
    384 Woods Hole Road
    Woods Hole, Massachusetts
    USA

    508-548-8700 x 2311 (voice)
    508-457-2311 (FAX)
    jdenny@usgs.gov
  2. What's the catalog number I need to order this data set? 2011-005-FA_chirp500sht.shp and 2011-005-FA_chirpsht.csv (unique shot navigation)
  3. What legal disclaimers am I supposed to read?
    Neither the U.S. Government, the Department of the Interior, nor the USGS, nor any of their employees, contractors, or subcontractors, make any warranty, express or implied, nor assume any legal liability or responsibility for the accuracy, completeness, or usefulness of any information, apparatus, product, or process disclosed, nor represent that its use would not infringe on privately owned rights. The act of distribution shall not constitute any such warranty, and no responsibility is assumed by the USGS in the use of these data or related materials. Any use of trade, product, or firm names is for descriptive purposes only and does not imply endorsement by the U.S. Government.
  4. How can I download or order the data?
  5. Is there some other way to get the data?
    none
  6. What hardware or software do I need in order to use the data set?
    This zip file contains data available in Esri shapefile format and in comma separated value (csv) files. The zip file also contains associated metadata. The user must have ArcGIS or ArcView 3.0 or greater software to read and process the data file. In lieu of ArcView or ArcGIS, the user may utilize another GIS application package capable of importing the data. A free data viewer, ArcGIS Explorer, capable of displaying the data is available from Esri at www.esri.com.

Who wrote the metadata?

Dates:
Last modified: 18-Mar-2024
Metadata author:
Jane F. Denny
U.S. Geological Survey
Geologist
384 Woods Hole Road
Woods Hole, MA
USA

508-548-8700 x2311 (voice)
508-457-2310 (FAX)
whsc_data_contact@usgs.gov
Contact_Instructions:
The metadata contact email address is a generic address in the event the person is no longer with USGS. (updated on 20240318)
Metadata standard:
FGDC Content Standards for Digital Geospatial Metadata (FGDC-STD-001-1998)

Generated by mp version 2.9.50 on Fri Mar 29 12:11:59 2024