1-meter backscatter imagery collected in 2012 by the U.S. Geological Survey in the Connecticut River during field activity 2012-024-FA (GeoTIFF image)

Metadata also available as - [Outline] - [Parseable text] - [XML]

Frequently anticipated questions:


What does this data set describe?

Title:
1-meter backscatter imagery collected in 2012 by the U.S. Geological Survey in the Connecticut River during field activity 2012-024-FA (GeoTIFF image)
Abstract:
A geophysical and geological survey was conducted at the mouth of the Connecticut River from Old Saybrook to Essex, Connecticut, in September 2012. Approximately 230 linear kilometers of digital Chirp subbottom (seismic-reflection) and 234-kilohertz interferometric sonar (bathymetric and backscatter) data were collected along with sediment samples, riverbed photographs, and (or) video at 88 sites within the geophysical survey area. Sediment grab samples were collected at 72 of the 88 sampling sites, video was acquired at 68 sites, and photographs of the river bottom were taken at 38 sites. These survey data are used to characterize the riverbed by identifying sediment-texture and riverbed morphology. More information can be found on the web page for the Woods Hole Coastal and Marine Science Center field activity: https://cmgds.marine.usgs.gov/fan_info.php?fan=2012-024-FA. Data collected during the 2012 survey can be obtained here: https://doi.org/10.5066/F7PG1Q7V.
Supplemental_Information:
More information can be found on the WHCMSC Field Activity webpage: https://cmgds.marine.usgs.gov/fan_info.php?fan=2012-024-FA. Data collected during the 2012 survey can be obtained here: https://doi.org/10.5066/F7PG1Q7V.
  1. How might this data set be cited?
    U.S. Geological Survey, 2017, 1-meter backscatter imagery collected in 2012 by the U.S. Geological Survey in the Connecticut River during field activity 2012-024-FA (GeoTIFF image): data release DOI:10.5066/F7PG1Q7V, U.S. Geological Survey, Coastal and Marine Geology Program, Woods Hole Coastal and Marine Science Center, Woods Hole, Massachusetts.

    Online Links:

    This is part of the following larger work.

    Ackerman, Seth D., Foster, David S., Moore, Eric M., Irwin, Barry J., Blackwood, Dann S., and Sherwood, Christopher R., 2017, High-Resolution Geophysical and Sampling Data Collected at the Mouth of the Connecticut River, Old Saybrook to Essex, Connecticut, 2012: data release DOI:10.5066/F7PG1Q7V, U.S. Geological Survey, Reston, VA.

    Online Links:

    Other_Citation_Details:
    Suggested citation: Ackerman S.D., Foster D.S., Moore E.M., Irwin B.J., Blackwood D.S., and Sherwood, C.R., 2017, High-resolution geophysical and sampling data collected at the mouth of the Connecticut River, Old Saybrook to Essex, Connecticut, 2012: U.S. Geological Survey data release, https://doi.org/10.5066/F7PG1Q7V.
  2. What geographic area does the data set cover?
    West_Bounding_Coordinate: -72.420252
    East_Bounding_Coordinate: -72.328226
    North_Bounding_Coordinate: 41.392592
    South_Bounding_Coordinate: 41.260370
  3. What does it look like?
    https://cmgds.marine.usgs.gov/data/field-activity-data/2012-024-FA/data/backscatter/2012-024-FA_Backscatter1m_browse.jpg (JPEG)
    Gray-scale image of interferometric backscatter of the Connecticut River
  4. Does the data set describe conditions during a particular time period?
    Beginning_Date: 16-Sep-2012
    Ending_Date: 21-Sep-2012
    Currentness_Reference:
    ground condition of survey dates: 20120916-20120921; no backscatter data were collected on 20120918; see Completeness_Report for more information
  5. What is the general form of this data set?
    Geospatial_Data_Presentation_Form: raster digital data
  6. How does the data set represent geographic features?
    1. How are geographic features stored in the data set?
      This is a Raster data set. It contains the following raster data types:
      • Dimensions 14474 x 7271, type Pixel
    2. What coordinate system is used to represent geographic features?
      Grid_Coordinate_System_Name: Universal Transverse Mercator
      Universal_Transverse_Mercator:
      UTM_Zone_Number: 18N
      Transverse_Mercator:
      Scale_Factor_at_Central_Meridian: 0.9996
      Longitude_of_Central_Meridian: -75
      Latitude_of_Projection_Origin: 0
      False_Easting: 500000
      False_Northing: 0
      Planar coordinates are encoded using row and column
      Abscissae (x-coordinates) are specified to the nearest 1.0
      Ordinates (y-coordinates) are specified to the nearest 1.0
      Planar coordinates are specified in meters
      The horizontal datum used is D_WGS_1984.
      The ellipsoid used is WGS_1984.
      The semi-major axis of the ellipsoid used is 6378137.000000.
      The flattening of the ellipsoid used is 1/298.257224.
  7. How does the data set describe geographic features?
    Entity_and_Attribute_Overview:
    There are no attributes associated with a GeoTIFF image. Pixel values for the GeoTIFF have a possible 8-bit pixel range of 0 to 255. However, the acoustic reflectivity data range from 1 to 254 in the final imagery, with a NODATA value of 0 (zero) for the areas outside of the survey area. Low-backscatter intensity is represented by dark tones (low values) and high-backscatter intensity is represented by bright tones (high values).
    Entity_and_Attribute_Detail_Citation: U.S. Geological Survey

Who produced the data set?

  1. Who are the originators of the data set? (may include formal authors, digital compilers, and editors)
  2. Who also contributed to the data set?
  3. To whom should users address questions about the data?
    Seth Ackerman
    U.S. Geological Survey
    Geologist
    384 Woods Hole Rd.
    Woods Hole, MA
    USA

    508-548-8700 x2315 (voice)
    508-457-2310 (FAX)
    sackerman@usgs.gov

Why was the data set created?

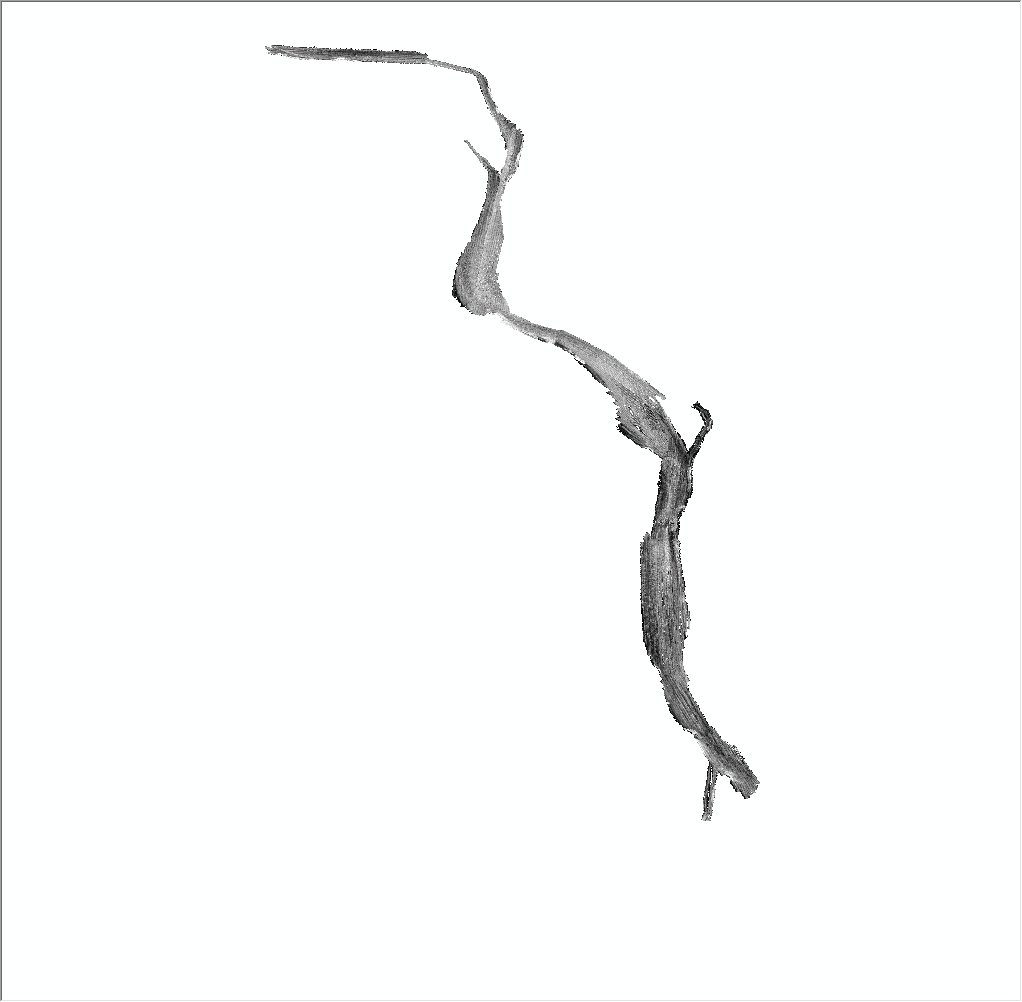
This backscatter imagery layer represents approximately 7 square kilometers of interferometric sonar (Systems Engineering and Assessment Ltd. SWATHPlus-M) backscatter data collected by the U.S. Geological Survey in the Connecticut River in 2012 during USGS field activity 2012-024-FA. These data can be used in conjunction with other geophysical and sample data to identify riverbed morphology and sediment texture.

How was the data set created?

  1. From what previous works were the data drawn?
    raw data (source 1 of 1)
    U.S. Geological Survey, Unpublished Material, raw SWATHplus-M data.

    Type_of_Source_Media: disc
    Source_Contribution:
    USGS Field Activity 2012-024-FA: A 234 kHz Systems Engineering and Assessment Ltd. (SEA) SWATHplus-M interferometric sonar was mounted on a rigid pole on the bow of the R/V Rafael. Data were acquired during September 2012.
    Configuration:
    Survey: Survey lines were run at an average speed of 5 knots and were generally spaced 30 m apart to obtain overlapping swaths of data and full riverbed coverage.
    Sonar: The SEA SWATHplus-M operates at a frequency of 234 kHz and a variable range (increased or decreased manually depending on water depth). The system was operated with a transmit power: 60 percent, a transmit pulse length: 34 cycles, 4096 samples per channel, ping range of 46 meters. Additional sonar configuration information that are not necessarily applicable to the backscatter imagery can be found in the metadata for the bathymetry surface included with this data release (https://doi.org/10.5066/F7PG1Q7V).
  2. How were the data generated, processed, and modified?
    Date: Sep-2012 (process 1 of 6)
    1. Each raw SWATHplus bathymetric sonar file (SXR) was converted to a SWATHplus processed file (SXP) using SEA SWATHplus Swath Processor (ver. 3.07.17.00). Conversion to SXP format retained all recorded data (Output Processed File/Processed Data Output Settings/Data Selection/Store All Data). This process step and all subsequent process steps were performed by the same person - Seth Ackerman. Person who carried out this activity:
    Seth Ackerman
    U.S. Geological Survey
    Geologist
    384 Woods Hole Rd.
    Woods Hole, MA
    USA

    508-548-8700 x2315 (voice)
    508-457-2310 (FAX)
    sackerman@usgs.gov
    Date: Oct-2012 (process 2 of 6)
    2. SXPTools (version 20111004) software was used to process the backscatter data. An empirical gain normalization was applied to each SXP file to optimize the dynamic range of recorded backscatter intensity (SXPTools/SXPEGN). SXPMAGIC was used to interpolate backscatter intensity values across gaps at nadir that resulted from the filtering methods used to process the bathymetric soundings (SXPTools/SXPMAGIC).
    Date: Oct-2012 (process 3 of 6)
    3. Groupings of the SXPTools processed "filled" SXP files were mapped into several 1-meter resolution images using the SWATHplus GridProc software.
    Date: 26-Sep-2013 (process 4 of 6)
    4. The individual backscatter images for lines 2-19, 20-40, 41-55, 56-84, 85-95, 96-113, 114-117, 123-132, 134-151, 152-157, and 158 were mosaicked together using PCI Geomatica - OrthoEngine (version 2013.0.2). No blend-effect was used therefore some sharp tonal differences may exist where subareas were mosaicked together. The final backscatter image was exported as 8-bit GeoTIFF images (UTM Zone 18N, WGS 84) at 1-m resolution. High backscatter intensity values are shown by light tones and low backscatter intensity values are shown by dark tones in the imagery. Data sources produced in this process:
    • 2012-024-FA_Backscatter1m.tif
    Date: 30-Jul-2017 (process 5 of 6)
    5. A world file with the same prefix file name and .tfw extension was created in ArcMap version 10.3.1 using EXPORT RASTER WORLD FILE tool. Data sources produced in this process:
    • 2012-024-FA_Backscatter1m.tfw
    Date: 08-Sep-2020 (process 6 of 6)
    Added keywords section with USGS persistent identifier as theme keyword. Person who carried out this activity:
    U.S. Geological Survey
    Attn: VeeAnn A. Cross
    Marine Geologist
    384 Woods Hole Road
    Woods Hole, MA

    508-548-8700 x2251 (voice)
    508-457-2310 (FAX)
    vatnipp@usgs.gov
  3. What similar or related data should the user be aware of?

How reliable are the data; what problems remain in the data set?

  1. How well have the observations been checked?
    Image pixel values contain gray-scale acoustic reflectivity values normalized to an 8-bit data range (0-255). Low-backscatter is represented by dark tones (low values) and high-backscatter is represented by bright tones (high values). The nodata value is 0. The accuracy of the grey scale values was not checked, but normalizing the values adjusts the image for better viewing.
  2. How accurate are the geographic locations?
    USGS Field Activity 2012-024-FA: Navigation for SWATHplus-M system was acquired with a Coda Octopus F180 Real-time Kinematic Global Positioning System (RTK-GPS); which is accurate to less than 1 meter (typically on the order of centimeters) horizontally. The SWATHplus-M transducers were mounted on a rigid pole on the bow of the R/V Rafael. The RTK-GPS antenna was located on the same pole approximately 2.48 m above the sea surface. Horizontal sounding positions with offsets adjustments were recorded to raw sonar data files (SXR) via SWATHplus acquisition software (version 3.07.17.00).
  3. How accurate are the heights or depths?
  4. Where are the gaps in the data? What is missing?
    Nearly all quality main survey line backscatter data (generally parallel to the river banks) that were collected within the survey area of the Connecticut River were incorporated in this backscatter image. Backscatter from the patch test and line 1 (collected in Long Island Sound) and line 160 (collected in the marina at Old Saybrook) was not processed because they were not part of the study area and are therefore excluded from this image.
    Noisy or poor quality data were not included in the products. Data from some survey lines may have been omitted where they overlapped with equal or better quality data from adjacent lines. Data along tie and transit lines were generally not included in the final products either. The following lines were not used in the backscatter imagery:
    Backscatter from the patch test and line 1 (collected in Long Island Sound) and line 160 (collected in the marina at Old Saybrook) was not processed because they were not part of the study area and are therefore excluded from this image. Lines 118, 119, 133, 159 were gap fill lines that were collected fills reasonable sized holes in the bathymetry dataset. The backscatter coverage is typically greater than that of the bathymetry data using this system and processing method; in this dataset lines 118 and 119 had no backscatter gap; and the gaps near lines 133 and 159 were minimal; so none of these bathymetry gap fill lines were incorporated into the backscatter mosaic. The backscatter data in lines 115, 120, 121, 122, and 134 had relatively poor data quality and were not mosaicked so they would not interfere with decent quality data in adjacent lines.
    Small cross-track gaps occur as a result of the ship pitching and rolling; between-track gaps occur where overlapping swaths were not achieved. These gaps were not filled or interpolated in the backscatter imagery.
    Time gaps occurred during this field activity where no surveying was done due to bad weather, rough seas and stops in surveying for equipment issues. No sonar data were collected on Tuesday 20120918.
  5. How consistent are the relationships among the observations, including topology?
    This GeoTIFF represents interferometric backscatter imagery collected along main survey lines at 1-meter per pixel resolution. Sonar data were nominally collected at 30-meter trackline spacing to ensure nearly 100 percent coverage of the survey area. Gaps may occur along-track and between adjacent lines, especially where the ship had to maneuver to avoid obstacles during surveying. An internal review of the dataset pointed out that nadir was not fully removed from L115f1 during processing.

How can someone get a copy of the data set?

Are there legal restrictions on access or use of the data?
Access_Constraints: None
Use_Constraints:
These data are NOT to be used for navigation. Mariners should refer to the appropriate nautical chart. Public domain data from the U.S. Government are freely redistributable with proper metadata and source attribution. Please recognize the U.S. Geological Survey as the originator of the dataset.
  1. Who distributes the data set? (Distributor 1 of 1)
    Seth Ackerman
    U.S. Geological Survey
    Geologist
    384 Woods Hole Rd.
    Woods Hole, MA
    USA

    508-548-8700 x2315 (voice)
    508-457-2310 (FAX)
    sackerman@usgs.gov
  2. What's the catalog number I need to order this data set? USGS data release 2012-024-FA backscatter imagery from the Connecticut River (2013-003-FA_Backscatter1m.zip). The zip file contains a folder with the an 8-bit GeoTIFF image (2013-003-FA_Backscatter1m.tif) with a world file (2013-003-FA_Backscatter1m.tfw). Metadata files in standard formats are also included in the zip file.
  3. What legal disclaimers am I supposed to read?
    Neither the U.S. Government, the Department of the Interior, nor the USGS, nor any of their employees, contractors, or subcontractors, make any warranty, express or implied, nor assume any legal liability or responsibility for the accuracy, completeness, or usefulness of any information, apparatus, product, or process disclosed, nor represent that its use would not infringe on privately owned rights. The act of distribution shall not constitute any such warranty, and no responsibility is assumed by the USGS in the use of these data or related materials. Any use of trade, product, or firm names is for descriptive purposes only and does not imply endorsement by the U.S. Government.
  4. How can I download or order the data?
  5. What hardware or software do I need in order to use the data set?
    This zip file contains GeoTIFF image file, world file and associated metadata files. To utilize these data an image processing or GIS software package capable of viewing an 8-bit GeoTIFF image is needed.

Who wrote the metadata?

Dates:
Last modified: 18-Mar-2024
Metadata author:
Seth Ackerman
U.S. Geological Survey
Geologist
384 Woods Hole Rd.
Woods Hole, MA
USA

508-548-8700 x2315 (voice)
508-457-2310 (FAX)
whsc_data_contact@usgs.gov
Contact_Instructions:
The metadata contact email address is a generic address in the event the person is no longer with USGS. (updated on 20240318)
Metadata standard:
FGDC Content Standards for Digital Geospatial Metadata (FGDC-STD-001-1998)

Generated by mp version 2.9.50 on Wed Apr 03 15:01:33 2024