PNG formatted images of Edgetech SB-512i chirp seismic-reflection profiles collected by the U.S. Geological Survey along the Delmarva Peninsula, MD and VA, 2014

Metadata also available as - [Outline] - [Parseable text]

Frequently anticipated questions:


What does this data set describe?

Title:
PNG formatted images of Edgetech SB-512i chirp seismic-reflection profiles collected by the U.S. Geological Survey along the Delmarva Peninsula, MD and VA, 2014
Abstract:
The Delmarva Peninsula is a 220-kilometer-long headland, spit, and barrier island complex that was significantly affected by Hurricane Sandy. A U.S. Geological Survey cruise was conducted in the summer of 2014 to map the inner continental shelf of the Delmarva Peninsula using geophysical and sampling techniques to define the geologic framework that governs coastal system evolution at storm-event and longer timescales. Data collected during the 2014 cruise include swath bathymetry, sidescan sonar, chirp and boomer seismic-reflection profiles, acoustic Doppler current profiler, and sample and bottom photograph data. Processed data in raster and vector format are released here for the swath bathymetry, sidescan sonar, and seismic-reflection profiles. More information about the USGS survey conducted as part of the Hurricane Sandy Response-- Geologic Framework and Coastal Vulnerability Study can be found at the project website or on the WHCMSC Field Activity Web pages: https://woodshole.er.usgs.gov/project-pages/delmarva/ and https://cmgds.marine.usgs.gov/fan_info.php?fan=2014-002-FA
  1. How might this data set be cited?
    U.S. Geological Survey, 2015, PNG formatted images of Edgetech SB-512i chirp seismic-reflection profiles collected by the U.S. Geological Survey along the Delmarva Peninsula, MD and VA, 2014: data release DOI:10.5066/F7MW2F60, U.S. Geological Survey, Coastal and Marine Geology Program, Woods Hole Coastal and Marine Science Center, Woods Hole, Massachusetts.

    Online Links:

    This is part of the following larger work.

    Pendleton, Elizabeth A., Ackerman, S.D., Baldwin, W.E., Danforth, W.W., Foster, D.S., Thieler, E.R., and Brothers, L.L., 2015, High-resolution geophysical data collected along the Delmarva Peninsula 2014, U.S. Geological Survey Field Activity 2014-002-FA: data release DOI:10.5066/F7MW2F60, U.S. Geological Survey, Reston, VA.

    Online Links:

  2. What geographic area does the data set cover?
    West_Bounding_Coordinate: -75.567695
    East_Bounding_Coordinate: -74.687529
    North_Bounding_Coordinate: 38.430403
    South_Bounding_Coordinate: 37.538209
  3. What does it look like?
    https://cmgds.marine.usgs.gov/data/field-activity-data/2014-002-FA/data/seismics/512images/512_image.png (PNG)
    Woods Hole Coastal and Marine Science Center 512i image along the Delmarva Peninsula
  4. Does the data set describe conditions during a particular time period?
    Beginning_Date: 18-Jun-2014
    Ending_Date: 22-Jul-2014Currentness_Reference:
    ground condition; data were not collected on 20140702-20140704; 20140709; and 20140714-20140715 due to weather.
  5. What is the general form of this data set?
    Geospatial_Data_Presentation_Form: raster digital data
  6. How does the data set represent geographic features?
    1. How are geographic features stored in the data set?
      This is a Raster data set. It contains the following raster data types:
      • Dimensions, type Pixel
    2. What coordinate system is used to represent geographic features?
      Horizontal positions are specified in geographic coordinates, that is, latitude and longitude. Latitudes are given to the nearest 0.000001. Longitudes are given to the nearest 0.000001. Latitude and longitude values are specified in Decimal degrees. The horizontal datum used is D_WGS_1984.
      The ellipsoid used is WGS_1984.
      The semi-major axis of the ellipsoid used is 6378137.000000.
      The flattening of the ellipsoid used is 1/298.257224.
  7. How does the data set describe geographic features?
    Entity_and_Attribute_Overview:
    The PNG images can be hyperlinked to their shapefile location in ArcGIS. The images show two-way travel time (seconds) on the y-axis and distance along profile (in 10000 shot intervals) on the x-axis.
    Entity_and_Attribute_Detail_Citation: U.S. Geological Survey

Who produced the data set?

  1. Who are the originators of the data set? (may include formal authors, digital compilers, and editors)
  2. Who also contributed to the data set?
  3. To whom should users address questions about the data?
    Elizabeth A. Pendleton
    U.S. Geological Survey
    Geologist
    384 Woods Hole Road
    Woods Hole, MA
    USA

    508-548-8700 x2259 (voice)
    508-457-2310 (FAX)
    ependleton@usgs.gov

Why was the data set created?

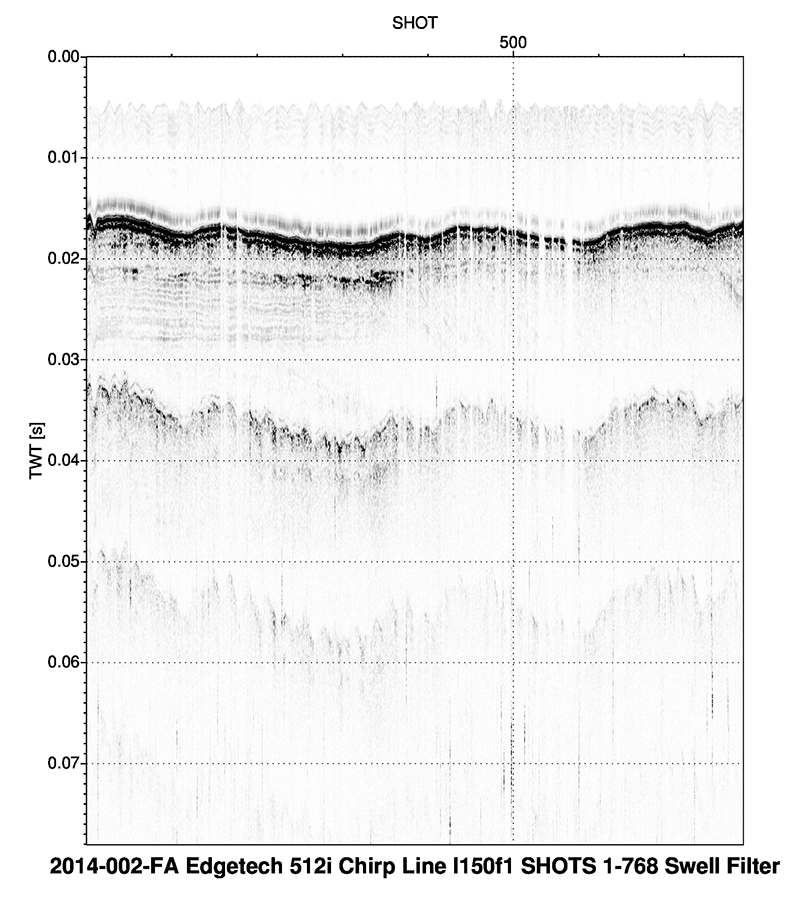
PNG images of each seismic profile were generated in order to incorporate images of the seismic profiles into Geographic Information System (GIS) projects and data archives utilizing HTML. These images represent approximately 4500 km of Edgetech SB-512i chirp seismic-reflection data collected by the U.S. Geological Survey during cruise 2014-002-FA along the Delmarva Peninsula, MD and VA. Each profile image can be hotlinked to its corresponding trackline navigation contained within the Esri polyline shapefile '2014_002_FA_512i_Tracklines.shp'. Even 500 shot index markers along the top of the PNG images correlate to the positions of 500 shot intervals within the Esri point shapefile '2014_002_FA_512i_500sht.shp'.

How was the data set created?

  1. From what previous works were the data drawn?
    SEG-Y and JSF 512i data (source 1 of 1)
    U.S. Geological Survey, 2015, 512i navigation.

    Type_of_Source_Media: disc
    Source_Contribution:
    Chirp seismic data were collected using an EdgeTech Geo-Star FSSB sub-bottom profiling system and an SB-0512i towfish (0.5-12 kHz), which was mounted on a catamaran and towed astern of the M/V Scarlett Isabella. Chesapeake Technologies' SonarWiz (v.5.06.0058) seismic acquisition software was used to control the Geo-Star topside unit, digitally log trace data in the SEG-Y format (32 bit IEEE floating point envelope (single channel)) and analytic (raw) to JSF format, and record GPS navigation coordinates to the SEG-Y trace headers (in arc seconds of Latitude and Longitude, multiplied by a scalar of 100). Data were acquired using a 250 ms shot rate, a 5-ms pulse length, and a 0.5 to 8 kHz frequency sweep. Recorded trace lengths were approximately 180 ms.
  2. How were the data generated, processed, and modified?
    Date: 2014 (process 1 of 2)
    Scripts within SIOSEIS (version 2010.2.25) and Seismic Unix (version 4.2) were used to process SEG-Y data, create navigation files, and plot images. The processing flow and scripts used to produce swell-filtered PNG images are summarized below:
    1. Siorenum was used to read SEG-Y files, renumber shots starting from one, and write out new SEG-Y files. The original shot numbers, which were assigned by SonarWiz sequentially over the duration of an acquisition session despite SEG-Y file changes, are preserved in the raw SEG-Y and JSF data.
    2. Sio_medianstk was used to remove S-boom cross talk (when multi-channel streamer lines were recorded simultaneously: Julian Day 169-178) with a two-trace median stack and improve water bottom picking. This script was used for all lines even after multi-channel streamer was turned off, due to the improvements made to water bottom picks.
    3. Read512i_mstk reads median filtered stacked trace data, saves it as an SU file, extracts raw navigation from SEG-Y headers and writes navigation files.
    4. Plot512i_mstk creates a plot to determine if swell filtering is required. Swell-filtering was applied to all profiles in cruise 2014-002-FA.
    5. Siothresh_mpltwbt and siopeak_pltwbt are used to pick the water bottom using amplitude threshold or peak amplitude, respectively (depending on user determined best pick of water bottom), mute water column noise that could cause problems with bottom picks and a write a water-bottom file with two-way travel time to the seafloor as an ASCII file and Kingdom Suite (version 8.8) Line. Seafloor picks for three lines on JD170: l5f1,l5f2, and t5f2 were not successful with the siothresh and siopeak scripts, so seafloor picks were edited to remove spikes within Kingdom Suite software. Edited water-bottom picks for these lines were exported from Kingdom Suite for swell-filtering
    6. Plot512i_s creates a swell-filtered PNG image using ImageMagick (version 6.6.1) of each seismic line that is 12 inches high. Images show two-way travel time (seconds) along the y-axis (left margin) and distance along profile (in 10,000 shot intervals) on the x-axis (along top of profile). Person who carried out this activity:
    Dave Foster
    U.S. Geological Survey
    Geologist
    384 Woods Hole Rd.
    Woods Hole, MA

    (508) 548-8700x2271 (voice)
    (508) 457-2310 (FAX)
    dfoster@usgs.gov
    Date: 20-Apr-2017 (process 2 of 2)
    The online links to the data were updated to reflect the new server hosting the data. The original data download file (2014-002-FA_512images.zip) was over 5 GB. In order to facilitate downloads, this file was broken into 5 smaller files, each zip file approximately 1 GB in size. Each file contains a portion of the seismic-reflection profile images, the browse graphic, and the CSDGM metadata. The breakdown of the seismic-refleciton profiles is as follows:
    2014-002-FA_512images1of5.zip contains lines 1-22
    2014-002-FA_512images2of5.zip contains lines 23-49
    2014-002-FA_512images3of5.zip contains lines 50-72
    2014-002-FA_512images4of5.zip contains lines 73-106
    2014-002-FA_512images5of5.zip contains lines 107-163 and the tie lines.
    Additionally, other small edits could be made to the metadata, such as modifying http to https where appropriate. The metadata date (but not the metadata creator) was edited to reflect the date of these changes. Person who carried out this activity:
    U.S. Geological Survey
    Attn: VeeAnn A. Cross
    Marine Geologist
    384 Woods Hole Road
    Woods Hole, MA

    508-548-8700 x2251 (voice)
    508-457-2310 (FAX)
    vatnipp@usgs.gov
  3. What similar or related data should the user be aware of?

How reliable are the data; what problems remain in the data set?

  1. How well have the observations been checked?
  2. How accurate are the geographic locations?
    Differential Global Positioning System (DGPS) navigation data were acquired with a Hemisphere receiver and recorded with HYPACK (www.hypack.com). The DGPS antenna was located on the port-side of the acquisition van. The SB-0512i was mounted on a catamaran sled and towed at the sea surface approximately 43 m astern of the M/V Scarlett Isabella. Fish depth below water line was 0.5 meters below catamaran floats. The GPS offset from sheave was x = 8.75 m; y = -43 m; z = 0. Navigation data were sent to SonarWiz (version 5) acquisition application and offsets were recorded in the acquisitions software, which logged the coordinates to individual trace headers SEG-Y and JSF format. Positional accuracy is assumed to be better than 10 m and is primarily related to changes in cable-out and fish and sled motion behind the boat.
  3. How accurate are the heights or depths?
  4. Where are the gaps in the data? What is missing?
    Seismic data were not logged during all turns and transits.
  5. How consistent are the relationships among the observations, including topology?
    Processed seismic data were converted to PNG format for ease of seismic trace display. Quality control was conducted during processing.

How can someone get a copy of the data set?

Are there legal restrictions on access or use of the data?
Access_Constraints: None
Use_Constraints:
Public domain data from the U.S. Government are freely redistributable with proper metadata and source attribution. Please recognize the U.S. Geological Survey as the originator of the dataset.
  1. Who distributes the data set? (Distributor 1 of 1)
    Elizabeth A. Pendleton
    U.S. Geological Survey
    Geologist
    384 Woods Hole Rd.
    Woods Hole, MA

    (508) 548-8700x2259 (voice)
    (508) 457-2310 (FAX)
    ependleton@usgs.gov
  2. What's the catalog number I need to order this data set? USGS data release 2014-002-FA 512i images from the Delmarva Peninsula area has 5 zip files: 2014-002-FA_512images1of5.zip, 2014-002-FA_512images2of5.zip, 2014-002-FA_512images3of5.zip, 2014-002-FA_512images4of5.zip, and 2014-002-FA_512images5of5.zip. The zip files contain folders with a total of 407 PNG images named according to line and file number convention with an _s appended to note swell-filter processing. A browse graphic (512_image.png) and FGDC CSDGM metadata files (2014_002_FA_512i_Images.xml) in four standard formats are also included in each zip file.
  3. What legal disclaimers am I supposed to read?
    Neither the U.S. Government, the Department of the Interior, nor the USGS, nor any of their employees, contractors, or subcontractors, make any warranty, express or implied, nor assume any legal liability or responsibility for the accuracy, completeness, or usefulness of any information, apparatus, product, or process disclosed, nor represent that its use would not infringe on privately owned rights. The act of distribution shall not constitute any such warranty, and no responsibility is assumed by the USGS in the use of these data or related materials. Any use of trade, product, or firm names is for descriptive purposes only and does not imply endorsement by the U.S. Government.
  4. How can I download or order the data?
  5. What hardware or software do I need in order to use the data set?
    These data can be viewed with any PNG image viewing software. The zip files must be uncompressed in order to view the images.

Who wrote the metadata?

Dates:
Last modified: 20-Apr-2017
Metadata author:
Elizabeth Pendleton
U.S. Geological Survey
Geologist
384 Woods Hole Rd.
Woods Hole, MA

(508) 548-8700x2259 (voice)
(508) 457-2310 (FAX)
ependleton@usgs.gov
Metadata standard:
FGDC Content Standards for Digital Geospatial Metadata (FGDC-STD-001-1998)

Generated by mp version 2.9.36 on Thu Apr 20 14:58:20 2017