
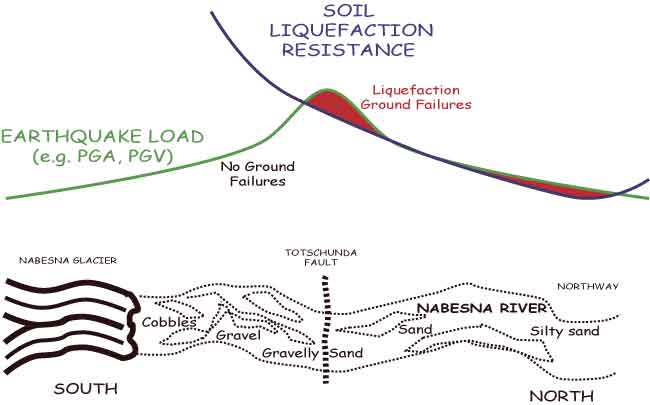
Conceptual diagram of the pattern of intersection of earthquake load and soil liquefaction resistance. On the south side of the fault, rising ground motion intensity intersects falling soil liquefaction resistance: the transition zone into liquefaction is abrupt. On the north side of the fault, ground motion intensity and liquefaction resistance both fall in tandem. Here, liquefaction is observed along the Nabesna River on and off all the way to Northway. Areas where load exceeds capacity result in liquefaction ground failures.
geotech/denaliobs/fig11.html
CONTACT: Robert Kayen
last modified 2018