Liquefaction Potential of Native Ground in West Kobe, Japan by the Spectral Analysis of Surface Waves (SASW) Method
Figure 5
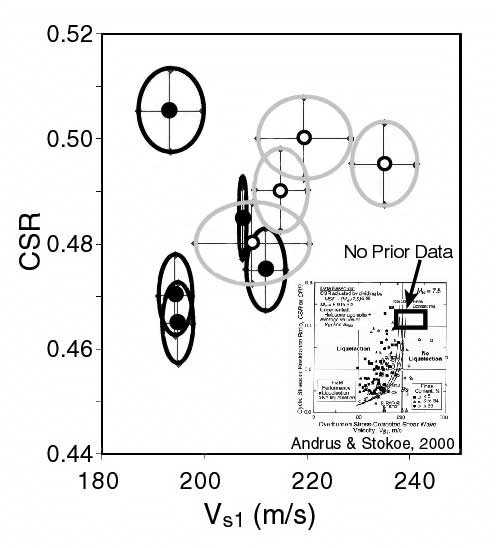
Cyclic stress ratio versus normalized shear wave velocity for the Wadamisaki district sites. The data fall in a high CSR area populated with no prior data. Solid points are the mean velocities of the liquefied layer. Open circles are non-liquefied sites. Ellipses define 1 standard deviation values.
|