USGS PCMSC

Seismic Shear Deformation of Compliant Fine-Grained Soil

Index Abstract Back to home page About these web pages Conclusions earthquake motion study harmonic motion study soil yield strength large strain deformation Earthquake Motion Study
Ground shear displacement plot. Click on figure for enlargement. (32K)

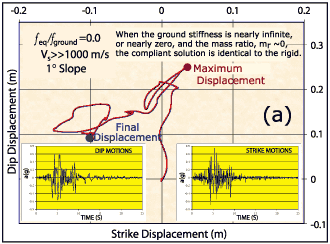
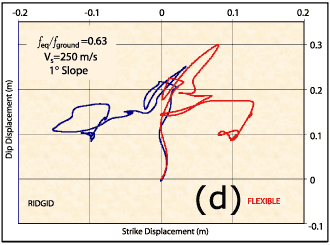
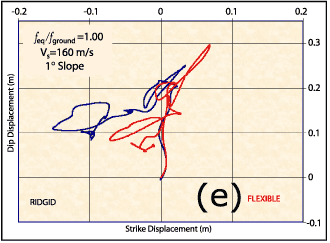
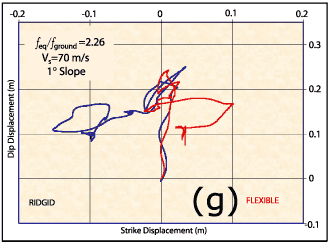
UNDERSTANDING A GROUND SHEAR DISPLACEMENT PLOT: Trajectories for displacement of rigid ground (blue) and compliant (red) ground are plotted above for a 2° slope subjected to the Newhall record. The maximum displacement occurs upslope to the north (~18cm). Downslope ratcheting of the ground ultimately drives the final displacements in the opposite direction (6 and 15 cm). The trajectories map the position of the ground during earthquake shaking. (Note: The modeled flexible displaced ground is 15m tall with Vs= 100m/s, Tground = 1.26 s.). Below is a similar ground displacement plot.

Seismic shear displacement Vs>>1000 m/s Seismic shear displacement Vs=480 m/s
Seismic shear displacement Vs=278 m/s Seismic shear displacement Vs=250 m/s
Seismic shear displacement Vs=160 m/s Seismic shear displacement Vs=105 m/s.
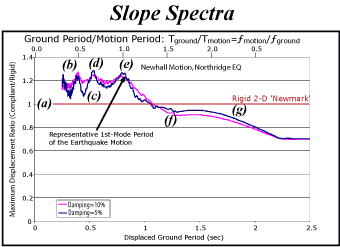
Seismic shear displacement Vs=70 m/s Slope spectra - ground period/motion period.
Click on figure for enlargement. (44K)

geotech/seismicposter/earth.html
contact: Robert Kayen
last modified 2018