|
 |
'It is a notable feature of this displacement that the disturbed material (Tomales Bay mud) moved up the slope instead of down, so that the transfer was not only independent of gravity but opposed to it. The phenomenon, therefore, does not fall in the same category with landslides, and if properly interpreted it may throw light on the mechanics of the earthquake pulses.'
— G.K. Gilbert ( Lawson, et al., 1908)
|
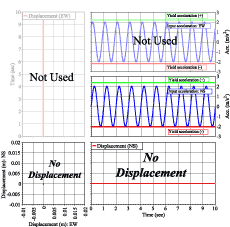
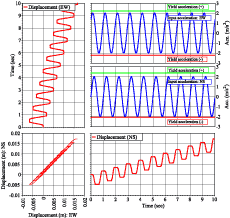
Comparison of Two Methods:
1-D Analysis Under-predicts Displacements!
|
Traditional Single Component
Newmark Analysis:
No Computed Displacement |
|
Our Multi dimensional
Compliant Deformation Analysis |
 |
|
 |
| Click on figure for enlargement (48K) (56K). |
|
 |
Input motions and the natural resonance period of the displaced ground interact affecting the oscillation of the mass and shear stresses at the sliding base. When the shear wave velocity is high and the compliant mass is stiff, the compliant and rigid analyses compute approximately the same displacement. When the natural resonant frequency of the ground is a multiple of the input motion frequency displacments are amplified due to in-phase oscillations of the mass, as in plots (b) and (d). Very soft masses respond almost entirely out of phase with the input motion and dramatically reduce computed displacements relative to the rigid analysis (e).
Click on figure for enlargement (68K).
|
Slope spectra (Kramer 1997) is a plot that presents the compliant maximum displacement normalized by the rigid displacement plotted against (a) the ground period, Tground or (b) the tuning ratio, Tground/Tmotion (same as ƒmotion/ƒground). Amplified deformation due to compliance is noted by normalized displacements >1.0. When Tground/Tmotion exceeds 1.2 (plot e) the harmonic stress-induced displacement falls to 0. Here, soft ground responds almost entirely out of phase (mü1 -müb) with the input motion, reducing the shear stress to 0.5 the rigid analysis stress. When the tuning ratio < 0.1 the stiff compliant upper-mass moves in unison with the base and the displacement is the same as the rigid analysis. -müb) with the input motion, reducing the shear stress to 0.5 the rigid analysis stress. When the tuning ratio < 0.1 the stiff compliant upper-mass moves in unison with the base and the displacement is the same as the rigid analysis. |
 Click on figure (e) for enlargement. Click on figure (e) for enlargement. |
|


 Click on figure (e) for enlargement.

