Coastal Landscape Response to Sea-Level Rise Assessment for the Northeastern United States
- Suggested Citation: Lentz, E.E., Stippa, S.R., Thieler, E.R., Plant, N.G., Gesch, D.B., and Horton, R.M. 2015, Coastal landscape response to sea-level rise assessment for the northeastern United States (ver. 2.0., December 2015): U.S. Geological Survey data release, http://dx.doi.org/10.5066/F73J3B0B.
Abstract: The U.S. Geological Survey has been forecasting sea-level rise impacts on the landscape to evaluate where coastal land will be available for future use. The purpose of this project is to develop a spatially explicit, probabilistic model of coastal response for the Northeastern U.S. to a variety of sea-level scenarios that take into account the variable nature of the coast and provides outputs at spatial and temporal scales suitable for decision support. Model results provide predictions of adjusted land elevation ranges (AE) with respect to forecast sea-levels, a likelihood estimate of this outcome (PAE), and a probability of coastal response (CR) characterized as either static or dynamic. The predictions span the coastal zone vertically from -12 meters (m) to 10 m above mean high water (MHW). Results are produced at a horizontal resolution of 30 meters for four decades (the 2020s, 2030s, 2050s and 2080s). Adjusted elevations and their respective probabilities are generated using regional geospatial datasets of current sea-level forecasts, vertical land movement rates, and current elevation data. Coastal response type predictions incorporate adjusted elevation predictions with land cover data and expert knowledge to determine the likelihood that an area will be able to accommodate or adapt to water level increases and maintain its initial land class state or transition to a new non-submerged state (dynamic) or become submerged (static). Intended users of these data include scientific researchers, coastal planners, and natural resource management communities.
These GIS layers provide a forecast of the adjusted land elevation (AE) with respect to predicted sea-level rise for the Northeastern U.S. for the 2020s, 2030s, 2050s and 2080s. These data are based on the following inputs: sea-level rise, vertical land movement rates due to glacial isostatic adjustment and elevation data. The output displays the most likely of one of five adjusted elevation ranges (-12 to -1, -1 to 0, 0 to 1, 1 to 5, and 5 to 10 m) to be observed for the forecast year as defined by a probabilistic framework (a Bayesian network), and should be used concurrently with the likelihood layer (PAE), which provides users with an estimation of the forecast elevation range occurring when compared with the four other elevation ranges. These data layers primarily show the distribution of adjusted elevation ranges over a large spatial scale and should therefore be used qualitatively.
Data Update History:
January 2015: Data available online with predictions of Northeast Region
December 2015: Metadata process steps were updated to correspond with version 2.0 of the report
| Filename and Description | Preview | FGDC Metadata | Data and Metadata Download |
|---|---|---|---|
Adjusted Elevation: Predicted land elevation (ranges) adjusted with respect to projected mean high water for the 2020s, 2030s, 2050s, and 2080s |
 |
HTML TEXT XML |
NE_region_AE.zip 32.4 MB |
Adjusted Elevation Probability:Likelihoods (probabilities) of observing the adjusted elevation predictions |
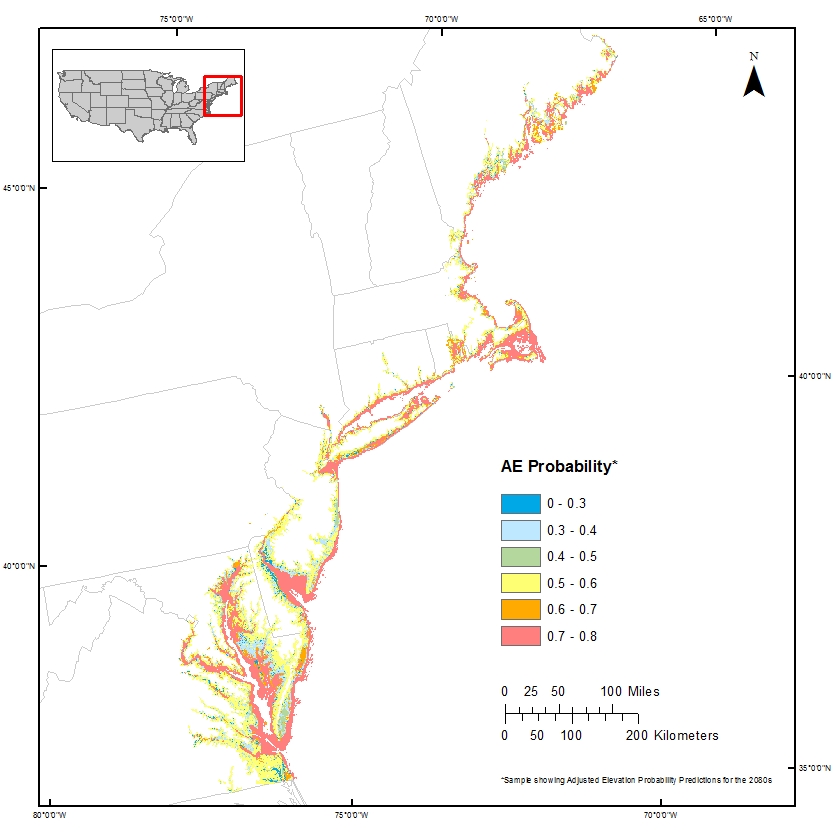 |
HTML TEXT XML |
NE_region_PAE.zip 246.2 MB |
Coastal Response Type Likelihood: Probability of observing either static or dynamic coastal response in the 2020s, 2030s, 2050s, and 2080s. |
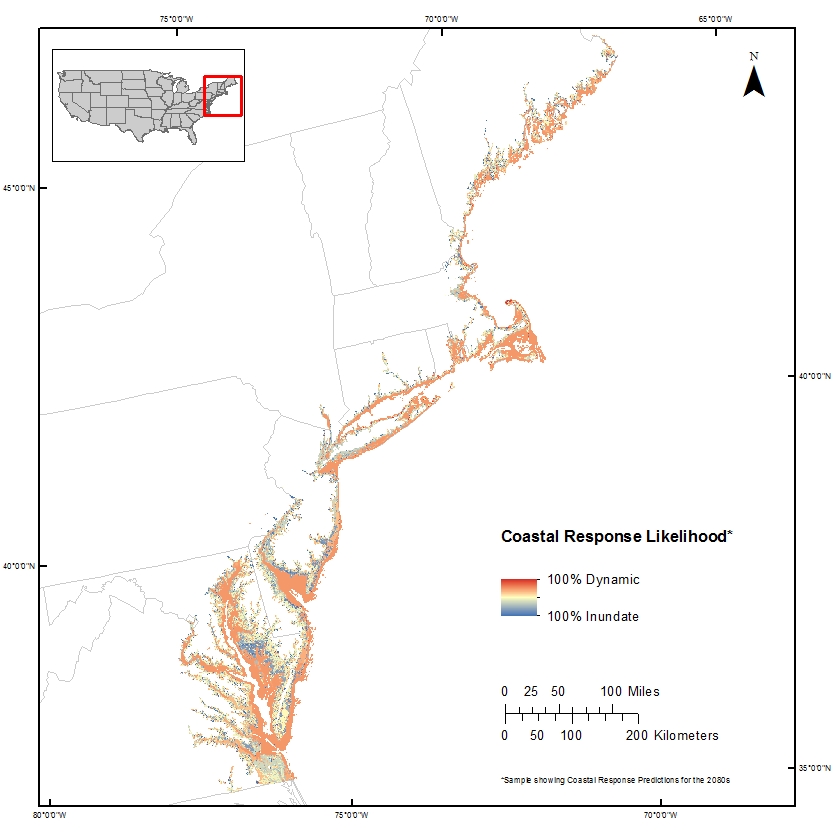 |
HTML TEXT XML |
NE_region_CR.zip 239.2 MB |