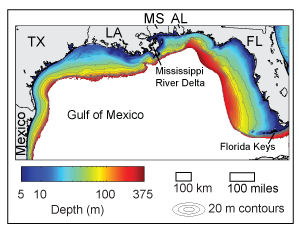
Map showing the bathymetry of the Gulf of Mexico and regional physiographic features. Characterizations of bottom shear stress and sea floor mobility in this database extend offshore to approximately the 120-m isobath. |
U.S. Geological Survey Sea Floor Stress and Sediment Mobility Database: Gulf of Mexico
Publication Date: June 2014
The Gulf of Mexico region extends from the southeast coast of Texas eastward to the Florida Keys. Very shallow regions around the Mississippi River Delta are not resolved.
Spatially and temporally resolved estimates of bottom shear stress are calculated for seasonal and annual time periods. Seasons are defined as Winter (December-February), Spring (March-May), Summer (June-August), and Fall (September-November).
Specifications for stress and mobility time series:
- Spatial Resolution: Approximately 5 km.
- Time Period: May 2010, to May 2011.
- Temporal Resolution: Hourly.
Datasets used to compute the bottom stress and sediment mobility time series:
- Currents: The South Atlantic Bight and Gulf of Mexico Circulation Nowcast/Forecast (SABGOM) model, which uses the Regional Ocean Modeling System (ROMS). The SABGOM domain includes the coastal regions of the South Atlantic Bight and the Gulf of Mexico. These two areas have been split in order to better delineate regions based on similar physical processes and forcing; results presented here are for the Gulf of Mexico only. Developed at North Carolina State University.
Contact: Model run by Dr. Ruoying He, Ocean Observing and Modeling Group. - Waves: Simulating WAves Nearshore (SWAN) model applied to the western North Atlantic.
Contact: Model run by Dr. P. Soupy Dalyander, formerly with U.S. Geological Survey St. Petersburg Coastal and Marine Science Center - Sediment Texture Data: USGS East-Coast Sediment Texture database (Poppe and others, 2005) (https://doi.org/10.3133/ofr20051001)
Complete details on the procedure used to create the data files may be found in the associated metadata
Suggested citation: Dalyander, P.S., Butman, B., Sherwood, C.R., and Signell, R.P., 2012, U.S. Geological Survey sea floor stress and sediment mobility database: U.S. Geological Survey data release, https://doi.org/10.5066/P999PY84.
Statistics of sea floor wave-current stress and sediment mobility in Arc polygon and point shapefile format for the South Atlantic Bight from model output. Stress statistics are determined for the entire model grid, whereas mobility statistics are determined only at locations where sediment texture data are available. See metadata files for details of the calculations. Click on zip file to download.
Data Layer Name and Explanation |
Preview | Metadata | Download |
|---|---|---|---|
Median of Bottom Shear Stress |
 |
GMEX_median.zip | |
Interpercentile Range of Bottom Shear Stress |
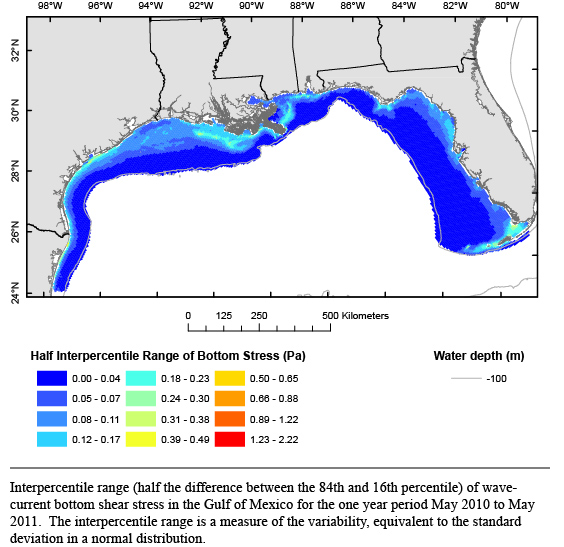 |
HTML FAQ TEXT XML |
GMEX_hIPR.zip |
95th Percentile of Bottom Shear Stress |
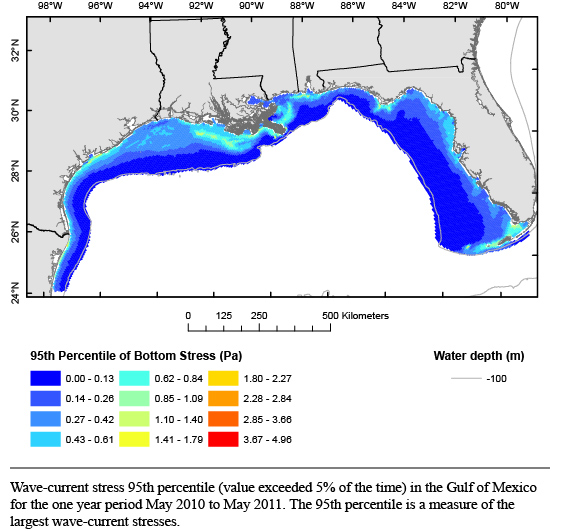 |
HTML FAQ TEXT XML |
GMEX_95th_perc.zip |
Bed Mobility Percentage |
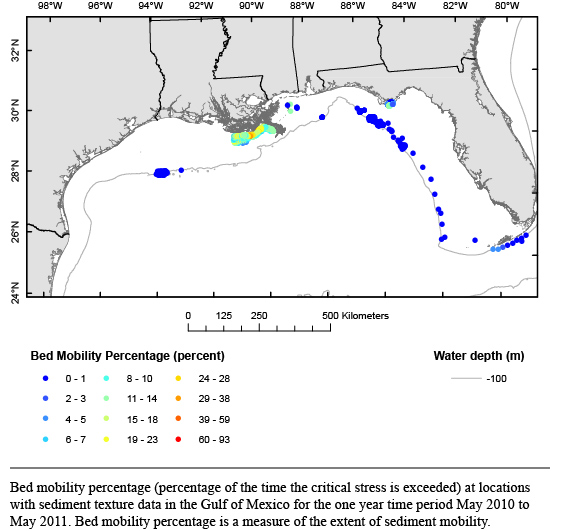 |
HTML FAQ TEXT XML |
GMEX_mobile_perc.zip |
Bed Mobility Recurrence Interval |
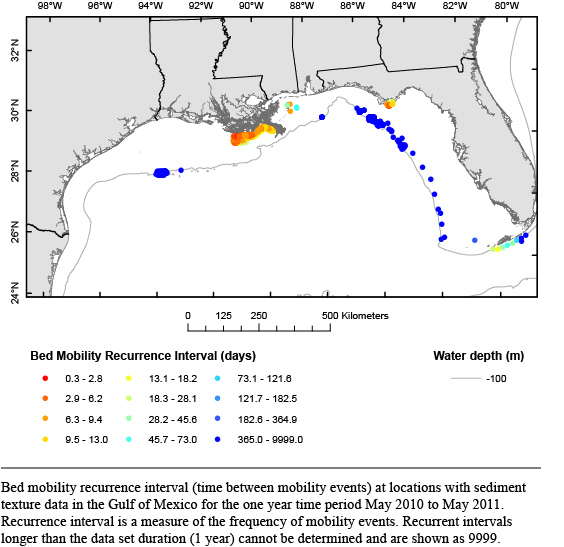 |
HTML FAQ TEXT XML |
GMEX_mobile_freq.zip |