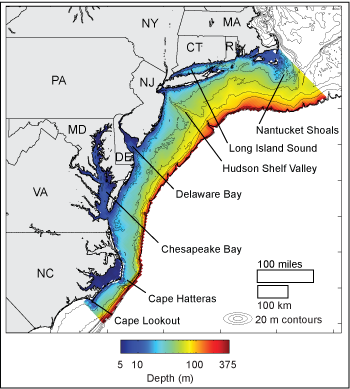
Map showing the bathymetry of the Middle Atlantic Bight and regional physiographic features. Characterizations of bottom shear stress and sea floor mobility in this database extend offshore to approximately the 120-m isobath. |
U.S. Geological Survey Sea Floor Stress and Sediment Mobility Database: Middle Atlantic Bight
Publication Date: November 2012
The Middle Atlantic Bight region extends from Nantucket Shoals off southern New England southward to Cape Lookout off North Carolina.
Spatially and temporally resolved estimates of bottom shear stress are calculated for seasonal and annual time periods. Seasons are defined as Winter (December-February), Spring (March-May), Summer (June-August), and Fall (September-November).
Specifications for stress and mobility time series:
- Spatial Resolution: Approximately 5 km.
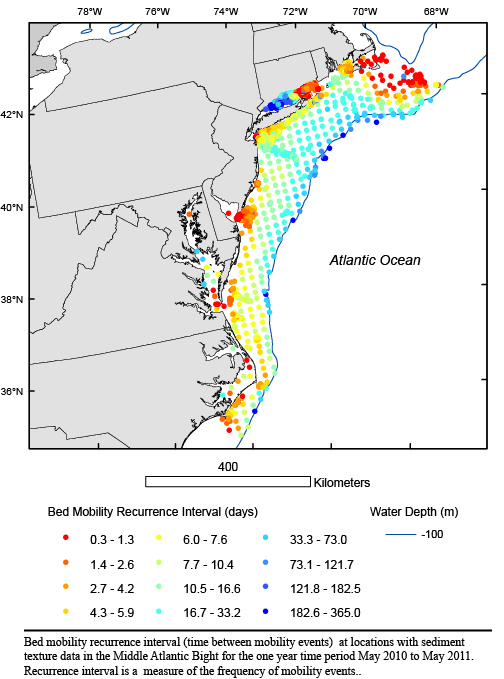
- Time Period: May 2010, to May 2011.
- Temporal Resolution: Hourly.
Datasets used to compute the bottom stress and sediment mobility time series:
- Currents: Experimental System for Predicting Shelf and Slope Optics (ESPreSSO) model, which uses the Regional Ocean Modeling System (ROMS). The ESPreSSO domain covers the Middle Atlantic Bight continental shelf from Cape Cod southward to Cape Hatteras. Developed at Rutgers University (http://www.myroms.org/espresso). Contact: Model run by Dr. John Wilkin, Rutgers Ocean Modeling Group.
- Waves: Simulating WAves Nearshore (SWAN) model applied to the western North Atlantic. Contact: Model run by Dr. P. Soupy Dalyander, formerly with U.S. Geological Survey St. Petersburg Coastal and Marine Science Center
- Sediment Texture Data: USGS East-Coast Sediment Texture database (Poppe and others, 2005) (https://doi.org/10.3133/ofr20051001)
Complete details on the procedure used to create the data files may be found in the associated metadata.
Note: Additional analysis of bottom shear stress and sediment mobility for this domain may be found in: Dalyander, P.S., Butman, B., Sherwood, C.R., Signell, R.P., Wilkin, J.L., 2012, Characterizing wave- and current- induced bottom shear stress—U.S. middle Atlantic continental shelf: Continental Shelf Research (52), p.73-86. Online at https://doi.org/10.1016/j.csr.2012.10.012.
Suggested citation:Dalyander, P.S., Butman, B., Sherwood, C.R., and Signell, R.P., 2012, U.S. Geological Survey sea floor stress and sediment mobility database: U.S. Geological Survey data release, https://doi.org/10.5066/P999PY84.
Statistics of sea floor wave-current stress and sediment mobility in Arc polygon and point shapefile format for the Middle Atlantic Bight from model output. Stress statistics are determined for the entire model grid, whereas mobility statistics are determined only at locations where sediment texture data are available. See metadata files for details of the calculations. Click on zip file to download.
Data Layer Name and Explanation |
Preview | Metadata | Download |
|---|---|---|---|
Median of Bottom Shear Stress |
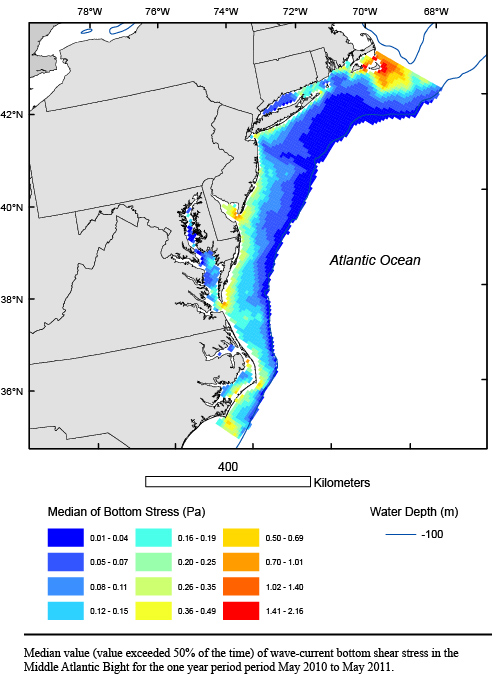 |
MAB_median.zip | |
Interpercentile Range of Bottom Shear Stress |
 |
HTML FAQ TEXT XML |
MAB_hIPR.zip |
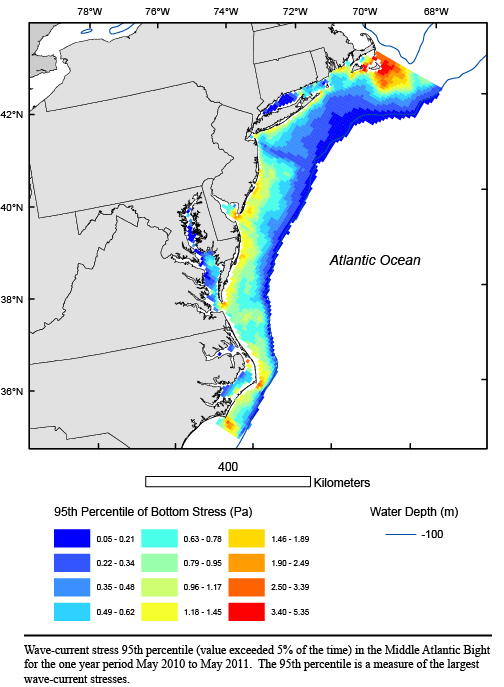
95th Percentile of Bottom Shear Stress |
 |
HTML FAQ TEXT XML |
MAB_95th_perc.zip |
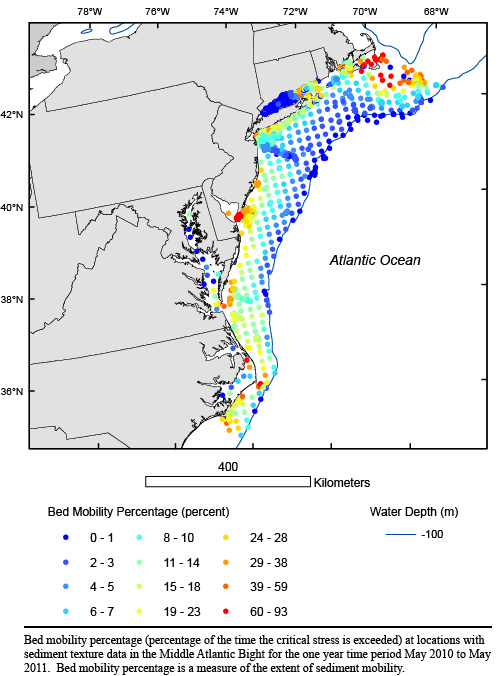
Bed Mobility Percentage |
 |
HTML FAQ TEXT XML |
MAB_mobile_perc_v1_1.zip |
Bed Mobility Recurrence Interval |
 |
HTML FAQ TEXT XML |
MAB_mobile_freq.zip |