AKA: none
Other ID: P-1-89-SF
Status: Completed
Organization(s): USGS, Pacific Coastal and Marine Science Center
Funding Program(s):
Principal Investigator(s): John Chin, Ed Clifton
Affiliate Investigator(s):
Information Specialist(s):
Data Type(s): Sonar: Sidescan, Sonar: Single Beam, Location-Elevation: Navigation
Scientific Purpose/Goals: To study the southern and northern parts of the bay in a manner analogous to that of Rubin and McCulloch (1979) for central SF Bay. To study the surficial characteristics and composition of the bay floor, and how physical processes both form and modify it into different morphologies.
Vehicle(s):
Start Port/Location:
End Port/Location:
Start Date: 1989-01-01
End Date: 1989-01-01
Equipment Used: Kleinsidescan, 200khz, radar
Information to be Derived: Tracklines were plotted on overlays of the 1:40,000-scale National Ocean Survey bathymetric maps of San Francisco Bay (Sheets 1, 2, 3). Maps of the distribution of bedforms.
Summary of Activity and Data Gathered: Reconnaissance investigation characterizes the surficial morphology of the bay floor as revealed by side-scan sonar imaging and high-resolution bathymetry and deduces the general nature of sedimentation, bedload sediment transport directions, and areas of depostion versus erosion. Results should apply to current issues involving sedimentation, dredging, pollution, and the disposal of dredge spoils in the San Francisco Bay system and the highly developed urban areas that border it. Field work for this study was conducted using the USGS Water Resources Divsion Research Vessel Polaris. Side-scan sonar profiles were collected using a Klein system operated at a frequency of either 100 kHz (South Bay or 500 kHz (North Bay). This system is comprised of a graphic recorder and towfish that can be operated at varying frequencies and slant ranges. In general, slant ranges of 100 m (200-m swath) or 150 m (300-m swath) were used for optimum resolution of bottom features on the bay floor. Towing speed averaged 7.4 km/hour, although this varied greatly with tidal current speed and direction as well as local wind regime. No attempt was made to acqurie overlapping side-scan sonar images. An Innerspace fathometer was used to acquire high resolution bathymetry. This system operated at a frequency of 200 kHz with a hull-mounted transducer. The bathymetry was not corrected for tidal elevation. Navigation was obatined with a shipboard Raytheon precision radar. Fixes were plotted every 5 min. and correspond to the event marks on the side-scan sonar and fathometer records. The floor of South and North San Francisco Bay is characterized by five surficial bottom types based on a reconnaissance survey using side-scan sonar and a fathometer. The five bottom types are 1) furrows, 2) lineations, 3) sand waves, 4) tonal patches, 5) featureless.
Staff:
Affiliate Staff:
Notes:
Staff information imported from InfoBank
John Chin (USGS Western Region) - Chief Scientist
Ed Clifton (USGS Western Region) - Chief Scientist
Location:
California
| Boundaries | |||
|---|---|---|---|
| North: 38.25 | South: 37.25 | West: -123.25 | East: -121.25 |
Platform(s):
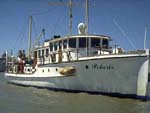 Polaris I |
| Survey Equipment | Survey Info | Data Type(s) | Data Collected |
|---|---|---|---|
| Kleinsidescan | --- | Sidescan | |
| 200khz | --- | Single Beam | |
| radar | --- | Navigation |
