Descriptive and Interpretive Measures
 Folk classification scheme
 |

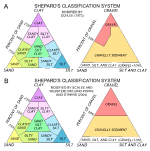
Shepard classification scheme
|
Raw grain-size data are typically in the form of weight percentages of
sediment in various size classes. Because many analyses and commonly
more than one data set are involved in geological studies, the method by
which these data are presented and compared becomes important when
determining how the distributions differ and the magnitude of the
differences (Royse, 1970). Both graphical and statistical methods are
available. One of the more common graphing techniques is to plot the
basic sand, silt and clay percentages on equilateral triangular
diagrams. This means of data presentation is simple and facilitates
rapid classification of sediments and comparison of samples. The sedimentation laboratory at the Woods Hole Coastal and Marine Science Center uses the Folk (1954, 1956, 1974) and Shepard (1954; as modified by Schlee and Webster [1967], Schlee [1973], and Poppe and others [2004]) ternary classification systems. Results for Folk and Shepard systems are calculated with the program SEDCLASS; results for the Shepard system are also calculated with the program GSSTAT.
The statistical measures of size distributions used by geologists are most commonly based on quartile measures (Trask, 1932), graphics (Inman, 1952; Folk and Ward, 1957; Folk, 1974), or the method of moments (Krumbein and Pettijohn, 1938; Kane and Hubert, 1962; Sawyer, 1977). Inclusive graphics statistics (Folk, 1974), one of the methods utilized by the program GSSTAT provided herein, are graphical in that the data are read directly from a computer-drawn cumulative-frequency curve at five points (the 5, 16, 50, 84, and 95 percentiles). Verbal equivalents for standard deviation, skewness, and kurtosis based on the inclusive graphics statistics. The percentages of gravel, sand, silt, and clay, and the modified frequency percentages for size distributions ranging from 11 phi (or 13 phi using extrapolation routines available with the programs CLAYES2K and GSSTAT) to -5 phi are also computed. Method of moments statistics, which involve more complicated arithmetic calculations and account for every grain in the distribution, gained popularity with the increasing availability of personal computers. The method of moments statistics generated with the program GSSTAT (provided herein) includes arithmetic mean, median, standard deviation, skewness, and kurtosis. However, in open-ended distributions (truncated distributions or where a lot of material occurs in a pan fraction of unknown size), use of the method of moments statistics may not be justified (Folk, 1974).
Modifications Since 2005:
Since 2005, GSSTAT, which runs under Windows XP/7, has replaced GSTAT as the primary program used to generate statistical measures of sediment grain size. Also, the program SEDPLOT was introduced, allowing users to plot the results of grain-size analyses on the ternary diagrams of Folk (1974) and Shepard (1954; as modified by Schlee and Webster [1967], Schlee [1973 and Poppe and others [2004]).
|

![]()