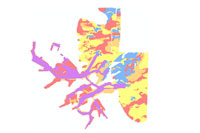
bottomtype: Defined Map Units of the seafloor of Boston Harbor and Approaches | |
Data format: Shapefile File or table name: bottomtype Coordinate system: Universal Transverse Mercator Theme keywords: U.S. Geological Survey, USGS, Coastal and Marine Geology Program, CMGP, Woods Hole Science Center, WHSC, Massachusetts Office of Coastal Zone Management, CZM, Seafloor, Marine Geology, field activity serial number RAFA04019, Interpretation, Bathymetry, Backscatter, Slope, Topography, National Oceanic and Atmospheric Administration, NOAA, National Ocean Service, NOS, NOAA Ship Whiting, Hydrographic Survey, ESRI Shapefile, Bottom Type, oceans and estuaries, geoscientificinformation |
|
Abstract:
This data is a qualitatively-derived interpretative polygon shapefile defining the bottom types of the seafloor from Boston Harbor and the harbor approaches, Massachusetts. Approximately 170 km² of sidescan sonar and bathymetric data were collected by the National Oceanic and Atmospheric Administration (NOAA) Ship Whiting in 2000 and 2001 and reprocessed and gridded by the Massachusetts Office of Coastal Zone Management (CZM) and the U.S. Geological Survey (USGS). |
Metadata elements shown with blue text are defined in the Federal Geographic Data Committee's (FGDC) Content Standard for Digital Geospatial Metadata (CSDGM). Elements shown with green text are defined in the ESRI Profile of the CSDGM. Elements shown with a green asterisk (*) will be automatically updated by ArcCatalog. ArcCatalog adds hints indicating which FGDC elements are mandatory; these are shown with gray text.
This data is a qualitatively-derived interpretative polygon shapefile defining the bottom types of the seafloor from Boston Harbor and the harbor approaches, Massachusetts. Approximately 170 km² of sidescan sonar and bathymetric data were collected by the National Oceanic and Atmospheric Administration (NOAA) Ship Whiting in 2000 and 2001 and reprocessed and gridded by the Massachusetts Office of Coastal Zone Management (CZM) and the U.S. Geological Survey (USGS).
The geophysical dataset were collected by the National Oceanic and Atmospheric Administration (NOAA) National Ocean Service (NOS) branch as part of their periodic hydrographic mapping for nautical charting. The raw datasets were provided by NOAA to the Massachusetts Office of Coastal Zone Management (CZM) and the U.S. Geological Survey (USGS) in Woods Hole, MA as part of a cooperative agreement to provide high resolution bathymetry and backscatter intensity maps and digital GIS information for resource management, scientific research, industry and the public.
ground condition
Public domain data from the U.S. Government are freely redistributable with proper metadata and source attribution. Please recognize the U.S. Geological Survey (USGS) as the source of this information.
384 Woods Hole Rd.
The original geophysical data for this project were collected during four hydrographic surveys conducted by NOAA NOS in 2000 and 2001 on the NOAA Ship Whiting and its launches 1005/1014. Multibeam bathymetric data were acquired with a Reson SeaBat 8101 and sidescan sonar backscatter data were acquired with Edgetech model 272-T (100 kHz) or the Klein T-5500 (455 kHz) sonar systems. The NOAA acquisition vessels were also equipped with Odom Echotrac DF3200 MKII echosounders that logged high-frequency (100 kHz) vertical-beam soundings concurrently throughout the sidescan sonar and multibeam bathymetry surveying operations. Vertical-beam soundings were recorded in Hypack raw format and later converted to CARIS HDCS format. The NOAA Office of Coast Survey cleaned and merged the data and performed tide corrections using CARIS HIPS.
The study area was separated into six units based on local bottom slope, backscatter intensity, surficial sediment texture and anthropogenic activity. These units were delineated qualitatively at a scale of 1:30,000 in areas where both new sidescan sonar and bathymetric data are available (about 155 km2, the source data sets were derived from the datasets described in the previous process step). A local bottom slope was calculated from the 30-m gridded bathymetry as the average slope between the central pixel and the surrounding 8 pixels. Areas smaller than about 200 meters were not delineated. The shapefile was created in ArcGIS 9.1 (ArcMap) by alternating the hillshade, slope and backscatter rasters overlay and manually drawing polygons for the regions representing the six classes of defined bottom type.
c/o U.S. Geological Survey
384 Woods Hole Rd.
Internal feature number.
ESRI
Feature geometry.
ESRI
Classification ID number
Seafloor map unit name (see Open File Report 2006-1008 for full description of each zone)
Area (in square kilometers) of each zone in the survey area
c/o U.S. Geological Survey
384 Woods Hole Rd.
Although this data set has been used by the U.S. Geological Survey (USGS), no warranty, expressed or implied, is made by the USGS as to the accuracy of the data and/or related materials. The act of distribution shall not constitute any such warranty, and no responsibility is assumed by the USGS in the use of these data or related materials. Any use of trade, product, or firm names is for descriptive purposes only and does not imply endorsement by the U.S. Government.
ESRI Polygon Shapefile
c/o U.S. Geological Survey
384 Woods Hole Rd.