
Woods Hole Science Center
Sidescan-Sonar Imagery and Surficial Geologic Interpretations of the Sea Floor in Central Rhode Island Sound
![]() Title |
Introduction |
Geologic Setting |
Data Acquisition/Processing |
Bathymetry |
Seismic Reflection Data |
Sidescan Sonar Imagery |
Environments |
Discussion |
Summary |
GIS Data Catalog |
Acknowledgments |
References |
Figures |
Contacts
Title |
Introduction |
Geologic Setting |
Data Acquisition/Processing |
Bathymetry |
Seismic Reflection Data |
Sidescan Sonar Imagery |
Environments |
Discussion |
Summary |
GIS Data Catalog |
Acknowledgments |
References |
Figures |
Contacts
 |
||
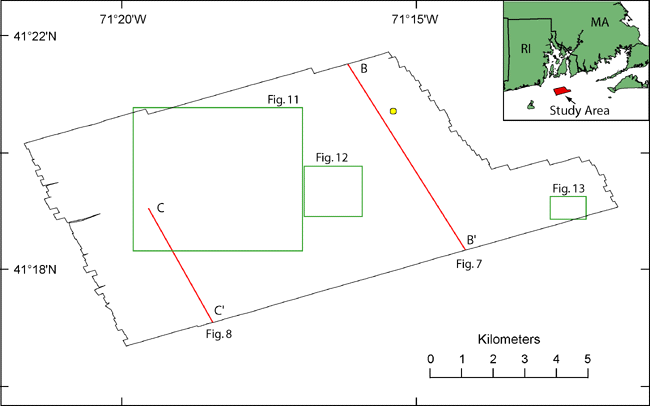
Figure 2. Map showing the outline of the study area (black outline), locations of historic seismic-reflection data shown in figures 7 and 8 (red lines), the locations of detailed views shown in figures 11, 12, and 13 (green outlines), and the location of a sand sample (yellow circle) from the NOS Hydrographic Database (Poppe and others, 2003). | ||

