| Identifier | 2010-012-FA | ||||||||
|---|---|---|---|---|---|---|---|---|---|
| Purpose | High-resolution seismic, swath bathymetry, and sidescan sonar mapping of the inner shelf off the Mississippi Barrier islands to map the geologic framework and assess the extent of offshore sand deposits. | ||||||||
| Location | Gulf of America (Gulf of Mexico), North America, North Atlantic, | ||||||||
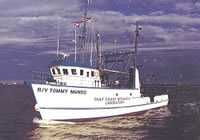
| Summary | A cruise aboard the R/V TOMMY MUNRO was conducted March 1-17, 2010 by the Woods Hole Science Center. The purpose of the cruise was to collect swath bathymetry, sidescan sonar imagery and high-resolution chirp seismic profiles to define the sea floor morphology and the shallow stratigraphy of the inner shelf offshore of a string of barrier islands in the northern Gulf of America (Gulf of Mexico) along the Mississippi coast. The scientific goals of the project were twofold: 1) to better understand the geologic evolution of this coastal region, and 2) to provide stratigraphic information to the U.S. Army Corps of Engineers for an assessment of sand resources that they are compiling for the region. The cruise was hampered by less-than-ideal weather conditions. Data were collected during the following days: 3-9 March, 11-12 March, 14-16 March. During the cruise seismic data were collected along 1778 km of survey tracklines, swath bathymetry along 1418 km of survey tracklines, and sidescan imagery along 1332 km of survey tracklines. Preliminary processing was completed in the field on all three data types. The quality of the chirp and bathymetry data was excellent. During the initial part of the cruise, the sidescan imagery was of inferior quality because of ship noise. The location of the sidescan vehicle was moved from the port side to the stern of the ship during the first port call, and the quality improved significantly. For the lower quality imagery, processing procedures were modified to minimize the ship noise. | ||||||||
| Platform |
|
||||||||
| Itinerary |
|
||||||||
| Bounds |
|
| Organization |
384 Woods Hole Road
Quissett Campus
Woods Hole, MA02543-1598
(508) 548-8700
|
||||||||||||||
|---|---|---|---|---|---|---|---|---|---|---|---|---|---|---|---|
| Principal investigators | David C Twichell | ||||||||||||||
| Crew members |
|
||||||||||||||
| Information specialist(s) |
|
||||||||||||||
| Affiliate staff | Dana Wiese, USGS-St. Petersburg |
| Data category: | Location-Elevation, Seismics, Sonar |
|---|---|
| Data type: | Interferometric, Navigation, Sub Bottom Profiler, Sidescan, Sound Velocity |
| Equipment | Usage description | Data types | Datasets |
|---|---|---|---|
| HYPACK | Navigation | 2 | |
| Klein 3000 | Sidescan | 1 | |
| Sensor - SVP | Sound Velocity | (no data reported) | |
| SEA SWATHplus-M 234 kHz | Interferometric | 1 | |
| Edgetech chirp subbottom profiler 512i | Sub Bottom Profiler | 2 |
| Dataset name | Equipment | Description | Dataset contact |
|---|---|---|---|
| 2010-012-FA-LN-001 | HYPACK | Hypack navigation data | Elizabeth P Pendleton |
| 2010-012-FA-LN-001-01 | HYPACK | These raw navigation data are included as an archive documenting the survey area surrounding the Elizabeth Islands, Massachusetts and the instrumentation used to manage the ship's navigation. | Elizabeth P Pendleton |
| 2010-012-FA-SO-001-01 | Klein 3000 | XSonar/ShowImage software was used to correct for geometric and radiometric distortions in the raw sidescan data (Danforth, 1997), and PCI Geomatica (version 10.1) software was used to create georeferenced mosaics of the final, processed data. Gray-scale GeoTIFF images of the mosaics were produced at 1-m resolution. Sidescan-sonar data were acquired along approximately 1,750 km of tracklines during the 2010 cruises, yielding a total mosaic area of about 260 km2. | Elizabeth P Pendleton |
| 2010-012-FA-BA-001-01 | SEA SWATHplus-M 234 kHz | CARIS (2010), a swath-bathymetry-processing software package, was used to post-process the bathymetric soundings. Sounding data were rectified for ship motion, and spurious soundings were eliminated. Corrections for sound velocity changes within the water column and tidal offsets (utilizing a NOAA discrete tidal zoning model and tidal observations from two Mississippi tide stations) were also applied to the soundings. Final soundings were referenced to mean lower low water (MLLW) vertical datum. Processed soundings from approximately 1,800 km of tracklines yielded a final bathymetric surface area of about 265 km2, which was gridded at a resolution of 50 m/pixel. | Elizabeth P Pendleton |
| 2010-012-FA-SE-001-01 | Edgetech chirp subbottom profiler 512i | SIOSEIS (SIOSEIS, 2007), Seismic Unix (Stockwell and Cohen, 2010) and SeisVision (Halliburton, 2010) were used to postprocess the raw Chirp seismic-reflection data. Navigation data were inspected and edited, static corrections were applied to correct for fish depth beneath the sea surface, seafloor reflections were identified by peak amplitude, and sea-surface heave was removed. Final trace data, plotted as PNG images, and geo-located trackline files are presented in this report. | Elizabeth P Pendleton |
| Chirp seismic data | Edgetech chirp subbottom profiler 512i | Linda P McCarthy |