| Underwater video observations offshore of Tacoma, Washington |
underwater video |
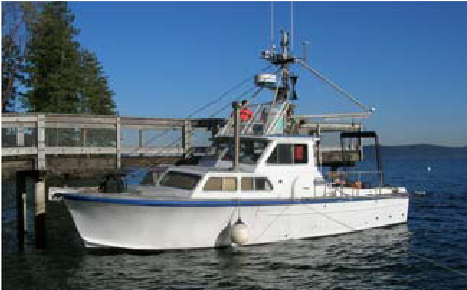
This part of USGS Data Series 935 (Cochrane, 2014) presents observations from underwater video collected in the Offshore of Tacoma, Washington, map area, a part of the Southern Salish Sea Map Series. To validate the interpretations of sonar data in order to turn it into geologically and biologically useful information, the U.S. Geological Survey (USGS) towed a camera sled over specific locations throughout the Tacoma map area to collect video and photographic data that would 'ground truth' the seafloor. The ground-truth survey conducted in the Tacoma map area occurred in 2009 and 2011 on the R/V Karluk (USGS field activity K109PS, and K0111PS) and on the Washington State Department of Fish and Game R/V Molluscan in 2011 and 2012 (USGS field activity M0111PS, M0112PS, and M0212PS). The camera sled was towed 1 to 2 m above the seafloor at speeds of between 1 and 2 nautical miles/hour. The surveys for this map area includes approximately 30 hours (47 trackline km) of video. |
Guy R Cochrane |
| CMECS geoform, substrate, and biotopes offshore of Tacoma, Washington |
underwater video |
This part of USGS Data Series 935 (Cochrane, 2014) presents substrate, geomorphic, and biotope data in the Offshore of Tacoma, Washington, map area, a part of the Southern Salish Sea Habitat Map Series. Given the variable bathymetric resolution, the complex geologic history of the region, and the lack of acoustic backscatter data, automated and semi-automated classification schemes of classifying seafloor substrate and geoform were deemed to have very low accuracy. Instead, classification of these properties was performed manually following the Coastal and Marine Ecological Classification Standard (CMECS, Federal Geographic Data Committee, 2012) using observations from underwater video footage.
The best overall predictors of biotic assemblage were used to generate the CMECS biotopes. However, the nature of the biological data gathered makes it difficult to define clear biotopes. It was difficult to see or identify many organisms in the underwater video, and with an average of only 3-4 taxa identified per sampling unit, it is hard to characterize biotic assemblages. Some biological clusters of taxa were identified statistically for multiple map areas, and within each area, some of these groupings were found at consistent depths and/or with predictable substrates. The maps are not fine-grained enough to capture the physical variation seen within one-minute video units. Depth zones in the biotope map are based on Dethier (1992). |
Guy R Cochrane |
| Underwater video observations offshore of Burien, Washington |
underwater video |
This part of USGS Data Series 935 (Cochrane, 2014) presents observations from underwater video collected in the Offshore of Burien, California, map area, a part of the Southern Salish Sea Habitat Map Series. To validate the interpretations of multibeam sonar data and turn it into geologically and biologically useful information, the U.S. Geological Survey (USGS) towed a camera sled over specific locations throughout the Seattle map area to collect video and photographic data that would “ground truth” the seafloor. The ground-truth survey conducted in the Offshore of Burien map area occurred in 2011 on the R/V Karluk (USGS field activities K0109WO, K0111PS) and on the Washington State Department of Fish and Game R/V Molluscan (USGS field activity M0112PS, M0111PS, M0212PS). The underwater camera sled was towed 1 to 2 m above the seafloor at speeds of between 1 and 2 nautical miles/hour. The surveys for this map area include approximately 6 hours (9.1 trackline km) of video. |
Guy R Cochrane |
| CMECS geoform, substrate, and biotopes offshore of Burien, Washington |
underwater video |
This part of USGS Data Series 935 (Cochrane, 2014) presents substrate, geomorphic, and biotope data in the Offshore of Burien, Washington, map area, a part of the Southern Salish Sea Habitat Map Series. Given the variable bathymetric resolution, the complex geologic history of the region, and the lack of acoustic backscatter data, automated and semi-automated classification schemes of classifying seafloor substrate and geoform were deemed to have very low accuracy. Instead, classification of these properties was performed manually following the Coastal and Marine Ecological Classification Standard (CMECS, Madden and others, 2009) using observations from underwater video footage.
The best overall predictors of biotic assemblage were used to generate the CMECS biotopes. However, the nature of the biological data gathered makes it difficult to define clear biotopes. It was difficult to see or identify many organisms in the underwater video, and with an average of only 3-4 taxa identified per sampling unit, it is hard to characterize biotic assemblages. Some biological clusters of taxa were identified statistically for multiple map areas, and within each area, some of these groupings were found at consistent depths and/or with predictable substrates. The maps are not fine-grained enough to capture the physical variation seen within one-minute video units. Depth zones in the biotope map are based on Dethier (1992). |
Guy R Cochrane |