USGS Coastal and Marine Hazards and Resources Program
Previews of 2006 Continuous Resistivity ProfilesThe table below contains previews of the 2006 resistivity profiles processed with a water-resistivity value of 0.2 ohm-m. Both the EarthImager short JPEG image and the Matlab JPEG image for each processed file are presented. In addition, the trackline map below is a clickable map. By clicking on a line name, a new window will open with the processed images from that particular line segment. This includes the Matlab JPEG image as well as a reduced version of one of the EarthImager JPEG images. The beginning of each line is shown on the map with a triangle which corresponds to the left side of the associated JPEG images. All versions of the processed JPEG images, including the longer version output from the EarthImager processing, can be downloaded from the Data Catalog page.
|
Preview of Profiles: Data collected February 28, 2006 (click individual images to see enlarged versions).
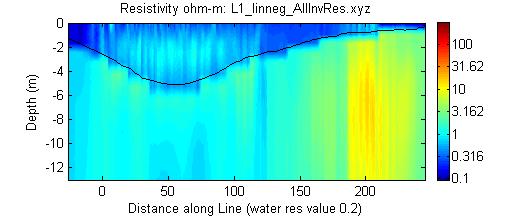
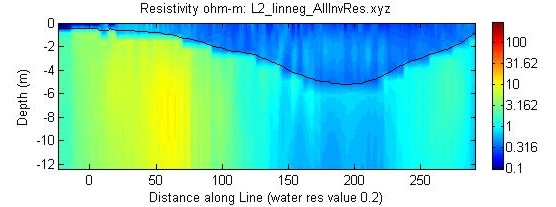
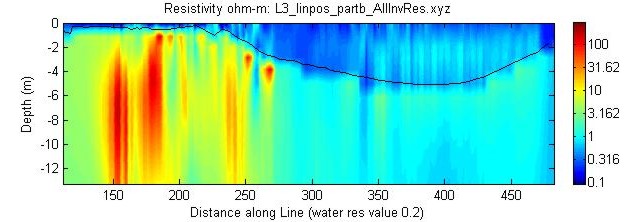
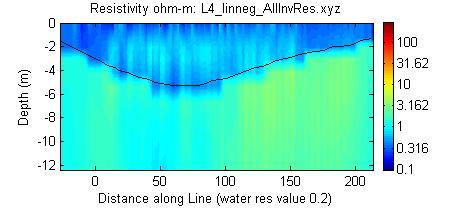
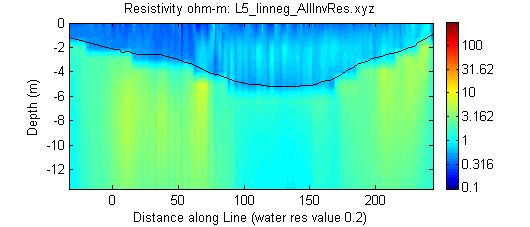
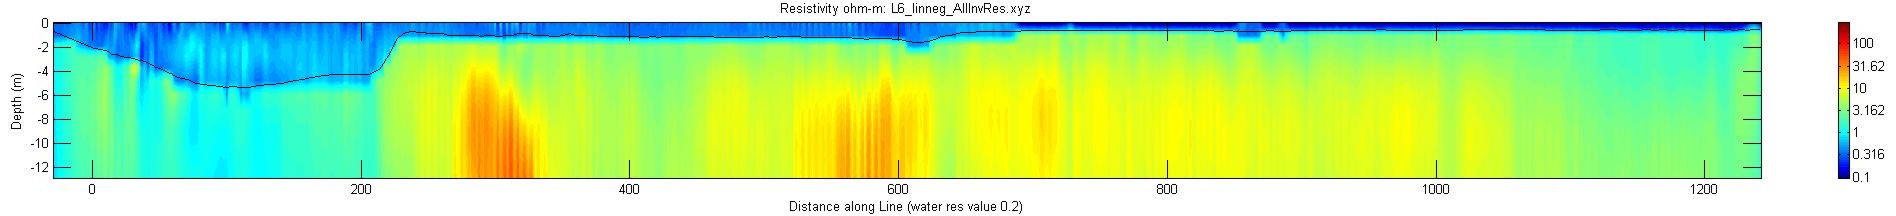
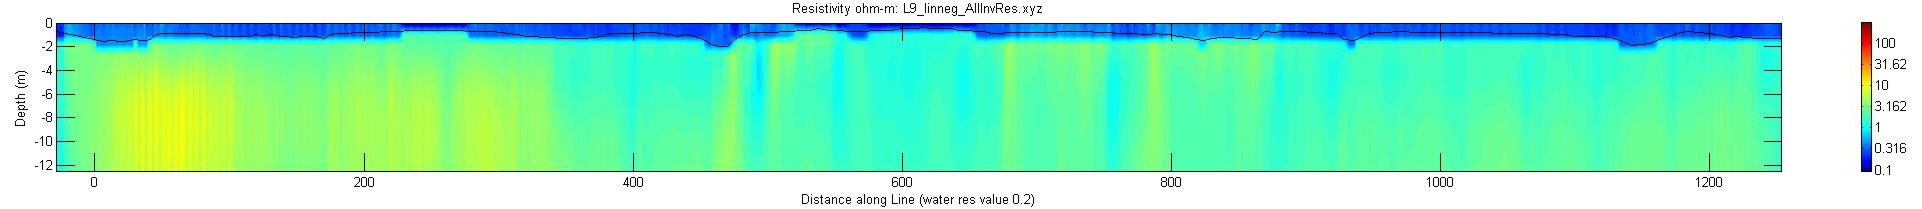
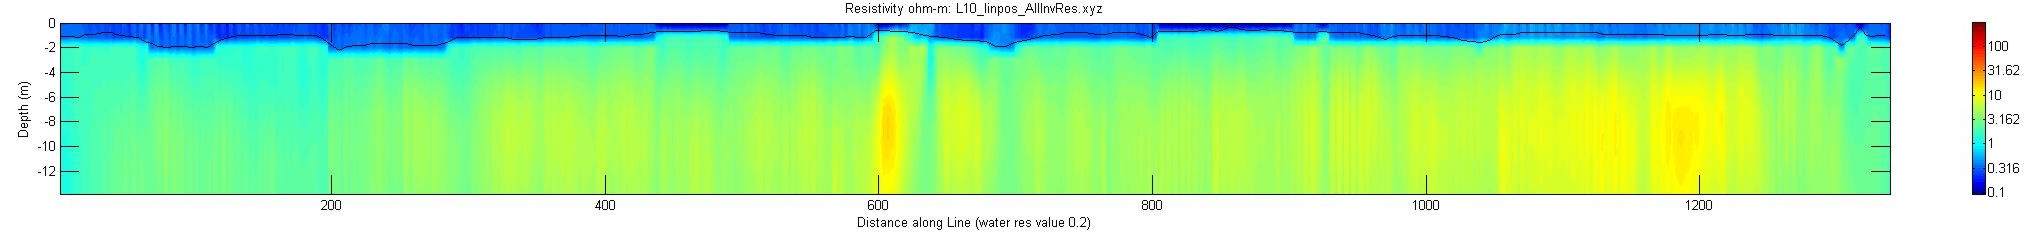
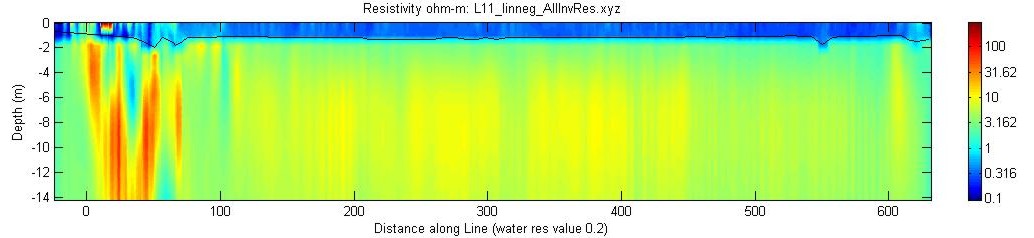
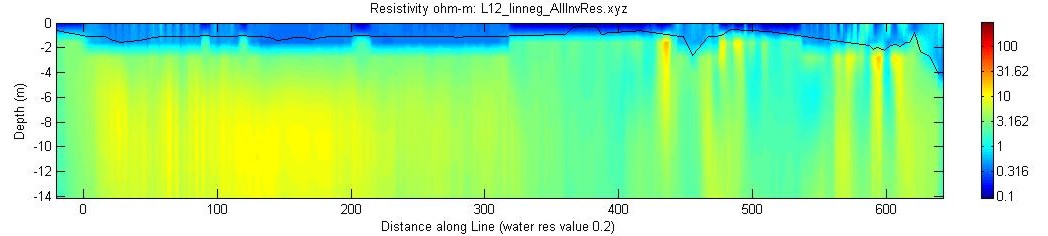
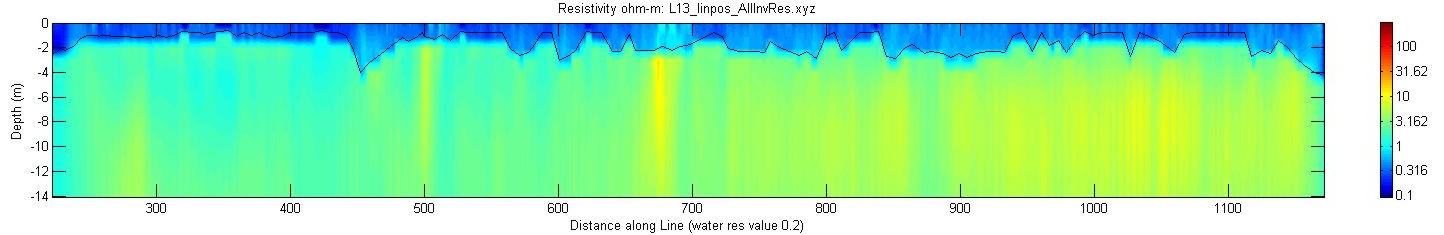
All profiles were created using a measured averaged water-resistivity value of 0.2 ohm-m for each line during processing. The white or black line in the image is the water depth as measured by the fathometer. The JPEG images resulting from the EarthImager 2D processing were saved with the default color scale generated by the software. This color scale ranges from blues to reds with the reds representing the higher resistivity values corresponding to fresher ground water. Each individual image has the scale maximized for the range of resistivity values in that data set. The Matlab versions of the JPEG images use a common color scale for all the files to facilitate profile comparison. For these images, the polarity of the color scheme is the same as that of the EarthImager 2D JPEGs in that the colors range from blue to red with the reds indicating higher resistivity values. In the Matlab version, the X-axis represents distance along line in meters. The EarthImager version X-axis uses latitude and longitude values along line.
| EarthImager version | Matlab version |
Feb. 28, 2006: Line L1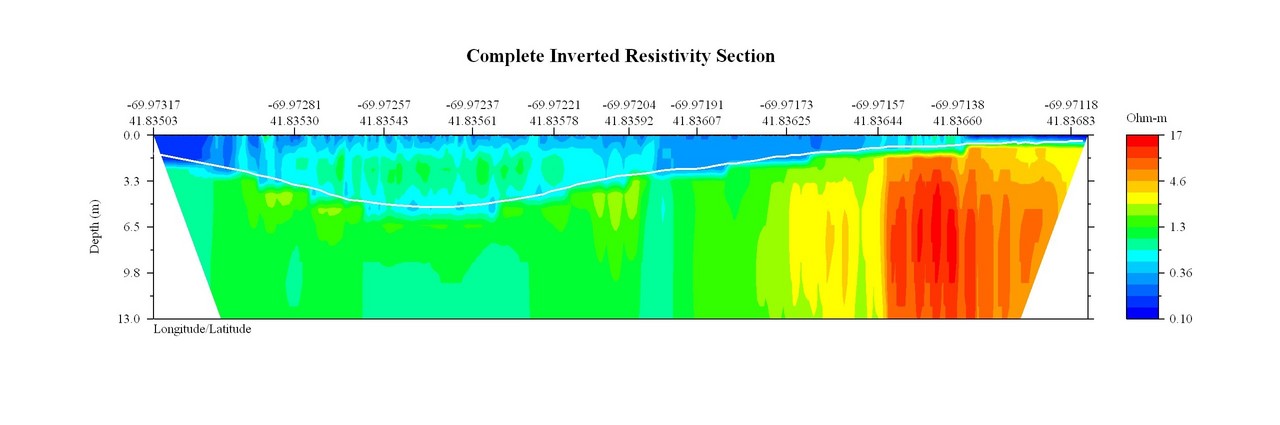
|
 |
Feb. 28, 2006: Line L2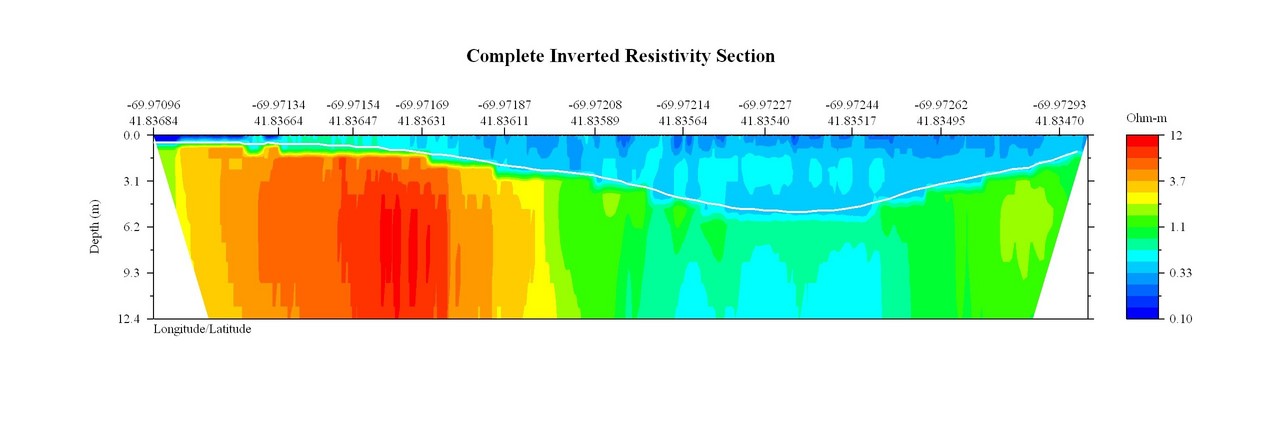
|
 |
Feb. 28, 2006: Line L3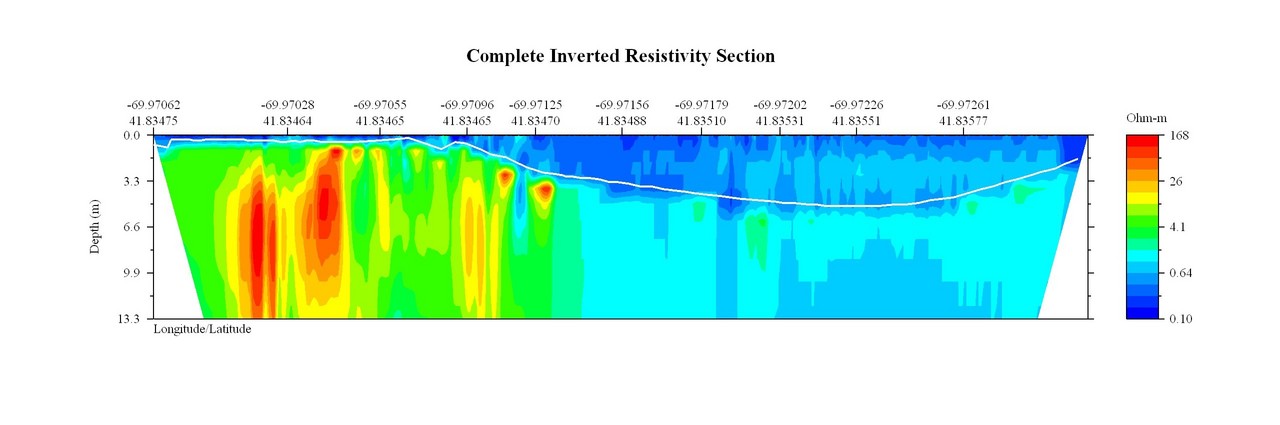
|
 |
Feb. 28, 2006: Line L4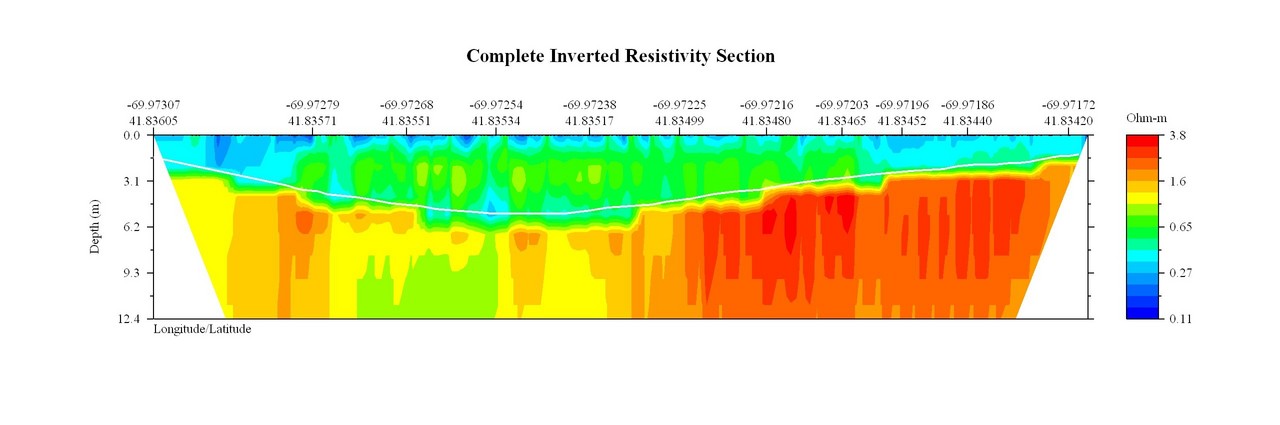
|
 |
Feb. 28, 2006: Line L5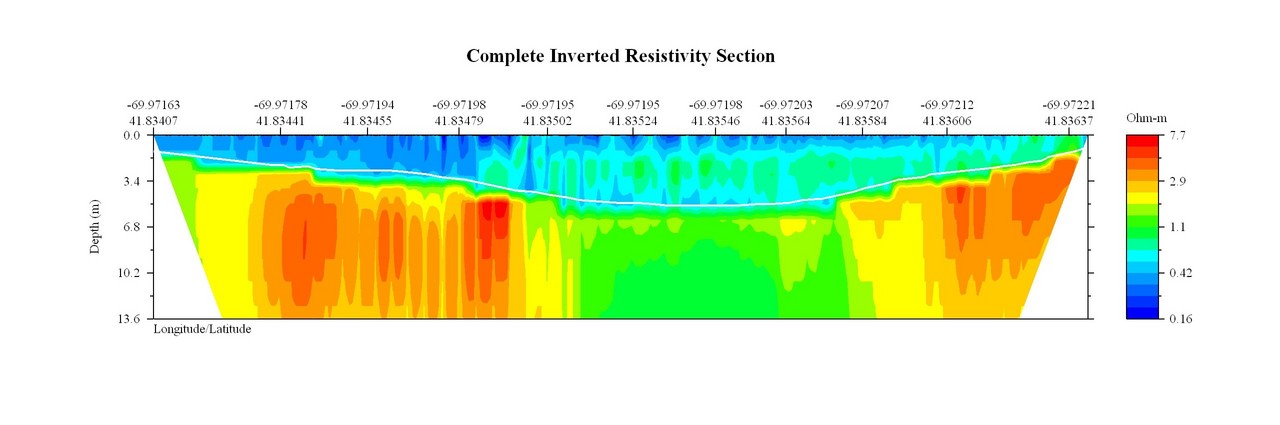
|
 |
Feb. 28, 2006: Line L6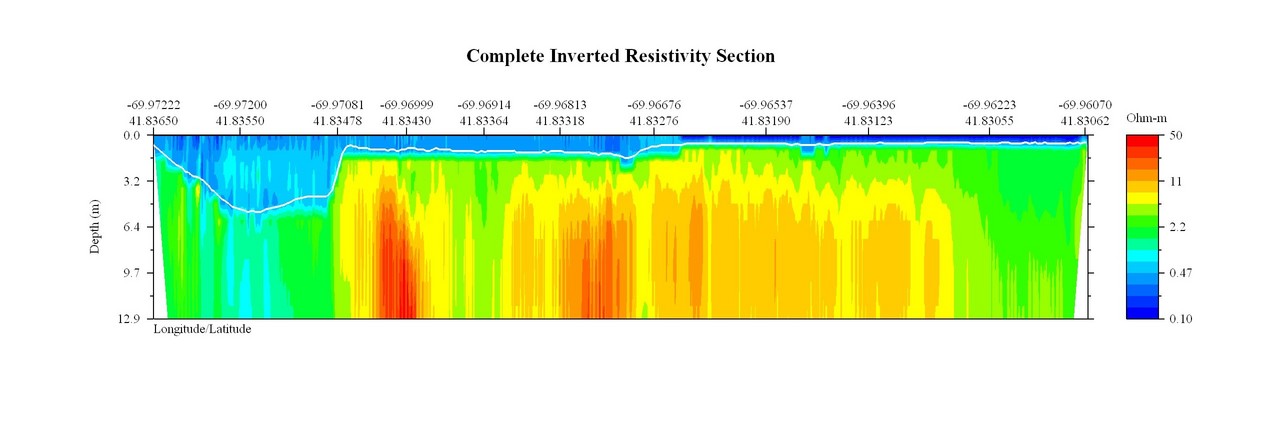
|
 |
Feb. 28, 2006: Line L8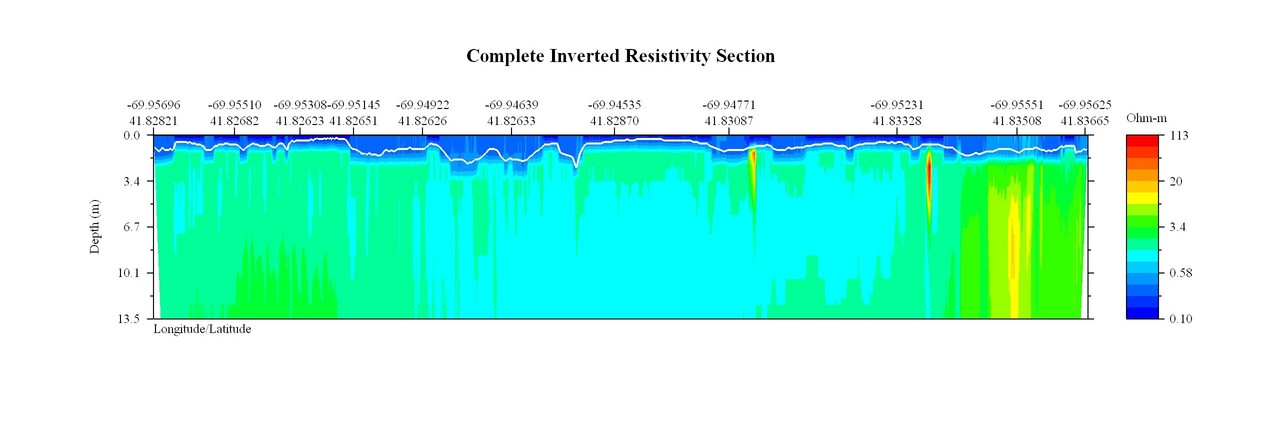
|
 |
Feb. 28, 2006: Line L9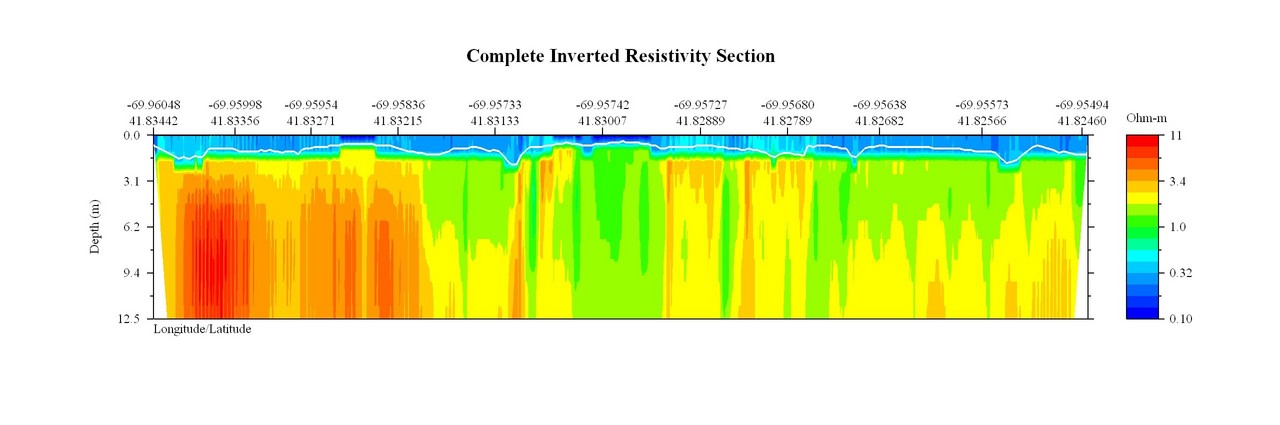
|
 |
Feb. 28, 2006: Line L10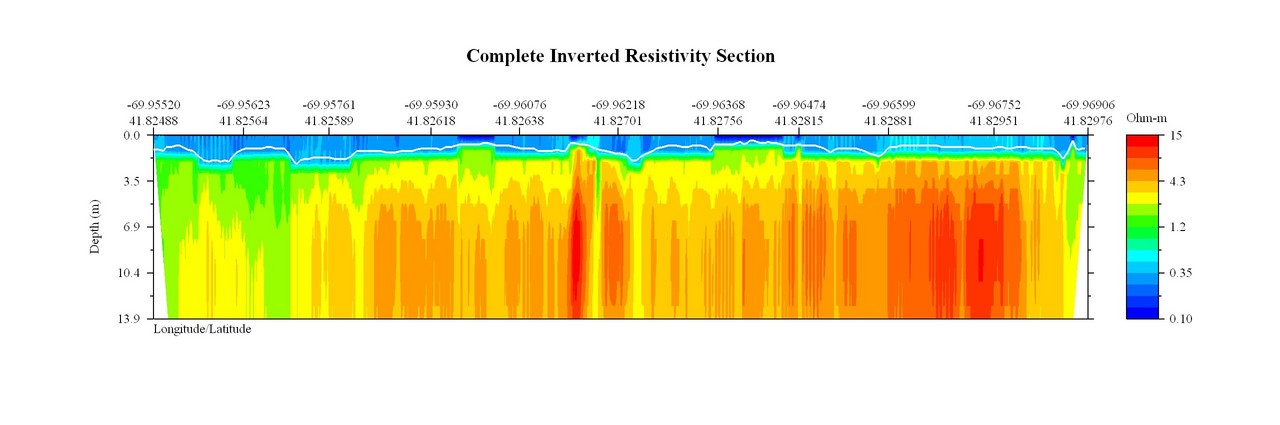
|
 |
Feb. 28, 2006: Line L11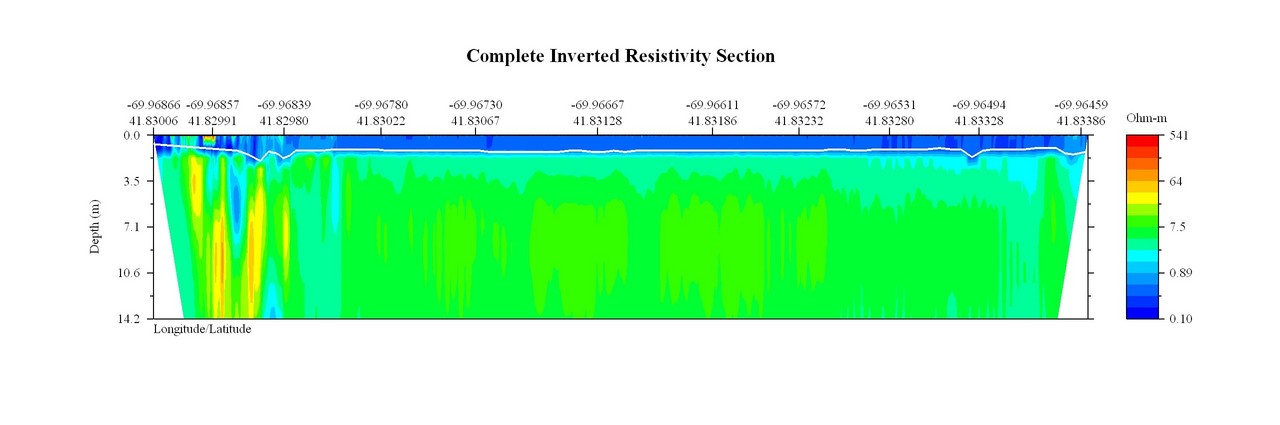
|
 |
Feb. 28, 2006: Line L12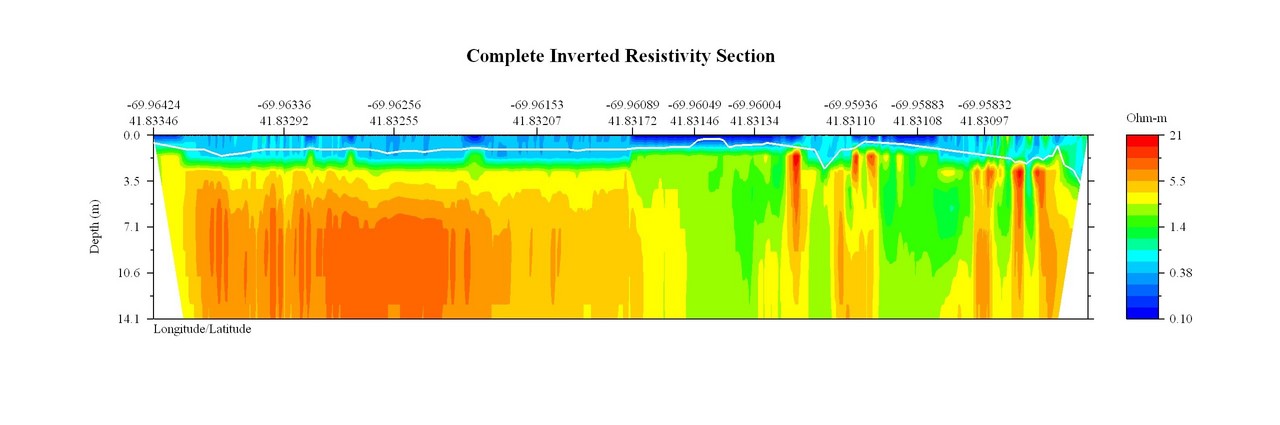
|
 |
Feb. 28, 2006: Line L13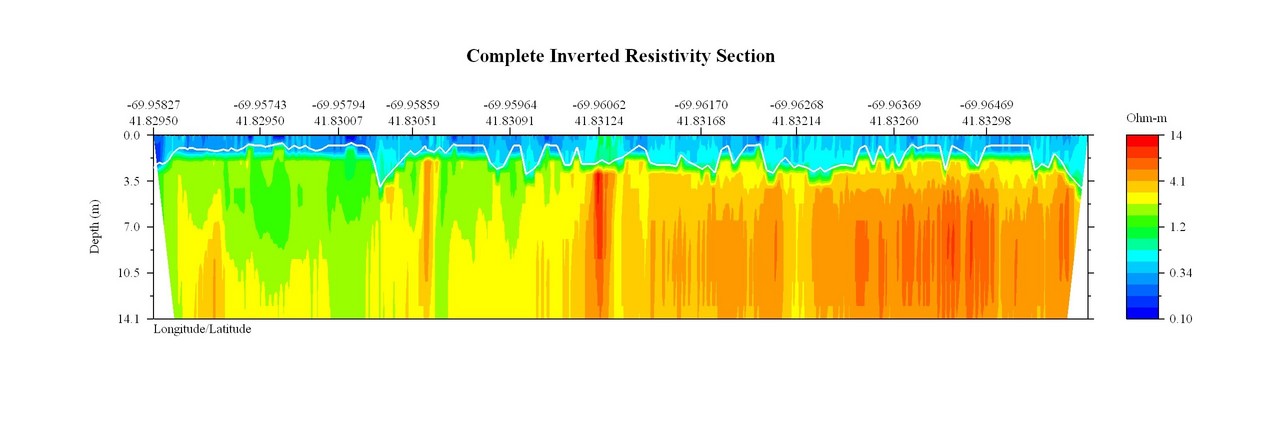
|
 |
Feb. 28, 2006: Line L14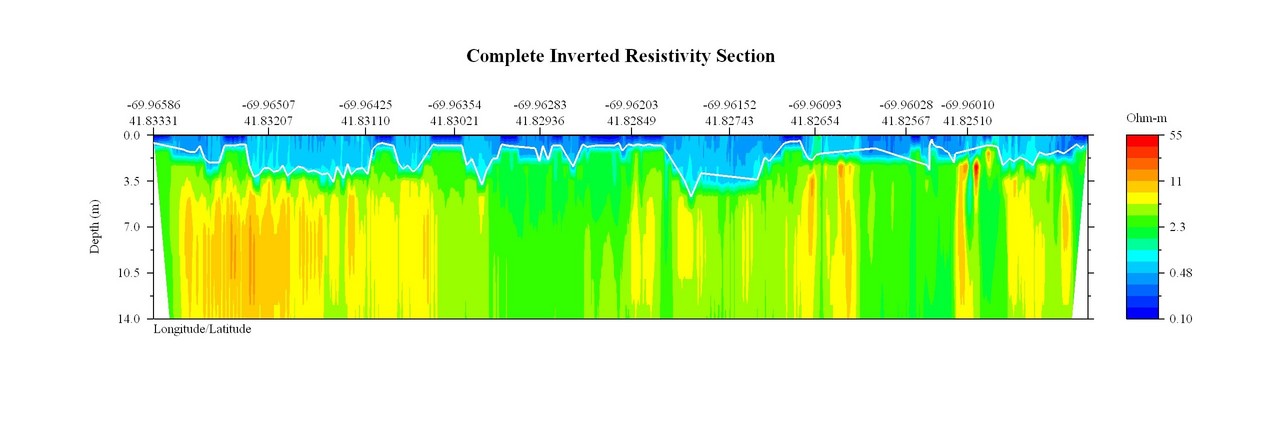
|
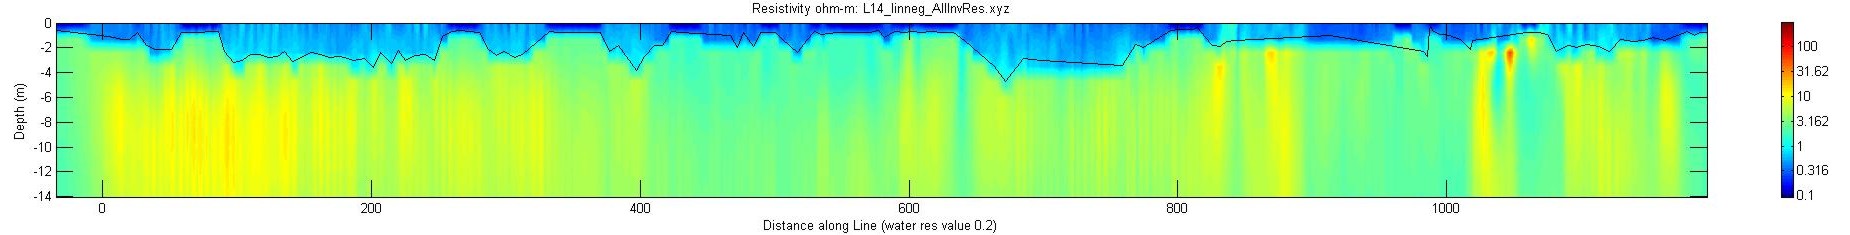 |
Feb. 28, 2006: Line L15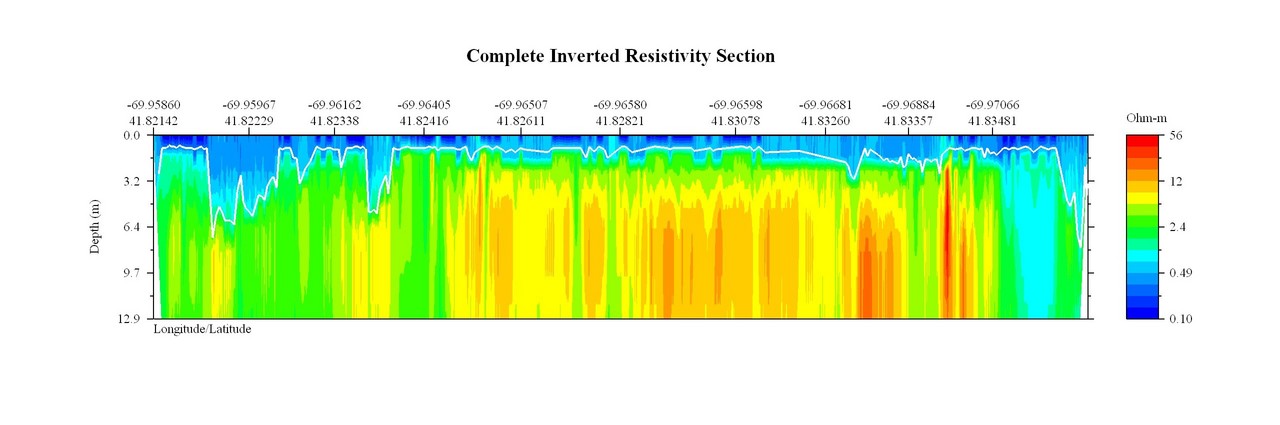
|
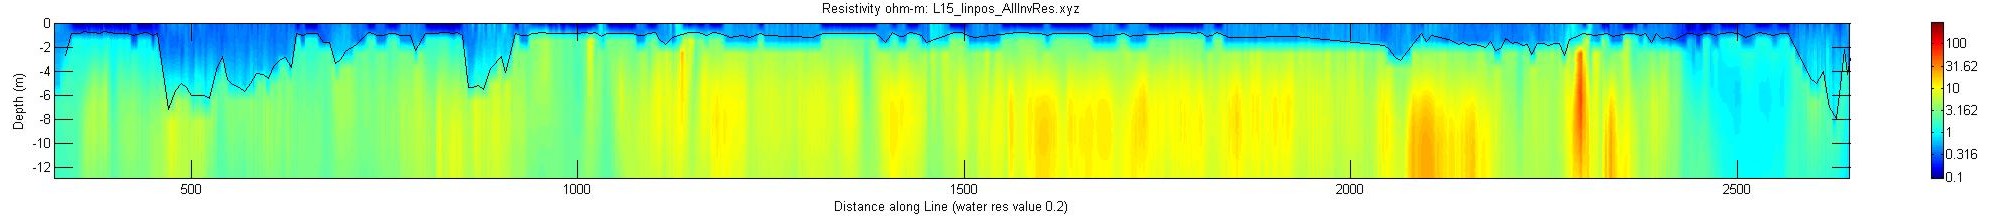 |
