Structure-from-Motion point clouds from the Florida Keys, 2019

Metadata also available as - [Outline] - [Parseable text] - [XML]

Frequently anticipated questions:


What does this data set describe?

Title: Structure-from-Motion point clouds from the Florida Keys, 2019
Abstract:
Structure-from-Motion (SfM) point clouds were created from seafloor images collected using the new 5-camera system SfM Quantitative Underwater Imaging Device with Five Cameras (SQUID-5). Images were collected in July 2019 by towing the SQUID-5 in 3 to 4 meters of water off of Islamorada in the Florida Keys during 3 days. The five cameras were synchronized together and with a survey-grade Global Positioning System (GPS). Images were collected over diverse benthic settings, including living and senile reefs, rubble, and sand. Point clouds were created from the photos using SfM photogrammetric software.
Supplemental_Information:
Additional information about the field activities from which these data were derived is available online at: https://cmgds.marine.usgs.gov/fan_info.php?fan=2019-630-FA https://cmgds.marine.usgs.gov/fan_info.php?fan=2019-323-FA
Any use of trade, product, or firm names is for descriptive purposes only and does not imply endorsement by the U.S. Government.
  1. How might this data set be cited?
    Warrick, Jonathan A., Ritchie, Andrew C., Dailey, Evan T., Hatcher, Gerald A., Kranenburg, Christine, Zawada, David G., and Yates, Kimberly K., 2020, Structure-from-Motion point clouds from the Florida Keys, 2019: data release DOI:10.5066/P9V7K7EG, U.S. Geological Survey, Pacific Coastal and Marine Science Center, Santa Cruz, California.

    Online Links:

    This is part of the following larger work.

    Warrick, Jonathan A., Ritchie, Andrew C., Dailey, Evan T., Hatcher, Gerald A., Kranenburg, Christine, Zawada, David G., and Yates, Kimberly K., 2020, SQUID-5 structure-from-motion point clouds, bathymetric maps, orthomosaics, and underwater photos of coral reefs in Florida, 2019: data release doi:10.5066/P9V7K7EG, U.S. Geological Survey, Pacific Coastal and Marine Science Center, Santa Cruz, California.

    Online Links:

  2. What geographic area does the data set cover?
    West_Bounding_Coordinate: -80.62214
    East_Bounding_Coordinate: -80.52600
    North_Bounding_Coordinate: 24.91171
    South_Bounding_Coordinate: 24.89666
  3. What does it look like?
    https://cmgds.marine.usgs.gov/data-releases/media/2020/10.5066-P9V7K7EG/5a717b4a06954f5fbd9272f63990cfb4/Points_browse.png (PNG)
    Perspective view of a SfM point cloud
  4. Does the data set describe conditions during a particular time period?
    Beginning_Date: 06-Jul-2019
    Ending_Date: 16-Jul-2019
    Currentness_Reference:
    ground condition
  5. What is the general form of this data set?
    Geospatial_Data_Presentation_Form: LAZ
  6. How does the data set represent geographic features?
    1. How are geographic features stored in the data set?
      This is a Raster data set. It contains the following raster data types:
      • Dimensions, type Grid Cell
    2. What coordinate system is used to represent geographic features?
      Grid_Coordinate_System_Name: Universal Transverse Mercator
      Universal_Transverse_Mercator:
      UTM_Zone_Number: 17N
      Transverse_Mercator:
      Scale_Factor_at_Central_Meridian: 0.9996
      Longitude_of_Central_Meridian: -81
      Latitude_of_Projection_Origin: 0.0
      False_Easting: 500000.0
      False_Northing: 0.0
      Planar coordinates are encoded using coordinate pair
      Abscissae (x-coordinates) are specified to the nearest 0.01
      Ordinates (y-coordinates) are specified to the nearest 0.01
      Planar coordinates are specified in METERS
      The horizontal datum used is NAD_1983_2011_UTM_Zone_17N.
      The ellipsoid used is GRS 1980.
      The semi-major axis of the ellipsoid used is 6378137.0.
      The flattening of the ellipsoid used is 1/298.257222101.
      Vertical_Coordinate_System_Definition:
      Altitude_System_Definition:
      Altitude_Datum_Name: MLLW
      Altitude_Resolution: 1.0E-4
      Altitude_Distance_Units: Meters
      Altitude_Encoding_Method:
      Explicit elevation coordinate included with horizontal coordinates
  7. How does the data set describe geographic features?
    Attribute table
    Table containing attribute information associated with the dataset (Source: U.S. Geological Survey)
    Value
    Depth relative to mean lower low water (MLLW) in meters (Source: U.S. Geological Survey)
    Range of values
    Minimum:-2.26071
    Maximum:-5.05259
    Units:Meters

Who produced the data set?

  1. Who are the originators of the data set? (may include formal authors, digital compilers, and editors)
    • Jonathan A. Warrick
    • Andrew C. Ritchie
    • Evan T. Dailey
    • Gerald A. Hatcher
    • Christine Kranenburg
    • David G. Zawada
    • Kimberly K. Yates
  2. Who also contributed to the data set?
    Data collection was funded by U.S. Geological Survey
  3. To whom should users address questions about the data?
    U.S. Geological Survey, Pacific Coastal and Marine Science Center
    Attn: PCMSC Science Data Coordinator
    2885 Mission Street
    Santa Cruz, CA

    831-460-4747 (voice)
    pcmsc_data@usgs.gov

Why was the data set created?

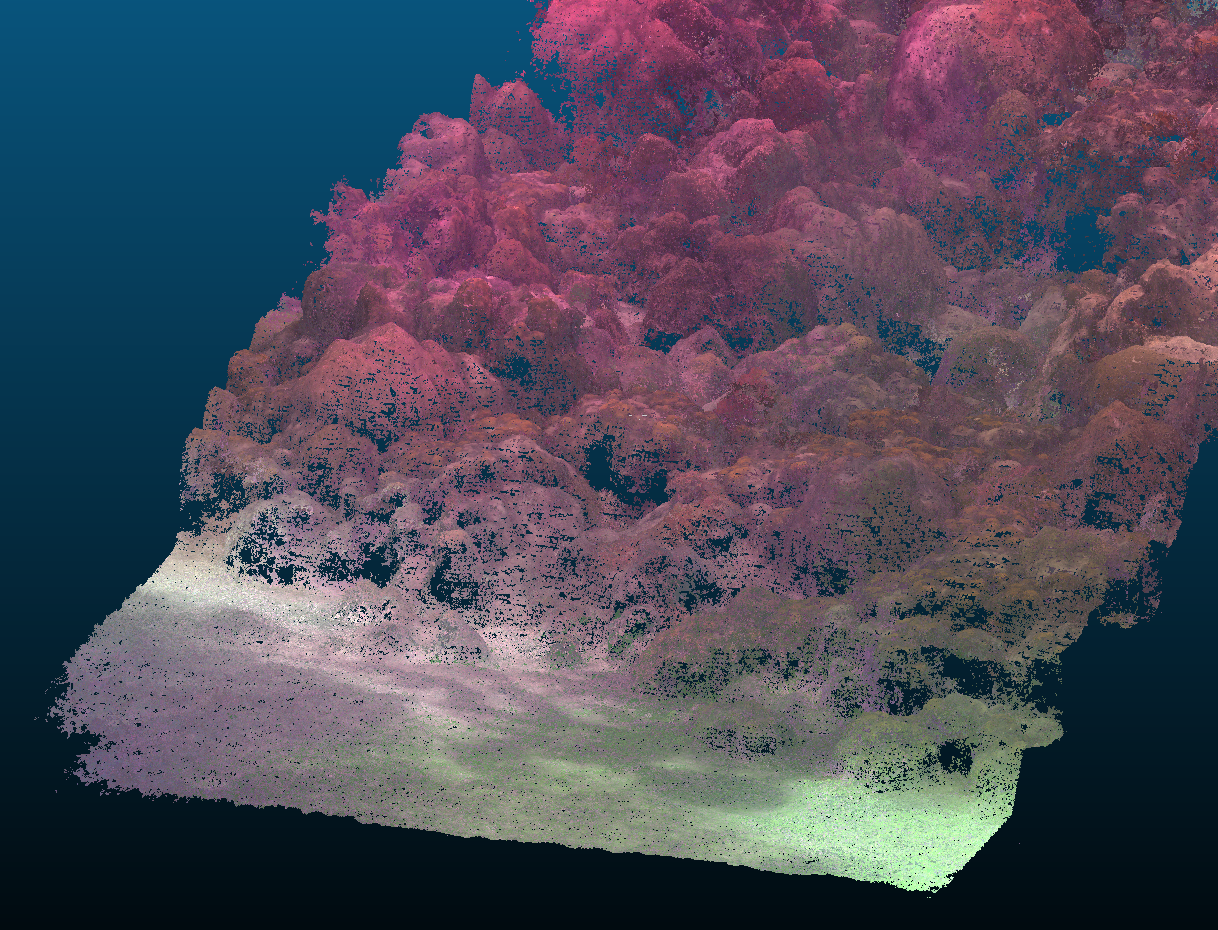
These point clouds were produced to determine the accuracy, precision, and effectiveness of the new SQUID-5 camera platform.

How was the data set created?

  1. From what previous works were the data drawn?
    imagery (source 1 of 1)
    Warrick, Jonathan A., Ritchie, Andrew C., Dailey, Evan T., Hatcher, Gerald A., Kranenburg, Christine, Zawada, David G., and Yates, Kimberly K., 2020, Structure-from-Motion underwater photos from the Florida Keys, 2019: U.S. Geological Survey, online.

    Online Links:

    Type_of_Source_Media: digital images
    Source_Contribution:
    Digital underwater imagery from which Structure-for-Motion point cloud data were generated
  2. How were the data generated, processed, and modified?
    Date: Jan-2020 (process 1 of 3)
    Structure-from-Motion Processing: the complete photo sets of each study area were subsampled such that minimum GPS spacing between the center camera location per collection instance was at least 0.75 m. For each survey site, the subsampled photo quintets were combined with GPS positions and camera-to-GPS-antennae distance vectors (lever arm offsets) and aligned with independent lens models for each camera. The computed camera positions and lens models were then refined using three statistical tools (reconstruction uncertainty, projection accuracy, and reprojection error) in Metashape to eliminate poorly constructed tie points. With trial and error, we found that threshold values of 20, 8 and 0.4 for these statistical tools, respectively, resulted in good alignment and adequately dense tie point distributions in both complex reef settings and simple sandy areas. Once the photo alignment and lens models were optimized, dense point clouds were generated with Metashape using the high point density and moderate filtering settings and exported in LAZ format. Data sources used in this process:
    • imagery
    Date: 19-Oct-2020 (process 2 of 3)
    Edited metadata to add keywords section with USGS persistent identifier as theme keyword. No data were changed. Person who carried out this activity:
    U.S. Geological Survey
    Attn: VeeAnn A. Cross
    Marine Geologist
    384 Woods Hole Road
    Woods Hole, MA

    508-548-8700 x2251 (voice)
    508-457-2310 (FAX)
    vatnipp@usgs.gov
    Date: 17-Mar-2021 (process 3 of 3)
    Corrected working URL links to cmgds data repository to the actual published links Person who carried out this activity:
    U.S. Geological Survey
    Attn: Susan A. Cochran
    Geologist
    2885 Mission Street
    Santa Cruz, CA

    831-460-7545 (voice)
    scochran@usgs.gov
  3. What similar or related data should the user be aware of?

How reliable are the data; what problems remain in the data set?

  1. How well have the observations been checked?
    The horizontal and vertical accuracies of the surface models were compared against GPS survey data of known features covered by the survey.
  2. How accurate are the geographic locations?
    SfM-based measurements of the Sediment Elevation Table (SET) stations were within 3 cm of the total uncertainty of the field-based GPS measurements. The average horizontal scaling of the models is between 0.016% and 0.024% of water depth.
  3. How accurate are the heights or depths?
    SfM-based measurements of the Sediment Elevation Table (SET) stations were within 3 cm of the total uncertainty of the field-based GPS measurements. The average horizontal scaling of the models is between 0.016% and 0.024% of water depth.
  4. Where are the gaps in the data? What is missing?
    Dataset is considered complete for the information presented, as described in the abstract. Users are advised to read the rest of the metadata record carefully for additional details.
  5. How consistent are the relationships among the observations, including topology?
    All data fall within expected ranges.

How can someone get a copy of the data set?

Are there legal restrictions on access or use of the data?
Access_Constraints: None
Use_Constraints:
USGS-authored or produced data and information are in the public domain from the U.S. Government and are freely redistributable with proper metadata and source attribution. Please recognize and acknowledge the U.S. Geological Survey as the originator of the dataset and in products derived from these data. This information is not intended for navigation purposes.
  1. Who distributes the data set? (Distributor 1 of 1)
    U.S. Geological Survey - ScienceBase
    Denver Federal Center, Building 810, Mail Stop 302
    Denver, CO

    1-888-275-8747 (voice)
    sciencebase@usgs.gov
  2. What's the catalog number I need to order this data set? These data are available in LAZ format (JD192_SET1_PointCloud.laz, JD193_SET1_PointCloud.laz, JD193_SET2_PointCloud.laz, JD194_CheecaRx_PointCloud.laz) contained in a single zip file, along with CSDGM FGDC-compliant metadata, and a browse image map of the data (.png). The LAZ data files are named with the following convention: Julian Day number, area, and "PointCloud."
  3. What legal disclaimers am I supposed to read?
    Unless otherwise stated, all data, metadata and related materials are considered to satisfy the quality standards relative to the purpose for which the data were collected. Although these data and associated metadata have been reviewed for accuracy and completeness and approved for release by the U.S. Geological Survey (USGS), no warranty expressed or implied is made regarding the display or utility of the data on any other system or for general or scientific purposes, nor shall the act of distribution constitute any such warranty.
  4. How can I download or order the data?
  5. What hardware or software do I need in order to use the data set?
    These data can be viewed with point cloud editing software.

Who wrote the metadata?

Dates:
Last modified: 17-Mar-2021
Metadata author:
U.S. Geological Survey, Pacific Coastal and Marine Science Center
Attn: PCMSC Science Data Coordinator
2885 Mission Street
Santa Cruz, CA

831-460-4747 (voice)
pcmsc_data@usgs.gov
Metadata standard:
Content Standard for Digital Geospatial Metadata (FGDC-STD-001-1998)

This page is <https://cmgds.marine.usgs.gov/catalog/pcmsc/DataReleases/CMGDS_DR_tool/DR_P9V7K7EG/SQUID5_Florida_PointClouds.faq.html>
Generated by mp version 2.9.50 on Tue Oct 26 16:49:32 2021