Acoustic backscatter data collected in 2008 offshore Tijuana River Estuary, California, during USGS Field Activity S-5-08-SC

Metadata also available as - [Outline] - [Parseable text] - [XML]

Frequently anticipated questions:


What does this data set describe?

Title:
Acoustic backscatter data collected in 2008 offshore Tijuana River Estuary, California, during USGS Field Activity S-5-08-SC
Abstract:
These metadata describe acoustic backscatter data collected during a 2008 SWATHPlus-M survey offshore Tijuana River Estuary, California. Data were collected and processed by the U.S. Geological Survey (USGS), Pacific Coastal and Marine Science Center (PCMSC) with fieldwork activity number S-5-08-SC. The acoustic backscatter data are provided as a GeoTIFF image.
Supplemental_Information:
Additional information about the field activity from which these data were derived is available online at:
https://cmgds.marine.usgs.gov/fan_info.php?fan=S508SC
Any use of trade, product, or firm names is for descriptive purposes only and does not imply endorsement by the U.S. Government. Although this Federal Geographic Data Committee-compliant metadata file is intended to document the data set in nonproprietary form, as well as in Esri format, this metadata file may include some Esri-specific terminology.
  1. How might this data set be cited?
    Dartnell, Peter, Finlayson, David P., and Warrick, Jonathan A., 2020, Acoustic backscatter data collected in 2008 offshore Tijuana River Estuary, California, during USGS Field Activity S-5-08-SC: data release DOI:10.5066/P9Y8CDFI, U.S. Geological Survey, Pacific Coastal and Marine Science Center, Santa Cruz, California.

    Online Links:

    This is part of the following larger work.

    Dartnell, Peter, Finlayson, David P., and Warrick, Jonathan A., 2020, Bathymetry and acoustic backscatter data collected in 2008 offshore Tijuana River Estuary, California during USGS Field Activity S-5-08-SC: data release DOI:10.5066/P9Y8CDFI, U.S. Geological Survey, Pacific Coastal and Marine Science Center, Santa Cruz, CA.

    Online Links:

  2. What geographic area does the data set cover?
    West_Bounding_Coordinate: -123.181
    East_Bounding_Coordinate: -123.126
    North_Bounding_Coordinate: 32.595
    South_Bounding_Coordinate: 32.534
  3. What does it look like?
    https://cmgds.marine.usgs.gov/data-releases/media/2020/10.5066-P9Y8CDFI/94117628a7a545618485bfed82da9621/Tijuana_backscatter_QV.jpg (JPEG)
    Quick view image of the Tijuana River Delta backscatter data.
  4. Does the data set describe conditions during a particular time period?
    Beginning_Date: 28-Apr-2008
    Ending_Date: 07-May-2008
    Currentness_Reference:
    ground condition at time data were collected.
  5. What is the general form of this data set?
    Geospatial_Data_Presentation_Form: GeoTIFF
  6. How does the data set represent geographic features?
    1. How are geographic features stored in the data set?
      This is a Raster data set. It contains the following raster data types:
      • Dimensions 6833 x 5172, type Grid Cell
    2. What coordinate system is used to represent geographic features?
      Grid_Coordinate_System_Name: Universal Transverse Mercator
      Universal_Transverse_Mercator:
      UTM_Zone_Number: 11
      Transverse_Mercator:
      Scale_Factor_at_Central_Meridian: 0.9996
      Longitude_of_Central_Meridian: -117
      Latitude_of_Projection_Origin: 0.0
      False_Easting: 500000
      False_Northing: 0.0
      Planar coordinates are encoded using row and column
      Abscissae (x-coordinates) are specified to the nearest 1.0
      Ordinates (y-coordinates) are specified to the nearest 1.0
      Planar coordinates are specified in meters
      The horizontal datum used is North American Datum of 1983 (CORS96).
      The ellipsoid used is Geodetic Reference System 80.
      The semi-major axis of the ellipsoid used is 6378137.
      The flattening of the ellipsoid used is 1/298.257.
  7. How does the data set describe geographic features?
    Normalized Acoustic Backscatter Amplitude
    The raw 16-bit backscatter recorded simultaneously with the bathymetry by the SWATHplus was georeferenced and gain-normalized by the program SXPEGN, software written by the USGS to enhance the backscatter of the SWATHplus system. The program normalizes for time-varying signal loss and beam directivity differences. The resulting normalized amplitude values are re-scaled to 16-bit, exported as point files and gridded into GeoJPEGS using GRID Processor, software supplied by SEA. Normalized acoustic backscatter shows the relative strength of the acoustic signal returned from the seafloor. Normalization process compensates for acoustic signal strength differences due to time varying gain (TVG), spreading and many static sonar artifacts (those that repeat from ping-to-ping). The values are comparable across the entire dataset regardless of water depth or distance and angle from the transducer. Low normalized acoustic backscatter values indicate relatively low acoustic target signal strength; High normalized acoustic backscatter values indicate relatively high acoustic target signal strength. (Source: Producer defined)
    Entity_and_Attribute_Overview:
    The complete 2008 1-m resolution grid "S-5-08-SC_backscatter_nad83_utm11_1m.tif" was originally archived as a TIFF image with the following attributes.
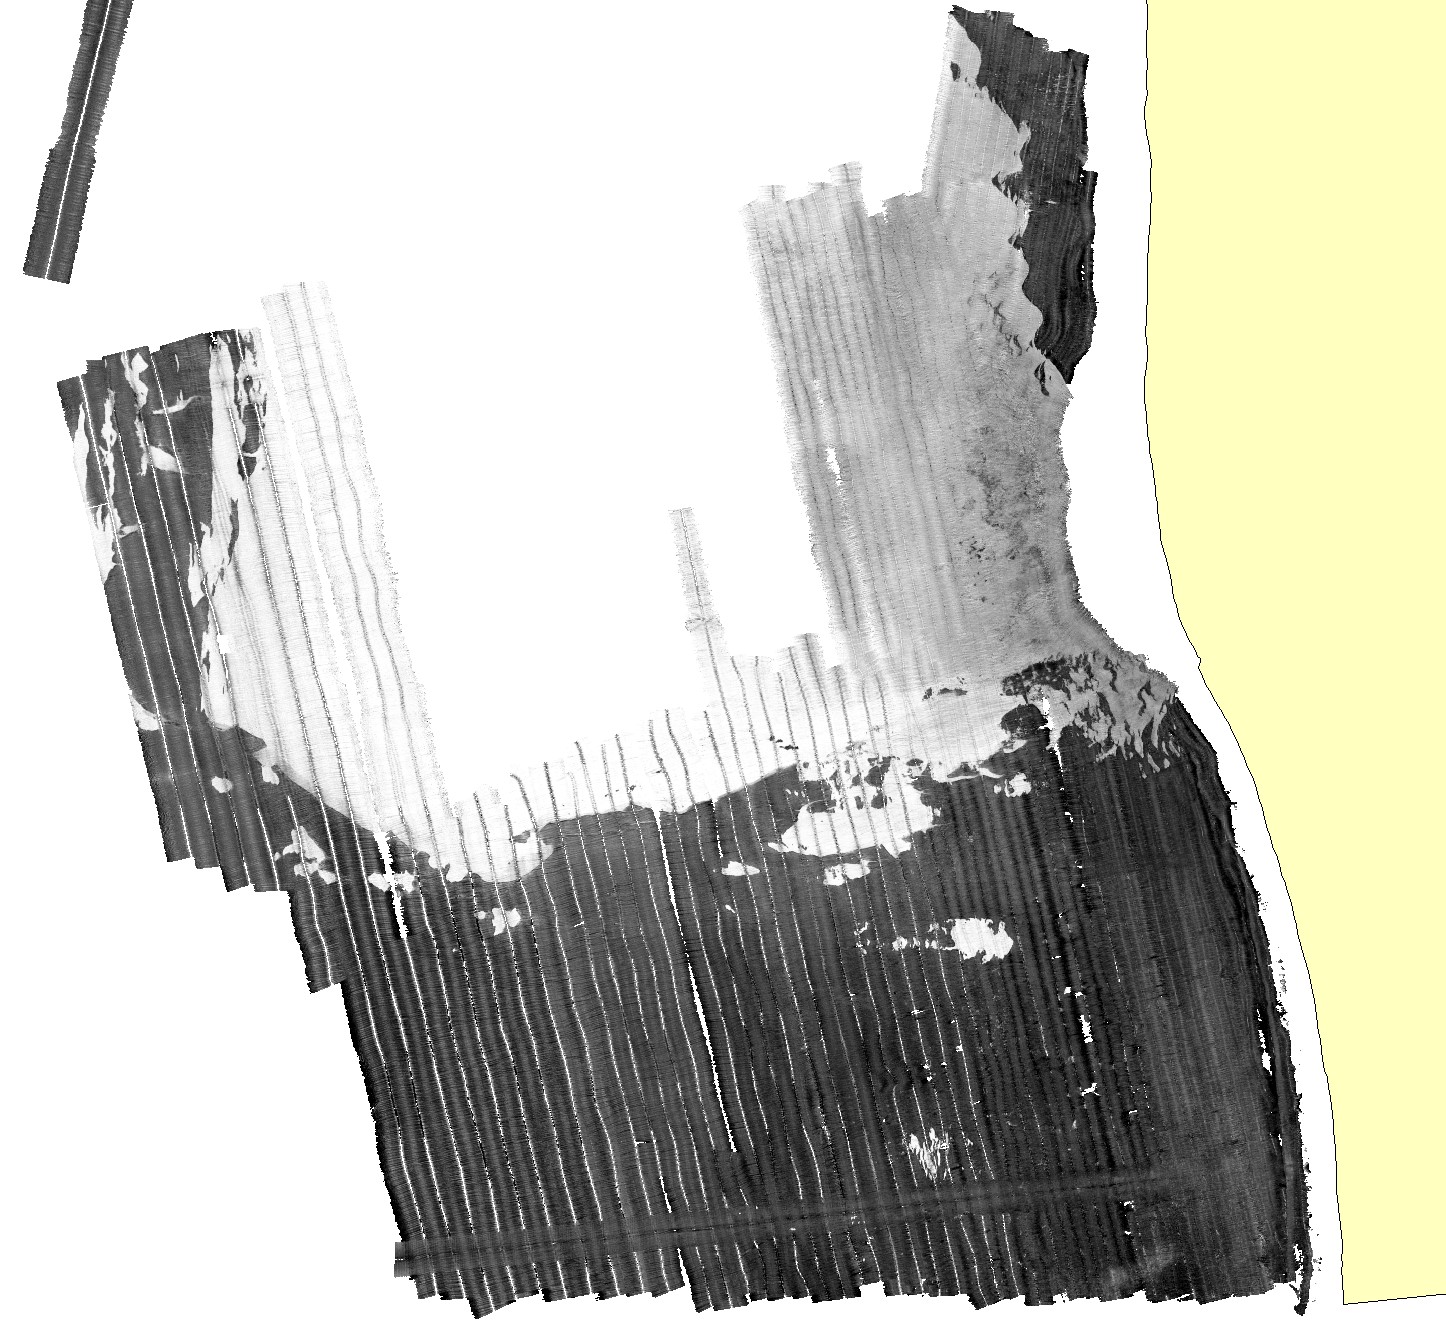
    Cell size = 1.0
    Number of rows = 6833
    Number of columns = 5172
    
    Data type = floating point
    
    Boundary
    Xmin = 483039
    Xmax = 488211
    Ymin = 3599596
    Ymax = 3606429
    
    Statistics
    Minimum value = 0
    Maximum value = 65535
    Mean = 32848
    Standard deviation = 17300
    
    Coordinate system description
    Projection  UTM
    Zone  11
    Datum  NAD83
    Units  meter
    
    Entity_and_Attribute_Detail_Citation: U.S. Geological Survey

Who produced the data set?

  1. Who are the originators of the data set? (may include formal authors, digital compilers, and editors)
    • Peter Dartnell
    • David P. Finlayson
    • Jonathan A. Warrick
  2. Who also contributed to the data set?
  3. To whom should users address questions about the data?
    U.S. Geological Survey, Pacific Coastal and Marine Science Center
    Attn: PCMSC Science Data Coordinator
    2885 Mission Street
    Santa Cruz, CA

    831-427-4747 (voice)
    pcmsc_data@usgs.gov

Why was the data set created?

Coastal mapping was conducted as part of the Tijuana Estuary Fine Sediment Fate and Transport Demonstration Project, which was developed by a number of State of California, Federal, and private industry partners to provide information about the directions, rates, and processes of fine sediment transport at nearshore settings of California. The primary goal of the Demonstration Project was the monitoring of the transport, fate, and impacts of fine sediment from beach sediment nourishments in 2008 and 2009 near the Tijuana River Estuary, Imperial Beach, California. To achieve this goal, the USGS monitored the water, beach, and seafloor properties near the project site. The coastal mapping described in this report provided important baseline bathymetric and seafloor substrate information for the Demonstration Project and was used to develop sampling programs for the Demonstration Project. These data are intended for science researchers, students, policy makers, and the general public. These data can be used with geographic information systems or other software to identify bathymetric features. These data are not intended to be used for navigation.

How was the data set created?

  1. From what previous works were the data drawn?
  2. How were the data generated, processed, and modified?
    Date: 29-Apr-2008 (process 1 of 8)
    Sonar Data Collection - The bathymetric surveys were conducted using a 234.5 kHz SEA (Systems Engineering & Assessment Ltd) SWATHplus-M phase-differencing sidescan sonar. The sonar was pole-mounted on the 34-foot USGS mapping vessel R/V Parke Snavely, and affixed to a hull brace. Real-time kinematic (RTK) GPS position data were passed through a CodaOctopus F180 intertial measurement unit (IMU) to the sonar hardware and data collection software. Sonar heads, GPS antennae, and the IMU were surveyed in place to a common reference frame with a Geodimeter 640 Total Station. The R/V Snavely was outfitted with three networked workstations and a navigation computer for use by the captain and survey crew for data collection and initial processing.
    Date: 29-Apr-2008 (process 2 of 8)
    Geodetic Control - Geodetic control for the survey was established using a shore based Global Positioning System (GPS) base station broadcasting Real Time Kinematic (RTK) corrections to the survey vessel via UHF radio link. The base station was located at atop the Tijuana River National Estuarine Reserve Visitor Center. The base station was programmed using the NAD83 (CORS96) reference frame with an Epoch of 2002.0000. Average Opus Solution coordinates for the station are:
    
    Reference Frame: NAD83 (CORS96)
    Epoch: 2002.0000
    Latitude: N 32D 34' 29.10834"
    Longitude: W 117D 7' 36.23523"
    Ellipsoid Height: -25.765 m
    Orthometric Height: 9.583 m (Geoid09)
    UTM Zone 11 Northing: 3604152.632 m
    UTM Zone 11 Easting: 488104.754 m
    
    Reference Frame: WGS84 (G1150)
    Epoch: 2008.3246
    Latitude: N 32D 34' 29.12697"
    Longitude: W 117D 7' 36.29008"
    Ellipsoid Height: -26.526 m
    
    Date: 29-Apr-2008 (process 3 of 8)
    Vessel Position and Attitude - The R/V Snavely was equipped with a CodaOctopus F180 attitude and positioning system for the duration of the survey. The F180receives real-time kinematic (RTK) corrections directly. The RTK GPS data (2 cm error ellipse) are combined with the inertial motion measurements directly within the F180 hardware so that high-precision position and attitude corrections are fed in real-time to the sonar acquisition equipment. The NAD83 (CORS96) Epoch 2002.0000 3-dimensional reference frame was used for all data acquisition.
    Date: 29-Apr-2008 (process 4 of 8)
    Sound Velocity Measurements - Sound velocity measurements were collected continuously with an Applied Micro Systems Micro SV deployed on the transducer frame for real-time sound velocity adjustments at the transducer-water interface. The Micro SV is accurate to +/- 0.03 m/s. In addition, sound velocity profiles (SVP) were collected with an Applied Micro Systems, SvPlus 3472. This instrument provides time-of-flight sound-velocity measurements by using invar rods with a sound-velocity accuracy of about 0.06 m/s, pressure measured by a semiconductor bridge strain gauge to an accuracy of 0.15 percent (Full Scale) and temperature measured by thermistor to an accuracy of 0.05 degrees Celsius (Applied Microsystems Ltd., 2005).
    Date: 07-Dec-2011 (process 5 of 8)
    Sonar Sounding Processing - GPS data and measurements of vessel motion were combined in the F180 hardware to produce a high-precision vessel attitude packet. This packet was transmitted to the Swath Processor acquisition software in real time and combined with instantaneous sound velocity measurements at the transducer head before each ping. As many as 20 pings per second were transmitted with each ping consisting of 2,048 samples per side (port and starboard). The returned samples were projected to the seafloor using a ray-tracing algorithm working with the previously measured sound-velocity profiles in SEA Swath Processor (version 3.07.12.0). A series of statistical filters were applied to the raw samples that isolated the seafloor returns from other spurious targets in the water column. Finally, the processed data is stored line-by-line in both raw (.sxr) and processed (.sxp) trackline files. Processed (.sxp) files were further processed with SXPEGN (build 151) by David Finlayson (USGS) to remove erroneous data from the files and produce valid gain-normalized amplitude data for processing backscatter data.
    Date: 07-Dec-2011 (process 6 of 8)
    Backscatter Image Production - The raw 16-bit backscatter recorded simultaneously with the bathymetry by the SWATHplus was georeferenced and gain-normalized by the program SXPEGN, software written by the USGS to enhance the backscatter of the SWATHplus system. The program normalizes for time-varying signal loss and beam directivity differences. The resulting normalized amplitude values are re-scaled to 16-bit, exported as point files and gridded into GeoJPEGS using GRID Processor, software supplied by SEA. Normalized acoustic backscatter shows the relative strength of the acoustic signal returned from the seafloor. The normalization process compensates for acoustic signal strength differences due to time varying gain (TVG), spreading and many static sonar artifacts (those that repeat from ping-to-ping). The values are comparable across the entire dataset regardless of water depth or distance and angle from the transducer. Low normalized acoustic backscatter values indicate relatively low acoustic target signal strength; High normalized acoustic backscatter values indicate relatively high acoustic target signal strength.
    Date: 19-Oct-2020 (process 7 of 8)
    Edited metadata to add keywords section with USGS persistent identifier as theme keyword. No data were changed. Person who carried out this activity:
    U.S. Geological Survey
    Attn: VeeAnn A. Cross
    Marine Geologist
    384 Woods Hole Road
    Woods Hole, MA

    508-548-8700 x2251 (voice)
    508-457-2310 (FAX)
    vatnipp@usgs.gov
    Date: 17-Mar-2021 (process 8 of 8)
    Corrected working URL links to cmgds data repository to the actual published links Person who carried out this activity:
    U.S. Geological Survey
    Attn: Susan A. Cochran
    Geologist
    2885 Mission Street
    Santa Cruz, CA

    831-460-7545 (voice)
    scochran@usgs.gov
  3. What similar or related data should the user be aware of?

How reliable are the data; what problems remain in the data set?

  1. How well have the observations been checked?
    The SWATHPlus-M sonar system (234 kHz) depth accuracy reduces with horizontal range. The system has an estimated vertical depth uncertainty ranging from about 0.05 m to 0.30 m over a horizontal range of 0 to 90 m (https://www.iter-systems.com/wp-content/uploads/2020/03/ETD_2002_Bathyswath-2_Tech-info_EN.pdf). Accuracies of final products may be lower due to total propagated uncertainties of the mapping systems, which include sonar system, position and motion compensation system, and navigation, as well as data processing that includes sounding cleaning, gridding, and datum transformations.
  2. How accurate are the geographic locations?
    Uncertainty in the horizontal position of each sounding is a function of the total uncertainty propagated through each of the following component instruments: 1) base station GPS, 2) vessel GPS, 3) intertial motion unit (IMU), 4) water sound velocity model, and 5) beam spreading in the water column. Assuming no systematic errors in the measurement instruments themselves, beam spreading is the dominate source of positional uncertainty. The 1-degree sonar beam of the SWATHplus-M results in horizontal uncertainty ranging from 0.10 m at 10 m slant range, to about 0.45 m at 50 m slant range.
  3. How accurate are the heights or depths?
    Not applicable to backscatter data.
  4. Where are the gaps in the data? What is missing?
    Dataset is considered complete for the information presented, as described in the abstract. Users are advised to read the rest of the metadata record carefully for additional details.
  5. How consistent are the relationships among the observations, including topology?
    No formal logical accuracy tests were conducted

How can someone get a copy of the data set?

Are there legal restrictions on access or use of the data?
Access_Constraints: none
Use_Constraints:
USGS-authored or produced data and information are in the public domain from the U.S. Government and are freely redistributable with proper metadata and source attribution. Please recognize and acknowledge the U.S. Geological Survey as the originators of the dataset and in products derived from these data. This information is not intended for navigation purposes.
  1. Who distributes the data set? (Distributor 1 of 1)
    U.S. Geological Survey, Pacific Coastal and Marine Science Center
    2885 Mission Street
    Santa Cruz, CA

    1-888-427-4747 (voice)
    pcmsc_data@usgs.gov
  2. What's the catalog number I need to order this data set? These data are available in GeoTIFF format, including a tif world file (.tfw) and CSDGM FGDC-compliant metadata.
  3. What legal disclaimers am I supposed to read?
    Unless otherwise stated, all data, metadata and related materials are considered to satisfy the quality standards relative to the purpose for which the data were collected. Although these data and associated metadata have been reviewed for accuracy and completeness and approved for release by the U.S. Geological Survey (USGS), no warranty expressed or implied is made regarding the display or utility of the data on any other system or for general or scientific purposes, nor shall the act of distribution constitute any such warranty.
  4. How can I download or order the data?
  5. What hardware or software do I need in order to use the data set?
    The downloadable data file has been compressed with the "zip" command and can be unzipped with Winzip (or other tool) on Windows systems. To utilize these data, the user must have software capable of uncompressing the WinZip file and importing and viewing a GeoTIFF file.

Who wrote the metadata?

Dates:
Last modified: 17-Mar-2021
Metadata author:
U.S. Geological Survey, Pacific Coastal and Marine Science Center
Attn: PCMSC Science Data Coordinator
2885 Mission Street
Santa Cruz, CA

831-427-4747 (voice)
pcmsc_data@usgs.gov
Metadata standard:
Content Standard for Digital Geospatial Metadata (FGDC-STD-001-1998)

This page is <https://cmgds.marine.usgs.gov/catalog/pcmsc/DataReleases/CMGDS_DR_tool/DR_P9Y8CDFI/S-5-08-SC_backscatter_nad83_utm11_1m_metadata.faq.html>
Generated by mp version 2.9.50 on Tue Oct 26 16:49:32 2021