Online Links:
Online Links:
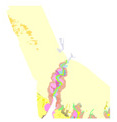
| Value | Definition |
|---|---|
| af | Artificial fill |
| af? | Artificial fill uncertain |
| Qccb | Submarine-canyon channel-flanking bar deposits |
| Qccf | Submarine-canyon channel-floor deposits |
| Qcch | Submarine-canyon channel-head deposits |
| Qccw | Submarine-canyon channel-wall deposits |
| Qcfa | Axial-submarine-canyon fill |
| Qcfl | Lateral-submarine-canyon fill |
| Qcft | Tributary-submarine-canyon fill |
| Qcwi | Inner submarine-canyon-wall deposits |
| Qcwo1 | Outer submarine-canyon-wall deposits [generally sediment draped with 18 - 30 degree slope] |
| Qcwo2 | Outer submarine-canyon-wall deposits [generally deeply incised and more than 30 degree slope] |
| Qls | Landslide deposits, undifferentiated |
| Qls1 | Landslide deposits, first generation |
| Qls2 | Landslide deposits, second generation |
| Qls3 | Landslide deposits, third generation |
| Qlss | Slump deposits on canyon walls |
| Qmp | Marine pockmarks |
| Qmr | Marine rill |
| Qms | Marine nearshore and shelf deposits |
| Qmsh | Marine shelf hummocky deposits |
| Qmsl | Marine slope deposits |
| Qmss | Marine shelf scour depressions |
| Qwp1 | Submerged wave-cut platform, about 120 to 125 m deep |
| Qwp2 | Submerged wave-cut platform, about 95 to 100 m deep |
| Qwp3 | Submerged wave-cut platform, about 75 to 85 m deep |
| Qwp4 | Submerged wave-cut platform, about 65 m deep |
| Qwpr1 | Submerged wave-cut platform riser, base about 120 to 125 m deep [associated with Qwp1] |
| Qwpr2 | Submerged wave-cut platform riser, base about 95 to 100 m deep [associated with Qwp2] |
| Qwpr3 | Submerged wave-cut platform riser, base about 75 to 85 m deep [associated with Qwp3] |
| Qwpr4 | Submerged wave-cut platform riser, base about 65 m deep [associated with Qwp4] |
| Tbu | Bedrock, undivided |
To expand geologic mapping to the seafloor within California's State Waters, to update coastal geologic mapping, and to contribute to a uniform regional geologic database. Additionally, to provide a geologic map for the public and geoscience community to aid in assessments and mitigation of geologic hazards in the Santa Barbara coastal plain region and to provide sufficient geologic information for land-use and land-management decisions both onshore and offshore.
Online Links:
Online Links:
Online Links:
Online Links:
Online Links:
Online Links:
Online Links:
Online Links:
Are there legal restrictions on access or use of the data?Access_Constraints: none
Use_Constraints:USGS-authored or produced data and information are in the public domain from the U.S. Government and are freely redistributable with proper metadata and source attribution. Please recognize and acknowledge the U.S. Geological Survey as the originator(s) of the dataset and in products derived from these data. This information is not intended for navigation purposes.
Unless otherwise stated, all data, metadata and related materials are considered to satisfy the quality standards relative to the purpose for which the data were collected. Although these data and associated metadata have been reviewed for accuracy and completeness and approved for release by the U.S. Geological Survey (USGS), no warranty expressed or implied is made regarding the display or utility of the data on any other system or for general or scientific purposes, nor shall the act of distribution constitute any such warranty.
| Data format: | The .zip file includes the .aux, .dbf, .shp, .shx, .sbx, and .sbn files, as well as FGDC-compliant metadata for the geology data layer of Hueneme Canyon and Vicinity, California. in format Shapefile (version ArcMap (version 10.0, Esri, 2011)) Point, line, and polygon features are in shapefile format and are projected in UTM Zone 11 coordinates. Size: 0.3 |
|---|---|
| Network links: |
https://pubs.usgs.gov/ds/781/HuenemeCanyon/data/Geology_HuenemeCanyon.zip https://pubs.usgs.gov/ds/781/HuenemeCanyon/data_catalog_HuenemeCanyon.html https://pubs.usgs.gov/ds/781/ |
The downloadable data file has been compressed with the "zip" command and can be unzipped with Winzip (or other tool) on Windows systems. To utilize these data, the user must have software capable of uncompressing the WinZip file and importing and viewing an Esri ArcMap TIFF. Users should download the ArcGIS Project File, HuenemeCanyonGIS.mxd.zip, a compressed (with the "zip" command) version of the ArcMap document (.mxd) that has all the data layers loaded in the table of contents for "Hueneme Canyon and Vicinity" and has all the data symbolized as on the map sheets. Download and save this ArcGIS project file, including all data layers, to the directory the user has created for this GIS.