SANPHAB -- Habitat polygons for South Anacapa Passage (UTM 10N, NAD83)

Metadata also available as - [Outline] - [Parseable text] - [XML]

Frequently anticipated questions:


What does this data set describe?

Title:
SANPHAB -- Habitat polygons for South Anacapa Passage (UTM 10N, NAD83)
Abstract:
Benthic habitat polygon coverages have been created for marine reserve locations surrounding the Santa Barbara Basin. Diver, ROV and submersible video transects, bathymetry data, sedimentary samples, and sonar mapping, have been integrated to describe the geological, biological, and oceanographic aspects of habitat. Anacapa Reserve, is part of the Marine Ecological Reserves Research Program (MERRP). The U.S. Geological Survey (USGS), in a cooperative project with Sea Grant-MERRP and investigators at National Marine Fisheries Service (NMFS), the Channel Islands National Marine Sanctuary (CINMS), and National Park Service (NPS) has collected sidescan sonar and video data to produce a polygon coverage. The habitat polygons have attributes for megahabitat, bottom induration, macrohabitat (where macrohabitat observations are available), polygon area, polygon perimeter, and water depth. The habitat GIS shows rocky habitat suitable for rockfish (Sebastes sp.), abalone (Haliotis sp.), and other threatened benthic species from the shoreline out to the 100-m depth limit of the survey.
Supplemental_Information:
Additional information about the field activities from which this data set was derived are available online at http://walrus.wr.usgs.gov/nearshorehab/
  1. How might this data set be cited?
    Cochrane, Guy R., 2005, SANPHAB -- Habitat polygons for South Anacapa Passage (UTM 10N, NAD83): Open-File Report 2005-1170, U.S. Geological Survey, Pacific Coastal and Marine Science Center, Santa Cruz, CA.

    Online Links:

    This is part of the following larger work.

    Cochrane, Guy R., Conrad, James E., Reid, Jane A., Fangman, Sarah, and Golden, Nadine, 2005, Nearshore Benthic Habitat GIS for the Channel Islands National Marine Sanctuary and Southern California State Fisheries Reserves, Volume II Edition: 1.0: Open-File Report 2005-1170, U.S. Geological Survey, Pacific Coastal and Marine Science Center, Santa Cruz, CA.

    Online Links:

  2. What geographic area does the data set cover?
    West_Bounding_Coordinate: -119.532691
    East_Bounding_Coordinate: -119.450034
    North_Bounding_Coordinate: 34.028426
    South_Bounding_Coordinate: 33.977056
  3. What does it look like?
    http://pubs.usgs.gov/of/2005/1170/images/sanphab.jpg (JPEG)
    JPEG image of South Anacapa Passage habitat polygons
  4. Does the data set describe conditions during a particular time period?
    Beginning_Date: 01-Mar-1999
    Ending_Date: 18-Jul-2000
    Currentness_Reference:
    ground condition
  5. What is the general form of this data set?
    Geospatial_Data_Presentation_Form: vector digital data
  6. How does the data set represent geographic features?
    1. How are geographic features stored in the data set?
      This is a Vector data set. It contains the following vector data types (SDTS terminology):
      • G-polygon (55053)
    2. What coordinate system is used to represent geographic features?
      Grid_Coordinate_System_Name: Universal Transverse Mercator
      Universal_Transverse_Mercator:
      UTM_Zone_Number: 10
      Transverse_Mercator:
      Scale_Factor_at_Central_Meridian: 0.999600
      Longitude_of_Central_Meridian: -123.000000
      Latitude_of_Projection_Origin: 0.000000
      False_Easting: 500000.000000
      False_Northing: 0.000000
      Planar coordinates are encoded using coordinate pair
      Abscissae (x-coordinates) are specified to the nearest .000016
      Ordinates (y-coordinates) are specified to the nearest .000016
      Planar coordinates are specified in meters
      The horizontal datum used is North American Datum of 1983.
      The ellipsoid used is Geodetic ReferenceSystem 80.
      The semi-major axis of the ellipsoid used is 6378137.
      The flattening of the ellipsoid used is 1/298.2572222.
  7. How does the data set describe geographic features?
    Entity_and_Attribute_Overview:
    
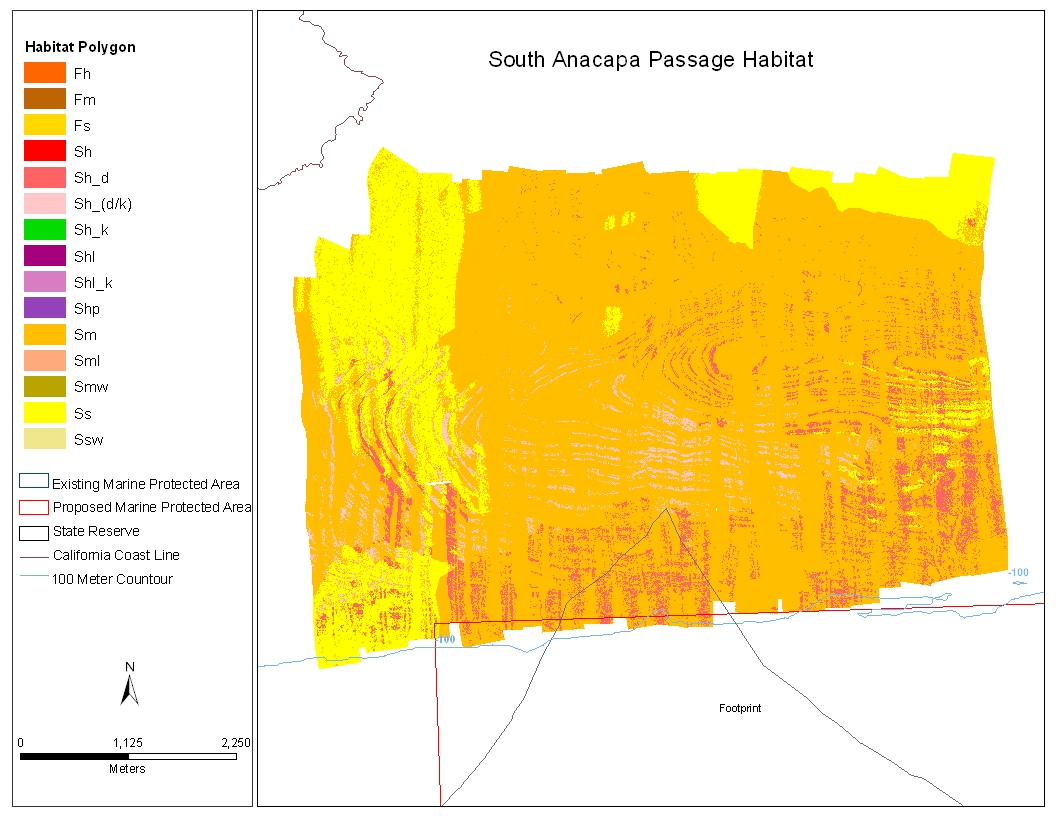
    sanahab Fields:
    
    NAME		ALIAS	TYPE	LENGTH	PRECISION	SCALE	NUMBER_FORMAT
    ID	  	ID	Double      10         10           0	      Numeric
    GRIDCODE        GRIDCODE	Double      10         10           0         Numeric
    CODE      	CODE   	String      10         10           0               -
    MEGA_ID   	MEGA_ID String       5          0           0               -
    MSO_MRC_ID    MSO_MRC_ID String       5          0           0               -
    MDFR_ID		MDFR_ID	String       5          0           0               -
    BOTTOM_ID      BOTTOM_ID String       5          0           0               -
    GEO_UNIT	       GEO_UNIT String	    50		0	    0		    -
    Area		Area	Double	    19         18          11          Numeric
    
    Benthic habitat classification attributes: megahabitat, bottom induration, meso-macrohabitat, and modifiers from Green and others, 1999. CODE is a combination of the habitat attributes. MEGA_ID is usually S for Shelf, but may be F for basin or canyon flank. BOTTOM_ID is h for hard bottom, m for mixed hard and soft bottom, or s for soft sediment bottom MSO_MRC_ID are visual observations when sand waves (w) were observed. These macrohabitats described in Greene and others 1999. MDFR_ID are modifiers to describe the texture or lithology of the seafloor and appear in the code preceded by an underscore (_). Including; fractured (_f), differently eroded (_d), kelp (_k), and limestone (_l)
    Entity_and_Attribute_Detail_Citation:
    Habitat attribute types are Modified after Greene, G.H., Yoklavich, M.M., Starr, R.M., O'Connell, V.M., Wakefield, W.W., Sullivan, D.E., McRea, J.E., and Cailliet, G.M., 1999. A classification scheme for deep seafloor habitats. Oceanologica Acta, 22, 663-678.

Who produced the data set?

  1. Who are the originators of the data set? (may include formal authors, digital compilers, and editors)
    • Guy R. Cochrane
  2. Who also contributed to the data set?
    Thanks to the Staff of the Channel Islands National Marine Sanctuary, the crew of the NOAA R/V Ballena, the crew of the NOAA R/V MacArthur, and the crew of the UCSD R/V Sproul.
  3. To whom should users address questions about the data?
    U.S. Geological Survey, Pacific Coastal and Marine Science Center
    Attn: PCMSC Science Data Coordinator
    2885 Mission Street
    Santa Cruz, CA
    US

    831-427-4747 (voice)
    pcmsc_data@usgs.gov

Why was the data set created?

These data are intended for science researchers, students, policy makers, and the general public. The data can be used with geographic information systems (GIS) software to display geologic and oceanographic information.

How was the data set created?

  1. From what previous works were the data drawn?
  2. How were the data generated, processed, and modified?
    Date: 01-Mar-2006 (process 1 of 4)
    Guy Cochrane prepared image mosaic image mosaic sanp1m.img
    -------generation of entropy and homogeniety values----texscal TexScal, W = 5, D = 1 wd=6 wd2=3 LINES: 5401 SAMPLES: 7394 Input matrix filename sanp1m.img Valid pixels processed: 33052325.000000 bmin = 0 bmax = 254 emin = 2.426872 emax = 5.460869 hmin = 0.020825 hmax = 1.977539 entropy correction = 84 homogeneity correction = 130 texgen Input Matrix filename prefix: sanp1m Entropy minimum value: 2.426872 Homogeneity minimum value: 0.020825 Entropy correction value: 84.000000 Homogeneity correction value: 130.000000 LINES: 5401 SAMPLES: 7394 W 5 D 1 WD 6 WD2 3 Program: TexGen, W = 5, D = 1 wd=6 wd2=3 LINES: 5401 SAMPLES: 7394 Input matrix filename sanp1mhom.img Valid pixels processed: 33052325.000000
    ---------classification of rock (hard) areas-------------
    
    texsig created the following signature files: hirock.xyz starting line: 1847 starting sample: 2011 ending line: 1856 ending sample: 2020 hirock2.xyz starting line: 1713 starting sample: 1984 ending line: 1722 ending sample: 1993 hirock3.xyz starting line: 2642 starting sample: 4125 ending line: 2643 ending sample: 4127 hirock4.xyz starting line: 2470 starting sample: 3815 ending line: 2471 ending sample: 3817 hirock5.xyz starting line: 2445 starting sample: 4316 ending line: 2446 ending sample: 4317 texclass signature files: hirock.xyz hirock2.xyz hirock3.xyz hirock4.xyz hirock5.xyz range limit: 6 percentage of habitat defined: 22.7, assigned DN = 255 output image file: sanp1mhirock3.img transferred to desktop for editing noise with photoshop opened sanp1mhirock3.img in photoshop with sanp1m.tif as background sanp1mhirock3.img set to 50 percent transparency with layer mask to paint out noise with black with noise satisfactorily painted, out applied layer mask to remove noise saved edited layer as sanp1mhirock3f.img sanp1mhirock3f.img transferred to rouse
    -----------classification of soft areas-------------------
    
    texsig created the following signature files: mud1.xyz starting line: 1546 starting sample: 909 ending line: 1555 ending sample: 918 mud2.xyz starting line: 1505 starting sample: 932 ending line: 1514 ending sample: 941 mud3.sig starting line: 771 starting sample: 1267 ending line: 780 ending sample: 1276 mud4.sig starting line: 709 starting sample: 5812 ending line: 718 ending sample: 5821 texclass signature files: mud1.xyz mud2.xyz mud3.xyz mud4.sig range limit: 5 percentage of habitat defined: 334.1, assigned DN = 255 output image file: sanp1mmud5.img transferred to desktop for editing noise with photoshop opened sanp1mmud3.img in photoshop with sanp1m.tif as background sanp1mmud5.img set to 50 percent transparency with layer mask to paint out noise with black with noise satisfactorily painted out, applied layer mask to remove noise saved edited layer as sanp1mmud5f.img sanp1mmud5f.img transferred to rouse
    -----------classification of mixed areas-------------------
    
    Due to high levels of noise in this mosaic, attempts to classify mixed areas using texclass were unsatisfactory. Texclass consistently produced classification of mixed areas that included large amounts of nadir- and edge-noise as well as other bottom types, especially rocky (hard), as mixed. Therefore, at this point all areas not classifying as hard or soft are considered mixed.
    Date: 01-Mar-2006 (process 2 of 4)
    -----------------------------Nadine Golden started here-----------------------------------------
    
    //Created grids and polygons from image files from Jamie Conrad. 1. Converted image to grids in ArcInfo using imagegrid command immagegrid sanp1mmud5f.tif sanp1msoft1g immagegrid sanp1mrock.tif sanp1mrock1g 2. Converted grids to polygons for editing using ArcGIS Spatial Analysis Extension option: Rasture to Feature. sanp1msoft1g --> sanp1msoft1p sanp1mrock1g --> sanp1mrock1p 3. Created a back layer for all other data. In this data set the all data layer was set to 170 gridcode to represent mixed areas. 4. Edited, cleaned, polygons -reclassified noise areaas that appeared in new mixed area but the good data shows that these areas should be soft bottom not mixed. Creted another back layer for the upper north west corner to classify mixed areas as half way between mixed and soft, gridcode equal to 128. for the bottom of the data set, the noise classified as mixed was reclassified as soft--also due to what good data shows. 5. Converted all edited polygons back to grids using ArcGIS Spatial Analysis Extension option: Feature to Rasture.
    -------------------------------------------------------------------------------------------
    
    //Merged final grids to make one grid of all layers 1. Merged all grids in Spatial Analyst tool Raster Calculator -set option to Extent-->union of inputs. -used the merge command in raster calculator dialogue box: sanp1mhab1g = merge([sanp1mrock4g],[sanp1msoft1g],[sanp1mmxsft1g],[sanp1mix1g])
    -------------------------------------------------------------------------------------------
    
    //Filtered grid to decrease polygon total steps: 1. Filtered original grid two time using the "low" filter default: filter sanp1mhab13g sanp1mhab13g filter sanp1mhab13g sanp1mhab13g 2. Used spatial anlysis reclassification option to reclassify new with remap categories: 1 128 : 85 129 189 : 170 190 255 : 255 3. Used Toolbox Raster to Features: converted new grid to polygon shapefile new polygon shapefile: polygons original polygon shapefile: polygons
    Date: 19-Oct-2020 (process 3 of 4)
    Edited metadata to add keywords section with USGS persistent identifier as theme keyword. No data were changed. Person who carried out this activity:
    U.S. Geological Survey
    Attn: VeeAnn A. Cross
    Marine Geologist
    384 Woods Hole Road
    Woods Hole, MA

    508-548-8700 x2251 (voice)
    508-457-2310 (FAX)
    vatnipp@usgs.gov
    Date: 21-Oct-2021 (process 4 of 4)
    Edited metadata to add USGS Thesaurus keywords and perform minor edits to bring the metadata up to current PCMSC standards. No data were changed. The metadata available from a harvester may supersede metadata bundled within a download file. Users are advised to compare the metadata dates to determine which metadata file is most recent. Person who carried out this activity:
    U.S. Geological Survey
    Attn: Susan Cochran
    Geologist
    2885 Mission Street
    Santa Cruz, CA

    831-460-7545 (voice)
    scochran@usgs.gov
  3. What similar or related data should the user be aware of?

How reliable are the data; what problems remain in the data set?

  1. How well have the observations been checked?
    Habitat polygons dervived in ArcGIS 9.0 from a georefereced sidescan sonar mosaic tiff.
    Habitat attribute types are from Greene, G.H., Yoklavich, M.M., Starr, R.M., O'Connell, V.M., Wakefield, W.W., Sullivan, D.E., McRea, J.E., and Cailliet, G.M., 1999. A classification scheme for deep seafloor habitats. Oceanologica Acta, 22, 663-678.
    Macrohabitat attributes assignments are limited to areas where bottom video has been collected.
  2. How accurate are the geographic locations?
    Accuracy of the horizontal coordinates is on the order of 10 m based on uncertainty in position of sidescansonar fish relative to ships gps position.
  3. How accurate are the heights or depths?
  4. Where are the gaps in the data? What is missing?
    Macrohabitat classification is missing where video information is lacking
  5. How consistent are the relationships among the observations, including topology?
    Polygon topology present. Every polygon has a label and are all polygons closed

How can someone get a copy of the data set?

Are there legal restrictions on access or use of the data?
Access_Constraints: None
Use_Constraints:
USGS-authored or produced data and information are in the public domain from the U.S. Government and are freely redistributable with proper metadata and source attribution. Please recognize and acknowledge the U.S. Geological Survey as the originators of the dataset and in products derived from these data.
  1. Who distributes the data set? (Distributor 1 of 1)
    Guy R. Cochrane
    U.S. Geological Survey
    Geophysicist
    2885 Mission Street
    Santa Cruz, CA
    USA

    (831) 427-4754 (voice)
    (831) 427-4748 (FAX)
    gcochrane@usgs.gov
  2. What's the catalog number I need to order this data set? Downloadable Data
  3. What legal disclaimers am I supposed to read?
    Although these data have been used by the U.S. Geological Survey (USGS), U.S. Department of the Interior (DOI), no warranty expressed or implied is made by the U.S. Geological Survey as to the accuracy of the data. The act of distribution shall not constitute any such warranty, and no responsibility is assumed by the USGS in the use of these data or related materials.
    Any use of trade, product, or firm names is for descriptive purposes only and does not imply endorsement by the U.S. Government.
  4. How can I download or order the data?
    • Availability in digital form:
      Data format: The SHP file contains the geospatial data. The SHX file contains the index of the geospatial data. The DBF file contains the attribute data in dBase format. The PRJ file contains the coordinate system information (optional). The AVL file contains the legend information (optional). The SBN and SBX files contain the spatial index of the geospatial data (optional). The XML file contains the metadata describing the data set <data set name>.shp.xml. An ASCII version of the metadata file. A browse graphic showing the data layer coverage and extent (optional). in format shapefile (version 3.3) ESRI Shapefile Format Size: 30.2
      Network links: http://pubs.usgs.gov/of/2005/1170/habitat/sanphab.tgz
      http://pubs.usgs.gov/of/2005/1170/catalog.html
      https://doi.org/10.3133/ofr20051170
    • Cost to order the data: None

  5. What hardware or software do I need in order to use the data set?
    These data are available in Environmental Systems Research Institute (ESRI) shapefile format. The user must have ArcGIS or ArcView 3.0 or greater software to read and process the data file. In lieu of ArcView or ArcGIS, the user may utilize another GIS application package capable of the importing data. A free data viewer, arcexplorer, capable of displaying the data is available from ESRI at www.esri.com.

Who wrote the metadata?

Dates:
Last modified: 21-Oct-2021
Metadata author:
U.S. Geological Survey, Pacific Coastal and Marine Science Center
Attn: PCMSC Science Data Coordinator
2885 Mission Street
Santa Cruz, CA
US

831-427-4747 (voice)
pcmsc_data@usgs.gov
Metadata standard:
Content Standard for Digital Geospatial Metadata (FGDC-STD-001-1998)

This page is <https://cmgds.marine.usgs.gov/catalog/pcmsc/SeriesReports/OFR/OFR_2005-1170/sanphab.shp.faq.html>
Generated by mp version 2.9.50 on Fri Oct 22 09:18:53 2021