Post-Hurricane Joaquin coastal oblique Aerial Photographs Collected from the South Carolina/North Carolina Border to Montauk Point, New York, October 7-9, 2015

Metadata also available as - [Outline] - [Parseable text] - [XML]

Frequently anticipated questions:


What does this data set describe?

Title:
Post-Hurricane Joaquin coastal oblique Aerial Photographs Collected from the South Carolina/North Carolina Border to Montauk Point, New York, October 7-9, 2015
Abstract:
The U.S. Geological Survey (USGS) conducts baseline and storm-response photography missions to document and understand the changes in vulnerability of the Nation's coasts to extreme storms. On October 7-9, 2015, the USGS conducted an oblique aerial photographic survey from South Carolina/North Carolina border to Montauk Point, New York, aboard a Cessna 182 aircraft at an altitude of 500 feet (ft) and approximately 1,200 ft offshore (Figure 2, http://pubs.usgs.gov/ds/0995/html/ds995_fig2.html). This mission was flown to collect data for assessing incremental changes since the last survey, flown in October 2014 (Virginia to New York, http://cmgds.marine.usgs.gov/fan_info.php?fan=2014-330-FA), November 2012 (northern North Carolina, http://cmgds.marine.usgs.gov/fan_info.php?fan=12CCH04) and May 2008 (southern North Carolina, http://cmgds.marine.usgs.gov/fan_info.php?fan=08ACH01), and can be used for assessing future coastal change. The photographs provided are Joint Photographic Experts Group (JPEG) images. The photograph locations are an estimate of the position of the aircraft and do not indicate the location of the feature in the images (See the Navigation Data page, http://pubs.usgs.gov/ds/0995/html/ds995_nav.html). These photographs document the configuration of the barrier islands and other coastal features at the time of the survey. ExifTool was used to add the following to the header of each photo: time of collection, Global Positioning System (GPS) latitude, GPS longitude, keywords, credit, artist (photographer), caption, copyright, and contact information. Photographs can be opened directly with any JPEG-compatible image viewer by clicking on a thumbnail on the contact sheet. All image times are recorded in Coordinated Universal Time (UTC). Table 1 (http://pubs.usgs.gov/ds/0995/html/ds995_table.html) provides detailed information about the assigned location, name, date, and time the photograph was taken along with links to the photograph. In addition to the photographs, a Google Earth Keyhole Markup Language (KML) file is provided and can be used to view the images by clicking on the marker and then clicking on either the thumbnail or the link above the thumbnail. The KML files were created using the photographic navigation files. Note: A KML number was assigned to each photograph to aid navigation of the Google Earth file. These numbers correspond to the site labels in Google Earth.
Supplemental_Information:
For a summary of field activity 2015-338-FA please see http://cmgds.marine.usgs.gov/fan_info.php?fan=2015-338-FA. Bounding coordinates for the oblique aerial survey are derived from the overall flight path found in the raw GPS data. Ancillary files included in this publication are ds995_2015-338-FA_1007_gpsmap696.txt, ds995_2015-338-FA.csv, and ds995_2015-338-FA.kml, in addition to the digitized oblique aerial image files.
  1. How might this data set be cited?
    Morgan, Karen L.M., 2016, Post-Hurricane Joaquin coastal oblique Aerial Photographs Collected from the South Carolina/North Carolina Border to Montauk Point, New York, October 7-9, 2015: U.S. Geological Survey Data Series Data Series 995, U.S. Geological Survey, St. Petersburg, Fla..

    Online Links:

    Other_Citation_Details: None
  2. What geographic area does the data set cover?
    West_Bounding_Coordinate: -78.722282
    East_Bounding_Coordinate: -71.8348340
    North_Bounding_Coordinate: 41.0806580
    South_Bounding_Coordinate: 33.815322
  3. What does it look like?
    http://pubs.usgs.gov/ds/0995/downloads/maps/index.jpg (JPG)
    Index map of survey area flight path during USGS field activity 2015-338-FA.
    http://pubs.usgs.gov/ds/0995/html/html_images/fig2.jpg (JPG)
    Graphic of acquisition geometry (Figure 2) for USGS field activity 2015-338-FA. Graphic shows basic flight distance from the shore and elevation during the survey for the aircraft used.
    http://pubs.usgs.gov/ds/0995/html/html_images/contents.jpg (JPG)
    Graphic used on the Contents page of the USGS field activity 2015-338-FA data series report. Graphic shows the directory structure of the publication.
    http://pubs.usgs.gov/ds/0995/downloads/maps/2015-338-FA_1.jpg (JPG)
    Map showing the extent of Area 1 for the post-Hurricane Joaquin coastal oblique aerial photographs from Cape Charles, Virginia, to Ocean City, Maryland. The flight path, divided into 5-minute segments, is represented by the alternating purple and yellow lines. Pages containing thumbnail images of photographs, referred to as contact sheets, were created based on these segments.
    http://pubs.usgs.gov/ds/0995/downloads/maps/2015-338-FA_2.jpg (JPG)
    Map showing the extent of Area 2 for the post-Hurricane Joaquin coastal oblique aerial photographs from Ocean City, Maryland, to Little Egg Inlet, New Jersey. The flight path, divided into 5-minute segments, is represented by the alternating purple and yellow lines. Pages containing thumbnail images of photographs, referred to as contact sheets, were created based on these segments.
    http://pubs.usgs.gov/ds/0995/downloads/maps/2015-338-FA_3.jpg (JPG)
    Map showing the extent of Area 3 for the post-Hurricane Joaquin coastal oblique aerial photographs from Little Egg Inlet, New Jersey, to Sandy Hook, New Jersey. The flight path, divided into 5-minute segments, is represented by the alternating purple and yellow lines. Pages containing thumbnail images of photographs, referred to as contact sheets, were created based on these segments.
    http://pubs.usgs.gov/ds/0995/downloads/maps/2015-338-FA_4.jpg (JPG)
    Map showing the extent of Area 4 for the post-Hurricane Joaquin coastal oblique aerial photographs from Breezy Point, New York, to Patchogue, New York. The flight path, divided into 5-minute segments, is represented by the alternating purple and yellow lines. Pages containing thumbnail images of photographs, referred to as contact sheets, were created based on these segments.
    http://pubs.usgs.gov/ds/0995/downloads/maps/2015-338-FA_5.jpg (JPG)
    Map showing the extent of Area 5 for the post-Hurricane Joaquin coastal oblique aerial photographs from Patchogue, New York, to Montauk Point, New York. The flight path, divided into 5-minute segments, is represented by the alternating purple and yellow lines. Pages containing thumbnail images of photographs, referred to as contact sheets, were created based on these segments.
    http://pubs.usgs.gov/ds/0995/downloads/maps/2015-338-FA_6.jpg (JPG)
    Map showing the extent of Area 6 for the post-Hurricane Joaquin coastal oblique aerial photographs from South Carolina/North Carolina border to Beaufort, North Carolina. The flight path, divided into 5-minute segments, is represented by the alternating purple and yellow lines. Pages containing thumbnail images of photographs, referred to as contact sheets, were created based on these segments.
    http://pubs.usgs.gov/ds/0995/downloads/maps/2015-338-FA_7.jpg (JPG)
    Map showing the extent of Area 7 for the post-Hurricane Joaquin coastal oblique aerial photographs from Beaufort, North Carolina, to Rodanthe, North Carolina. The flight path, divided into 5-minute segments, is represented by the alternating purple and yellow lines. Pages containing thumbnail images of photographs, referred to as contact sheets, were created based on these segments.
    http://pubs.usgs.gov/ds/0995/downloads/maps/2015-338-FA_8.jpg (JPG)
    Map showing the extent of Area 8 for the post-Hurricane Joaquin coastal oblique aerial photographs from Rodanthe, North Carolina, to Norfolk, Virginia. The flight path, divided into 5-minute segments, is represented by the alternating purple and yellow lines. Pages containing thumbnail images of photographs, referred to as contact sheets, were created based on these segments.
    http://pubs.usgs.gov/ds/0995/downloads/maps/inset04_oceancitymd.jpg (JPG)
    Inset map showing the extent of inset04_oceancitymd.jpg for the post-Hurricane Joaquin coastal oblique aerial photographs from Ocean City, Maryland, through the north end of Assateague Island, Maryland. The flight path, divided up into 5-minute segments, is represented by the alternating purple and yellow lines. Pages containing thumbnail images of photographs, referred to as contact sheets, were created based on these segments.
    http://pubs.usgs.gov/ds/0995/downloads/maps/inset05_mantoloking.jpg (JPG)
    Inset map showing the extent of inset05_mantoloking.jpg for the post-Hurricane Joaquin coastal oblique aerial photographs from Manasquan, New Jersey, to Mantoloking, New Jersey. The flight path, divided up into 5-minute segments, is represented by the alternating purple and yellow lines. Pages containing thumbnail images of photographs, referred to as contact sheets, were created based on these segments.
    http://pubs.usgs.gov/ds/0995/downloads/maps/inset06_midfireisland.jpg (JPG)
    Inset map showing the extent of inset06_midfireisland.jpg for the post-Hurricane Joaquin coastal oblique aerial photographs from Cherry Grove, New York, to Davis Park, New York. The flight path, divided up into 5-minute segments, is represented by the alternating purple and yellow lines. Pages containing thumbnail images of photographs, referred to as contact sheets, were created based on these segments.
    http://pubs.usgs.gov/ds/0995/downloads/maps/inset07_oldinlet.jpg (JPG)
    Inset map showing the extent of inset07_oldinlet.jpg for the post-Hurricane Joaquin coastal oblique aerial photographs from Smith Point, New York, to Bellport Beach, New York. The flight path, divided up into 5-minute segments, is represented by the alternating purple and yellow lines. Pages containing thumbnail images of photographs, referred to as contact sheets, were created based on these segments.
    http://pubs.usgs.gov/ds/0995/downloads/maps/inset08_cupsoque.jpg (JPG)
    Inset map showing the extent of inset08_cupsoque.jpg for the post-Hurricane Joaquin coastal oblique aerial photographs from West Hampton Dunes, New York, to Smith Point County Park, New York. The flight path, divided up into 5-minute segments, is represented by the alternating purple and yellow lines. Pages containing thumbnail images of photographs, referred to as contact sheets, were created based on these segments.
    http://pubs.usgs.gov/ds/0995/downloads/maps/inset09_shinnecock.jpg (JPG)
    Inset map showing the extent of inset09_shinnecock.jpg for the post-Hurricane Joaquin coastal oblique aerial photographs from East Quogue, New York, to Southampton, New York. The flight path, divided up into 5-minute segments, is represented by the alternating purple and yellow lines. Pages containing thumbnail images of photographs, referred to as contact sheets, were created based on these segments.
    http://pubs.usgs.gov/ds/0995/downloads/maps/inset10_capefear.jpg (JPG)
    Inset map showing the extent of inset10_capefear.jpg for the post-Hurricane Joaquin coastal oblique aerial photographs of Cape Fear, North Carolina. The flight path, divided up into 5-minute segments, is represented by the alternating purple and yellow lines. Pages containing thumbnail images of photographs, referred to as contact sheets, were created based on these segments.
    http://pubs.usgs.gov/ds/0995/downloads/maps/inset11_capelookout.jpg (JPG)
    Inset map showing the extent of inset11_capelookout.jpg for the post-Hurricane Joaquin coastal oblique aerial photographs of Cape Lookout, North Carolina. The flight path, divided up into 5-minute segments, is represented by the alternating purple and yellow lines. Pages containing thumbnail images of photographs, referred to as contact sheets, were created based on these segments.
    http://pubs.usgs.gov/ds/0995/downloads/maps/inset12_hatteras.jpg (JPG)
    Inset map showing the extent of inset12_hatteras.jpg for the post-Hurricane Joaquin coastal oblique aerial photographs from Hatteras, North Carolina, to Frisco, North Carolina. The flight path, divided up into 5-minute segments, is represented by the alternating purple and yellow lines. Pages containing thumbnail images of photographs, referred to as contact sheets, were created based on these segments.
    http://pubs.usgs.gov/ds/0995/downloads/maps/inset13_capehatteras.jpg (JPG)
    Inset map showing the extent of inset13_capehatteras.jpg for the post-Hurricane Joaquin coastal oblique aerial photographs of Cape Hatteras, North Carolina. The flight path, divided up into 5-minute segments, is represented by the alternating purple and yellow lines. Pages containing thumbnail images of photographs, referred to as contact sheets, were created based on these segments.
    http://pubs.usgs.gov/ds/0995/downloads/maps/inset14_rodanthe.jpg (JPG)
    Inset map showing the extent of inset14_rodanthe.jpg for the post-Hurricane Joaquin coastal oblique aerial photographs from Rodanthe, North Carolina, to Hog Island, North Carolina. The flight path, divided up into 5-minute segments, is represented by the alternating purple and yellow lines. Pages containing thumbnail images of photographs, referred to as contact sheets, were created based on these segments.
    http://pubs.usgs.gov/ds/0995/downloads/maps/inset15_peaisland.jpg (JPG)
    Inset map showing the extent of inset15_peaisland.jpg for the post-Hurricane Joaquin coastal oblique aerial photographs at the ranger station in the Pea Island National Wildlife Refuge, North Carolina. The flight path, divided up into 5-minute segments, is represented by the alternating purple and yellow lines. Pages containing thumbnail images of photographs, referred to as contact sheets, were created based on these segments.
  4. Does the data set describe conditions during a particular time period?
    Beginning_Date: 07-Oct-2015
    Beginning_Time: 124955
    Ending_Date: 07-Oct-2015
    Ending_Time: 213257
    Currentness_Reference:
    ground condition
  5. What is the general form of this data set?
    Geospatial_Data_Presentation_Form:
    Multimedia presentation of JPEG images and point data in ASCII and CSV files
  6. How does the data set represent geographic features?
    1. How are geographic features stored in the data set?
      Indirect_Spatial_Reference: none
    2. What coordinate system is used to represent geographic features?
      Horizontal positions are specified in geographic coordinates, that is, latitude and longitude. Latitudes are given to the nearest 0.000001. Longitudes are given to the nearest 0.000001. Latitude and longitude values are specified in Decimal degrees. The horizontal datum used is North American 1983.
      The ellipsoid used is Geodetic Reference System 80.
      The semi-major axis of the ellipsoid used is 6378137.000000.
      The flattening of the ellipsoid used is 1/298.257222.
  7. How does the data set describe geographic features?
    Entity_and_Attribute_Overview:
    KML file: The Google Earth project is available as a KML file. The post-Hurricane Joaquin storm track KML was provided by Unisys Weather (http://weather.unisys.com/hurricane/index.php). The KML includes photo numbers, photo locations, and the storm track.
    Entity_and_Attribute_Overview:
    Unisys Weather, Post-Hurricane Joaquin storm track, available at http://weather.unisys.com/hurricane/index.php.
    Entity_and_Attribute_Overview:
    Graphic Image Files: The index map is a JPEG image. The index map shows the coastal oblique Aerial Photographs Collected from the South Carolina/North Carolina Border to Montauk Point, New York, October 7-9, 2015. The index map also shows twelve areas, which link to more detailed maps and indicate how the full-size photographs are divided into each area.
    Entity_and_Attribute_Overview:
    Navigation files: The processed files (*.csv) and the raw navigation files (*.txt) are comma-delimited and tab-delimited ASCII text files, respectively.
    Entity_and_Attribute_Overview: KML file: The KML file is ds995_2015-338-FA.kml.
    Entity_and_Attribute_Detail_Citation:
    Morgan, K.L.M., 2015, Baseline coastal oblique aerial photographs collected from the Virginia/North Carolina border to Montauk Point, New York, October 5-6, 2014: U.S. Geological Survey Data Series 958, accessed May 24, 2016, at https://doi.org/10.3133/ds958.
    Entity_and_Attribute_Detail_Citation:
    Morgan, K.L.M. and Krohn, M.D., 2014, Post-Hurricane Sandy coastal oblique aerial photographs collected from Cape Lookout, North Carolina, to Montauk, New York, November 4-6, 2012: U.S. Geological Survey Data Series 858,, accessed May 24, 2016, at https://doi.org/10.3133/ds858.
    Entity_and_Attribute_Detail_Citation:
    Morgan, K.L.M., 2009, Coastal change during Hurricane Isabel 2003: U.S. Geological Survey Fact Sheet 2009-3025, 2 p., accessed May 24, 2016, at https://pubs.usgs.gov/fs/2009/3025/.

Who produced the data set?

  1. Who are the originators of the data set? (may include formal authors, digital compilers, and editors)
    • Karen L.M. Morgan
  2. Who also contributed to the data set?
    Funding and (or) support for this study was provided by the USGS Coastal and Marine Geology Program (CMGP). The author wishes to thank photographer Carol McManus and pilot Lee McManus for their assistance in data collection. This report benefited from the comments and reviews of Robert Jenkins and Timothy Nelson with the USGS St. Petersburg Coastal and Marine Science Center (SPCMSC), St. Petersburg, Fla.
  3. To whom should users address questions about the data?
    K. Morgan
    USGS
    Geologist
    600 4th Street South
    St. Petersburg, FL
    USA

    (727) 502-8037 (voice)
    kmorgan@usgs.gov

Why was the data set created?

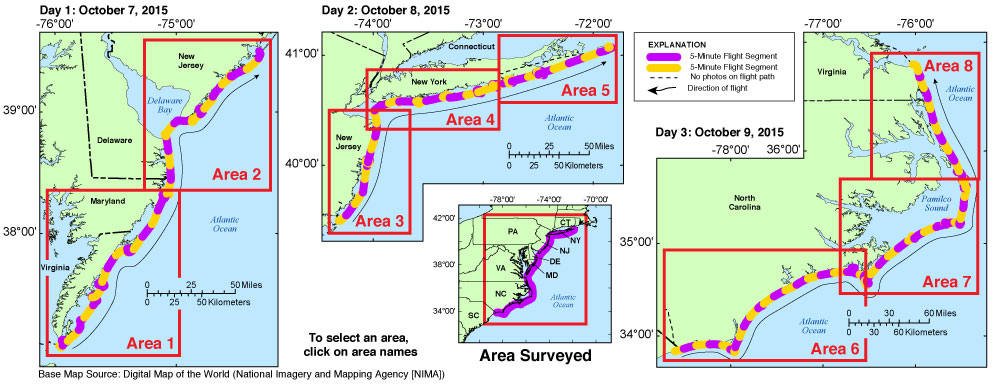
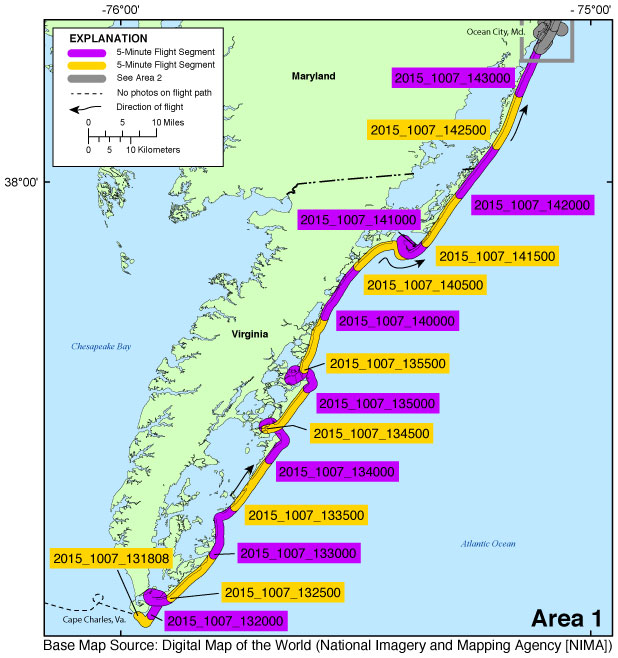
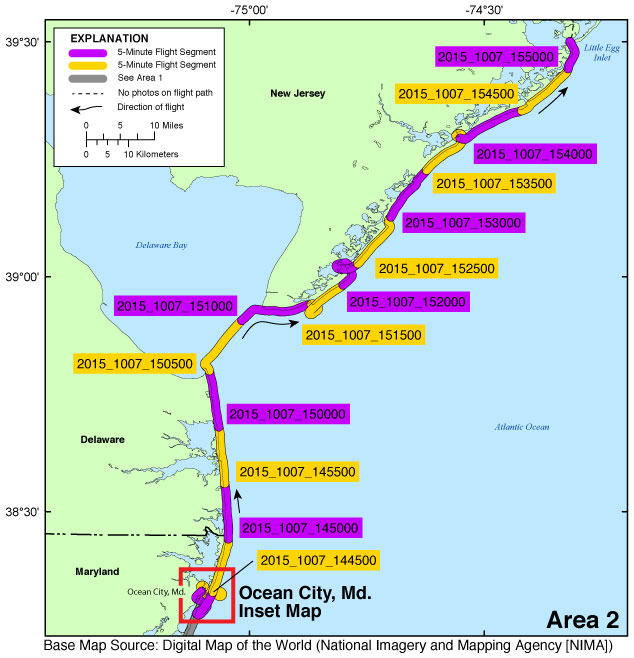
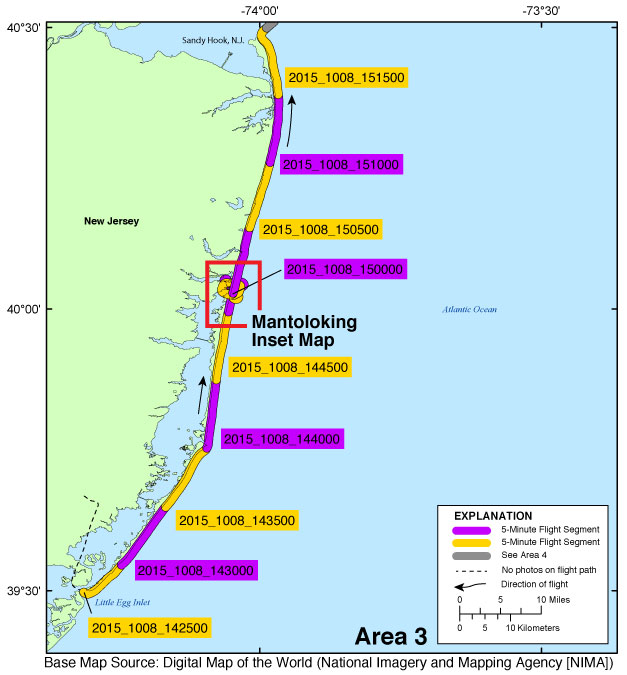
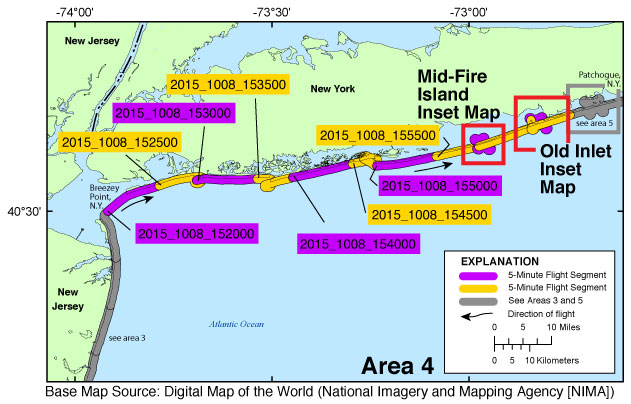
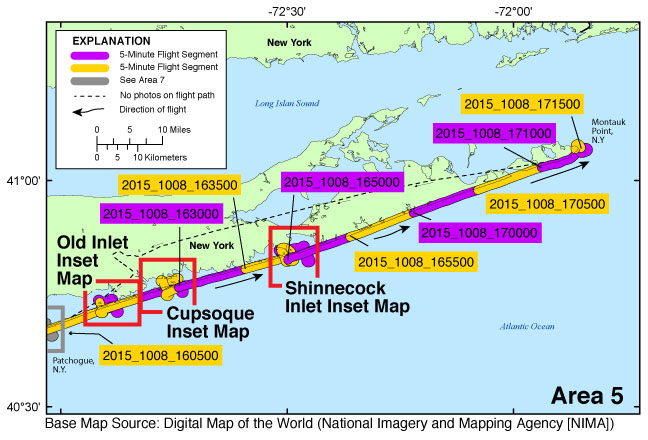
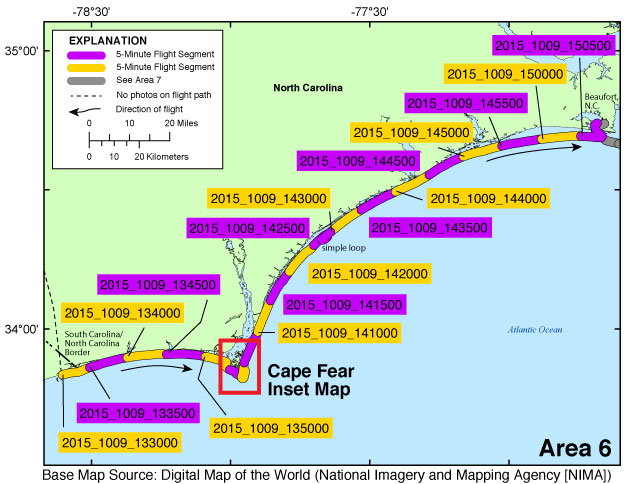
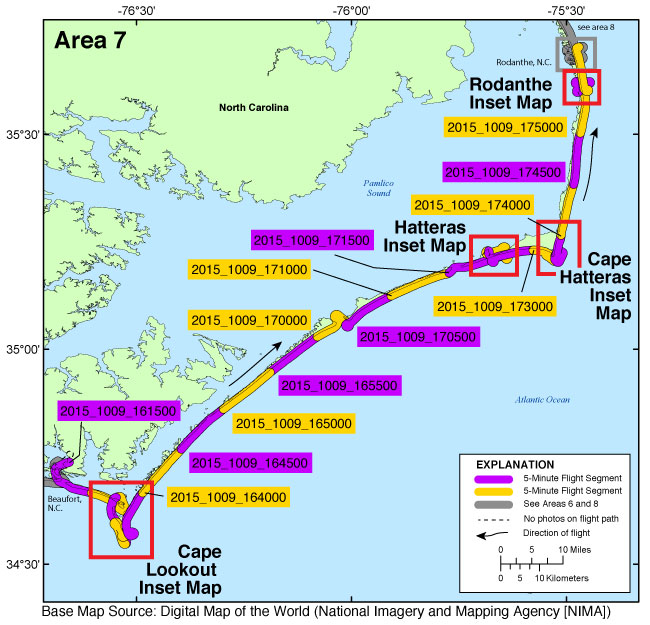
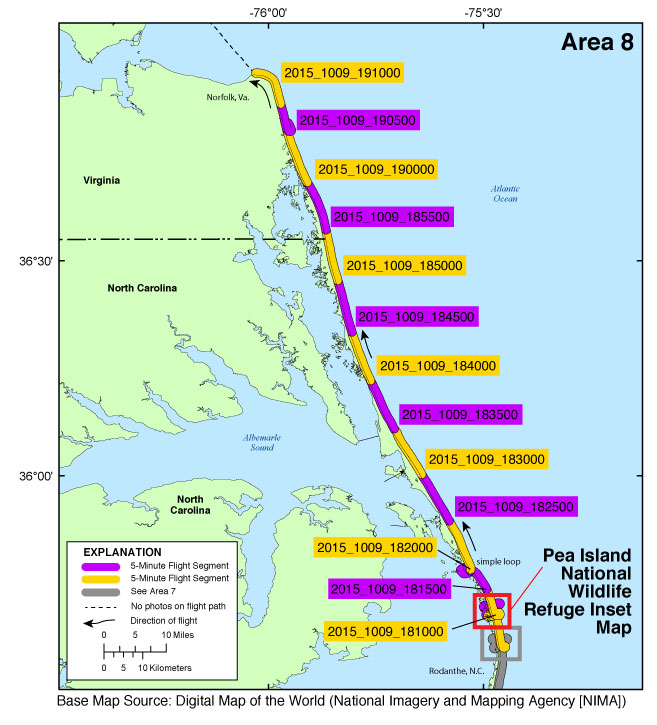
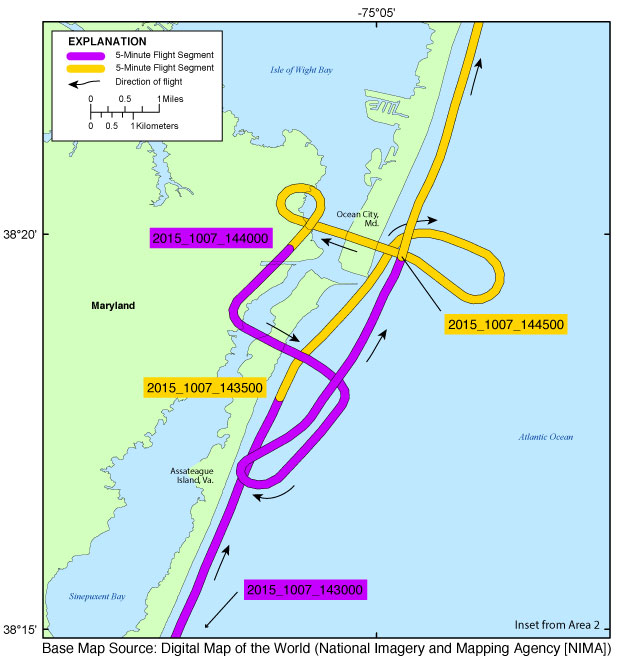
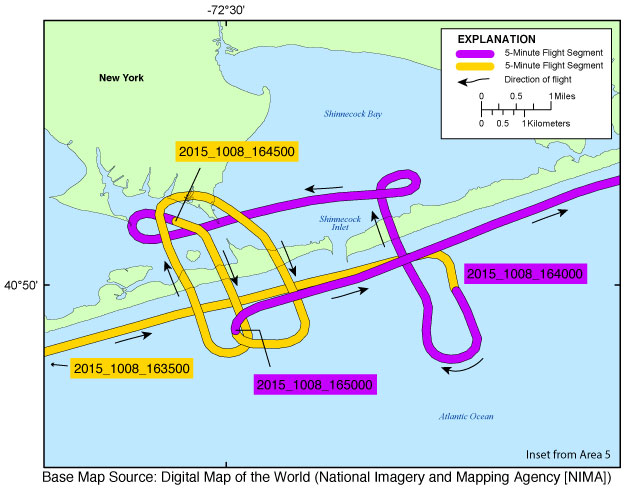
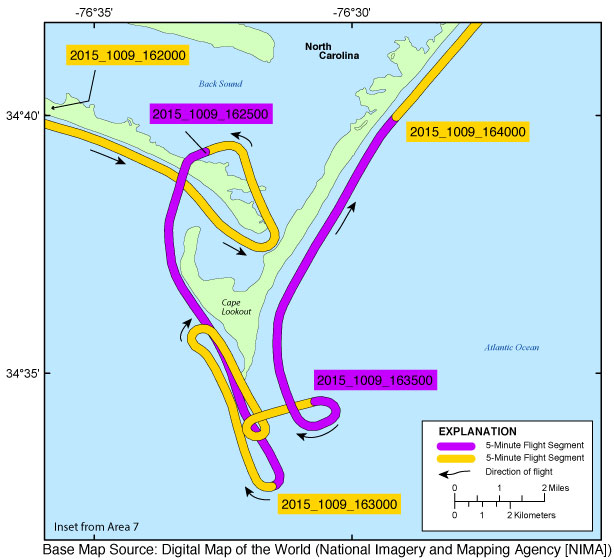
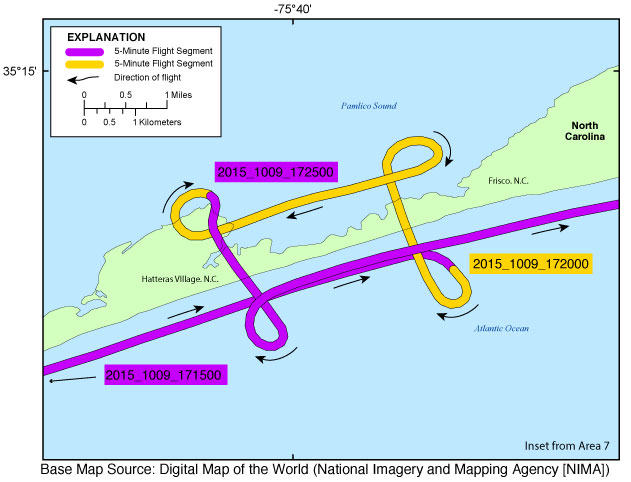
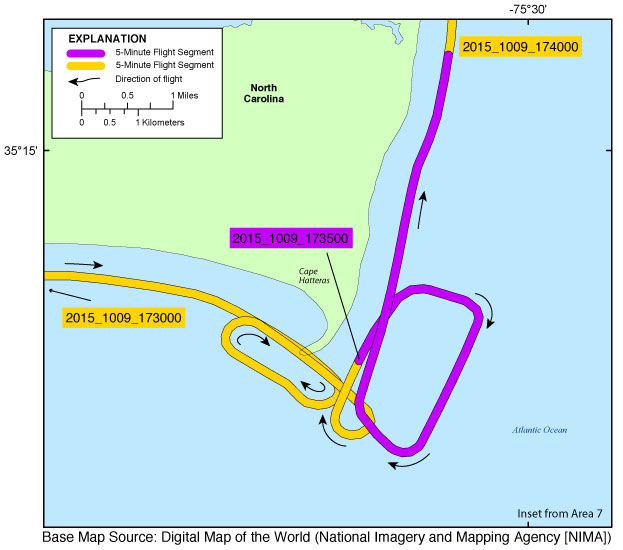
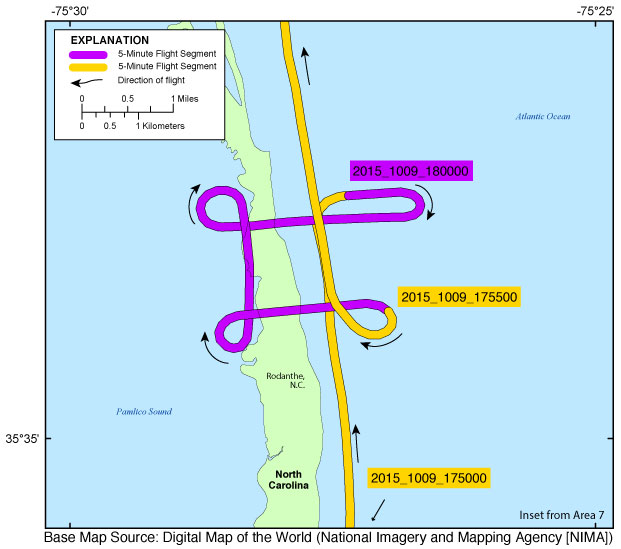
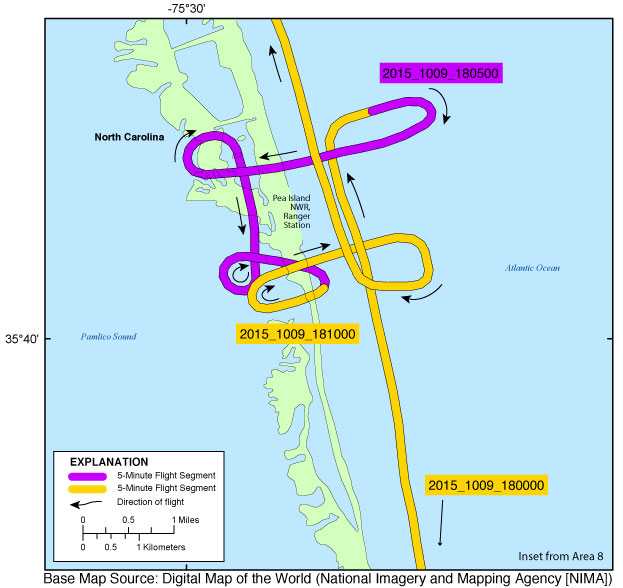
To provide access to digital photographs taken as part of the October 7-9, 2015, post-Hurricane Joaquin oblique aerial survey collected along the coast, from South Carolina/North Carolina border to Montauk Point, New York, and to provide access to attribute data that documents the time and location of where each photograph was taken.

How was the data set created?

  1. From what previous works were the data drawn?
  2. How were the data generated, processed, and modified?
    Date: 07-Oct-2015 (process 1 of 11)
    Image Acquisition: Photographs were taken using a Nikon D7100. Images were written to internal camera cards. Image size is approximately 24 megapixels. Person who carried out this activity:
    K. Morgan
    USGS
    Geologist
    600 4th Street South
    St. Petersburg, FL
    USA

    (727) 502-8037 (voice)
    kmorgan@usgs.gov
    Date: 15-Oct-2015 (process 2 of 11)
    Navigation Files: Navigation files (one per day) were extracted as comma-delimited ASCII text files from the Garmin GPSMAP 696. The GPS recorded latitude, longitude, date/time. Person who carried out this activity:
    K. Morgan
    USGS
    Geologist
    600 4th Street South
    St. Petersburg, FL
    USA

    (727) 502-8037 (voice)
    kmorgan@usgs.gov
    Date: 15-Oct-2015 (process 3 of 11)
    Image Aquisition: Images were taken with a Nikon D7100 and written to internal camera cards. Image size is approximately 24 megapixels. Images in JPG format were saved using the filename format yyyy_mmdd_hhmmssd.jpg (where the "d" signifies digital acquisition using the Nikon D7100). The names provide information about the photograph's year, month, day, hour, minute, and second. For example, image 2015_1007_133636d.jpg was taken October 7, 2015, at 13:36:36 UTC. An effort was made to set the Nikon D7100's internal clock to within 1 second of UTC at the beginning of the flight. Person who carried out this activity:
    K. Morgan
    USGS
    Geologist
    600 4th Street South
    St. Petersburg, FL
    USA

    (727) 502-8037 (voice)
    kmorgan@usgs.gov
    Date: 15-Oct-2015 (process 4 of 11)
    Navigation processing: Using a custom Perl script written by Karen Morgan, USGS: GPS data and image files were used to generate comma-separated-value (CSV) files containing latitude, longitude, and time record for each image. Each processed navigation file was saved as a CSV file, ds995_2015-338-FA.csv, using Microsoft Excel 2011. Person who carried out this activity:
    K. Morgan
    USGS
    Geologist
    600 4th Street South
    St. Petersburg, FL
    USA

    (727) 502-8037 (voice)
    kmorgan@usgs.gov
    Date: 15-Oct-2015 (process 5 of 11)
    HTML Creation: The digital images were organized into 5-minute (time) segments. These 5-minute segments were used to create HTML pages, called contact sheets. A contact sheet was created for every 5-minute segment of the survey. The contact sheets contain thumbnails of each of the photographs. Each thumbnail links to the corresponding full-size area map or photograph. Person who carried out this activity:
    K. Morgan
    USGS
    Geologist
    600 4th Street South
    St. Petersburg, FL
    USA

    (727) 502-8037 (voice)
    kmorgan@usgs.gov
    Date: 15-Oct-2015 (process 6 of 11)
    Geospatial Processing: The spreadsheets containing navigation data were edited using Microsoft Excel 2011 and saved as a CSV file to make them compatible with ArcGIS software. The latitude/longitude data from the CSV navigation file, called XSTORMS.h20151007_photographs, were used to produce Esri shapefiles using ArcGIS 10.1. These shapefiles were used to produce the JPEG maps included in this report. The shapefiles are not included in this report. Person who carried out this activity:
    K. Morgan
    USGS
    Geologist
    600 4th Street South
    St. Petersburg, FL
    USA

    (727) 502-8037 (voice)
    kmorgan@usgs.gov
    Date: 16-Feb-2016 (process 7 of 11)
    Survey map creation: The survey maps provided in this archive were created with Environmental Systems Research Institute (Esri) ArcGIS 10.1 software and saved as Adobe Illustrator (*.ai) files. Survey maps were edited using Adobe Illustrator CS6 and exported in JPEG format. Person who carried out this activity:
    K. Morgan
    USGS
    Geologist
    600 4th Street South
    St. Petersburg, FL
    USA

    (727) 502-8037 (voice)
    kmorgan@usgs.gov
    Date: 16-Feb-2016 (process 8 of 11)
    Google Earth file creation: The KML files were created using the photographic navigation file ds995_2015-338-FA.csv. The storm track (in KML format) was provided by the Unisys Weather. The USGS is the originator of all other layers. To aid navigation through the KML file, each image was assigned a sequential KML number. Table 1 of this report shows the KML number given to each image, the corresponding image name, and associated attributes. Each point on the Google Earth file contains the KML number, storm name, latitude, longitude, image name, geographic area, date, time, a thumbnail of the full-size photograph, and links to the full-size photographs and contact sheets. Person who carried out this activity:
    K. Morgan
    USGS
    Geologist
    600 4th Street South
    St. Petersburg, FL
    USA

    (727) 502-8037 (voice)
    kmorgan@usgs.gov
    Date: 15-Oct-2015 (process 9 of 11)
    EXIF headers: EXIF and International Press Telecommunications Council (IPTC) headers were populated from the command prompt using ExifTool (http://www.sno.phy.queensu.ca/~phil/exiftool, 2012) as part of the post-flight processing using a Perl script written by Karen Morgan, USGS, St. Petersburg, Fla. ExifTool added the following data to the EXIFHeader: time of collection, GPS latitude, GPS longitude, keywords, credit, artist (photographer), caption, copyright, and contact information. Person who carried out this activity:
    K. Morgan
    USGS
    Geologist
    600 4th Street South
    St. Petersburg, FL
    USA

    (727) 502-8037 (voice)
    kmorgan@usgs.gov
    Date: 16-Feb-2016 (process 10 of 11)
    FACS Log: In addition to the process steps described above, the following steps were taken to produce this data series: digital Field Activity Collection System (FACS) log was created at the beginning of each flight and saved as PDF and TXT files. In addition, an HTML-based format was used to present the various parts of this archive. Person who carried out this activity:
    K. Morgan
    USGS
    Geologist
    600 4th Street South
    St. Petersburg, FL
    USA

    (727) 502-8037 (voice)
    kmorgan@usgs.gov
    Date: 13-Oct-2020 (process 11 of 11)
    Added keywords section with USGS persistent identifier as theme keyword. Person who carried out this activity:
    U.S. Geological Survey
    Attn: VeeAnn A. Cross
    Marine Geologist
    384 Woods Hole Road
    Woods Hole, MA

    508-548-8700 x2251 (voice)
    508-457-2310 (FAX)
    vatnipp@usgs.gov
  3. What similar or related data should the user be aware of?

How reliable are the data; what problems remain in the data set?

  1. How well have the observations been checked?
    Best attempts were made to set the camera to UTC time on the GPS receivers at the beginning of each flight. Latitude, longitude, and time were collected at an interval of approximately once every three to five seconds. NOTE: Latitude and longitude positions in this report refer to the position of the aircraft, not the position of the landmarks photographed. Refer to the Process Steps below for more detail.
  2. How accurate are the geographic locations?
    Best attempts were made to maintain the same relative distance between the aircraft and the beach in order to keep a constant field of view.
  3. How accurate are the heights or depths?
  4. Where are the gaps in the data? What is missing?
    no known issues
  5. How consistent are the relationships among the observations, including topology?
    Data presented here include the digitally collected photographs in JPEG format with Exchangeable Image File (EXIF) header embedded with the individual photograph's location along the flight path of a post-Hurricane Joaquin coastal oblique aerial photographic survey of the coast, taken from the South Carolina/North Carolina border to Montauk Point, New York. This mission was flown on October 7-9, 2015, aboard a Cessna 182 aircraft, tail number N8479S. Crew members, contracted by the USGS in St. Petersburg, Fla., included Carol McManus, photography contractor, and pilot Lee McManus of Top Cover Virginia, LLC. Still photography was collected along the coast during this survey. GPS Data Collection - Instrument: Garmin GPSMAP 696. Data Collection Interval: Variable, every 5-15 seconds. Data File Format: American Standard Code for Information Interchange (ASCII). Number of files created: 1. Computer/Software: none. The GPS unit was used to record navigation fixes of the aircraft, not the position of the features imaged. For a summary of field activity 2015-338-FA please see http://cmgds.marine.usgs.gov/fan_info.php?fan=2015-338-FA.

How can someone get a copy of the data set?

Are there legal restrictions on access or use of the data?
Access_Constraints: None
Use_Constraints:
The U.S. Geological Survey requests to be acknowledged as the originator of the data in future products or derivative research.
  1. Who distributes the data set? (Distributor 1 of 1)
    K. Morgan
    USGS
    Geologist
    600 4th Street South
    St. Petersburg, FL
    USA

    (727) 502-8037 (voice)
    kmorgan@usgs.gov
  2. What's the catalog number I need to order this data set? U.S. Geological Survey Data Series 995
  3. What legal disclaimers am I supposed to read?
    This publication was prepared by an agency of the United States Government. Although these data were processed successfully on a computer system at the U.S. Geological Survey, no warranty expressed or implied is made regarding the display or utility of the data on any other system, nor shall the act of distribution imply any such warranty. The U.S. Geological Survey shall not be held liable for improper or incorrect use of the data described and (or) contained herein. Reference herein to any specific commercial product, process, or service by trade name, trademark, manufacturer, or otherwise does not constitute or imply its endorsement, recommendation, or favoring by the United States Government or any agency thereof.
  4. How can I download or order the data?
    • Availability in digital form:
      Data format: CSV: Comma separate values files representing table information collected during the flight. JPEG: Images can be opened directly with any JPEG-compatible image viewer. The survey's full-size photographs are divided into areas. ds995_2015-338-FA.kml has 9593 photographs. TXT: Text files representing the navigation files, FACS log, metadata and read-me files collected during and after the survey. KML: The KML provided may be viewed with Google Earth (http://www.google.com/earth/download/ge/agree.html). in format CSV, JPEG, TXT, KML
      Network links: https://pubs.usgs.gov/ds/0995/html/ds995_photos.html
    • Cost to order the data: Prices vary. None.

    • Special instructions:
      Publications are available from USGS Information Services, Box 25286, Federal Center, Denver, Col., 80225-0046 (telephone: 1-888-ASK-USGS, e-mail: infoservices@usgs.gov).

Who wrote the metadata?

Dates:
Last modified: 13-Oct-2020
Metadata author:
K. Morgan
USGS
Geologist
600 4th Street South
St. Petersburg, FL
USA

(727) 502-8037 (voice)
kmorgan@usgs.gov
Metadata standard:
FGDC Content Standards for Digital Geospatial Metadata (FGDC-STD-001-1998)

This page is <https://cmgds.marine.usgs.gov/catalog/spcmsc/ds995_metadata.faq.html>
Generated by mp version 2.9.50 on Tue Sep 21 18:18:55 2021