2-meter bathymetric data collected in 2012 by the U.S. Geological Survey in the Connecticut River during field activity 2012-024-FA (bathymetry and depth-colored hillshade relief GeoTIFFs)

Metadata also available as - [Outline] - [Parseable text] - [XML]

Frequently anticipated questions:


What does this data set describe?

Title:
2-meter bathymetric data collected in 2012 by the U.S. Geological Survey in the Connecticut River during field activity 2012-024-FA (bathymetry and depth-colored hillshade relief GeoTIFFs)
Abstract:
A geophysical and geological survey was conducted at the mouth of the Connecticut River from Old Saybrook to Essex, Connecticut, in September 2012. Approximately 230 linear kilometers of digital Chirp subbottom (seismic-reflection) and 234-kilohertz interferometric sonar (bathymetric and backscatter) data were collected along with sediment samples, riverbed photographs, and (or) video at 88 sites within the geophysical survey area. Sediment grab samples were collected at 72 of the 88 sampling sites, video was acquired at 68 sites, and photographs of the river bottom were taken at 38 sites. These survey data are used to characterize the riverbed by identifying sediment-texture and riverbed morphology. More information can be found on the web page for the Woods Hole Coastal and Marine Science Center field activity: https://cmgds.marine.usgs.gov/fan_info.php?fan=2012-024-FA. Data collected during the 2012 survey can be obtained here: https://doi.org/10.5066/F7PG1Q7V.
Supplemental_Information:
More information can be found on the WHCMSC Field Activity webpage: https://cmgds.marine.usgs.gov/fan_info.php?fan=2012-024-FA. Data collected during the 2012 survey can be obtained here: https://doi.org/10.5066/F7PG1Q7V.
  1. How might this data set be cited?
    U.S. Geological Survey, 2017, 2-meter bathymetric data collected in 2012 by the U.S. Geological Survey in the Connecticut River during field activity 2012-024-FA (bathymetry and depth-colored hillshade relief GeoTIFFs): data release DOI:10.5066/F7PG1Q7V, U.S. Geological Survey, Coastal and Marine Geology Program, Woods Hole Coastal and Marine Science Center, Woods Hole, Massachusetts.

    Online Links:

    This is part of the following larger work.

    Ackerman, Seth D., Foster, David S., Moore, Eric M., Irwin, Barry J., Blackwood, Dann S., and Sherwood, Christopher R., 2017, High-Resolution Geophysical and Sampling Data Collected at the Mouth of the Connecticut River, Old Saybrook to Essex, Connecticut, 2012: data release DOI:10.5066/F7PG1Q7V, U.S. Geological Survey, Reston, VA.

    Online Links:

    Other_Citation_Details:
    Suggested citation: Ackerman S.D., Foster D.S., Moore E.M., Irwin B.J., Blackwood D.S., and Sherwood, C.R., 2017, High-resolution geophysical and sampling data collected at the mouth of the Connecticut River, Old Saybrook to Essex, Connecticut, 2012: U.S. Geological Survey data release, https://doi.org/10.5066/F7PG1Q7V.
  2. What geographic area does the data set cover?
    West_Bounding_Coordinate: -72.421933
    East_Bounding_Coordinate: -72.327020
    North_Bounding_Coordinate: 41.391681
    South_Bounding_Coordinate: 41.260310
  3. What does it look like?
    https://cmgds.marine.usgs.gov/data/field-activity-data/2012-024-FA/data/bathymetry/2012-024-FA_Bathymetry2m_browse.jpg (JPEG)
    Depth-colored hillshade image of bathymetry of the Connecticut River
  4. Does the data set describe conditions during a particular time period?
    Beginning_Date: 16-Sep-2012
    Ending_Date: 21-Sep-2012
    Currentness_Reference:
    ground condition of survey dates: 20120916-20120921; no bathymetry data were collected on 20120918; see Completeness_Report for more information
  5. What is the general form of this data set?
    Geospatial_Data_Presentation_Form: raster digital data
  6. How does the data set represent geographic features?
    1. How are geographic features stored in the data set?
      This is a Raster data set. It contains the following raster data types:
      • Dimensions 7186 x 3758, type Pixel
    2. What coordinate system is used to represent geographic features?
      Grid_Coordinate_System_Name: Universal Transverse Mercator
      Universal_Transverse_Mercator:
      UTM_Zone_Number: 18N
      Transverse_Mercator:
      Scale_Factor_at_Central_Meridian: 0.9996
      Longitude_of_Central_Meridian: -75
      Latitude_of_Projection_Origin: 0
      False_Easting: 500000
      False_Northing: 0
      Planar coordinates are encoded using row and column
      Abscissae (x-coordinates) are specified to the nearest 2.0
      Ordinates (y-coordinates) are specified to the nearest 2.0
      Planar coordinates are specified in meters
      The horizontal datum used is D_WGS_1984.
      The ellipsoid used is WGS_1984.
      The semi-major axis of the ellipsoid used is 6378137.000000.
      The flattening of the ellipsoid used is 1/298.257224.
      Vertical_Coordinate_System_Definition:
      Depth_System_Definition:
      Depth_Datum_Name: NAVD88
      Depth_Resolution: 0.1
      Depth_Distance_Units: meters
      Depth_Encoding_Method: Explicit depth coordinate included with horizontal coordinates
  7. How does the data set describe geographic features?
    Entity_and_Attribute_Overview:
    There are no attributes associated with a GeoTIFF however the pixel values of the 32-bit bathymetry image (2012-024-FA_Bathymetry2m_NAVD88.tif) are depth values. The "no data" value for this image is set to 3.40282346639e+038. Data values represent depth in meters referenced to NAVD88. The color-ramp of the hillshade bathymetry image (2012-024-FA_Bathymetry2m_NAVD88_GeoTIFF3x.tif) is full visual spectrum from red to dark-blue/purple representing shallow (less than 1 meters) to deep (approximately 17 meters), respectively. The hillshade image is a 32-bit (4 8-bit channels - RGBA; which means red green blue alpha). RGBA is the RGB color model with extra alpha channel information (A). The "no data" value in the hillshaded image is RGB value: 0,0,0. The A value is 255 for the entire image.
    Entity_and_Attribute_Detail_Citation: U.S. Geological Survey

Who produced the data set?

  1. Who are the originators of the data set? (may include formal authors, digital compilers, and editors)
    • U.S. Geological Survey
  2. Who also contributed to the data set?
  3. To whom should users address questions about the data?
    Seth Ackerman
    U.S. Geological Survey
    Geologist
    384 Woods Hole Rd.
    Woods Hole, MA
    USA

    508-548-8700 x2315 (voice)
    508-457-2310 (FAX)
    sackerman@usgs.gov

Why was the data set created?

This gridded bathymetry layer and depth-colored hillshaded image represents approximately 6.3 square kilometers of interferometric sonar (Systems Engineering and Assessment Ltd. SWATHPlus-M) bathymetry data collected by the U.S. Geological Survey in the Connecticut River in 2012 during USGS field activity 2012-024-FA. These data can be used in conjunction with other geophysical and sample data to identify riverbed morphology and sediment texture.

How was the data set created?

  1. From what previous works were the data drawn?
    raw data (source 1 of 1)
    U.S. Geological Survey, Unpublished Material, raw bathymetry data.

    Type_of_Source_Media: disc
    Source_Contribution:
    USGS Field Activity 2012-024-FA: A 234 kHz Systems Engineering and Assessment Ltd. (SEA) SWATHplus-M interferometric sonar was mounted on a rigid pole on the bow of the R/V Rafael. Data were acquired during September 2012.
    USGS Configuration:
    Survey: Survey lines were run at an average speed of 5 knots and were generally spaced 30 m apart to obtain overlapping swaths of data and full riverbed coverage.
    Sonar: The SEA SWATHplus-M operates at a frequency of 234 kHz and a variable range (increased or decreased manually depending on water depth). The system was operated with a transmit power: 60 percent, a transmit length: 34 cycles, 4096 samples per channel, ping range of 46 meters.
    Speed of Sound: Sound-velocity profiles were collected several times each survey day with a hand-casted AML Oceanographic SV Plus V2 (Applied Microsystems) sound velocimeter.
    Tides: Tides were corrected during post-processing using one-minute interval averages of the RTK tide data recorded in the "TID" message string of the HYPACK navigation file for each survey line. The final tide corrected vertical values were achieved by removing the "K" value (height of the geoid above the chart datum) that was applied in HYPACK to reference the soundings to the MLLW datum, and then applying the measured tide offsets parsed from the "TID" message. See the HYPACK navigation files metadata for additional information "2012-024-FA_HYPACK_meta.xml" available from the larger work citation.
  2. How were the data generated, processed, and modified?
    Date: 2012 (process 1 of 6)
    1. Raw to Processed conversion for USGS field activity 2012-024-FA: Each raw SWATHplus bathymetric sonar file (SXR) was converted to a SWATHplus processed file (SXP) using SEA SWATHplus Swath Processor (ver. 3.07.17.00). During the conversion process, sound velocity profiles were used to minimize potential refraction artifacts from fluctuations in the speed of sound within the water column. Various bathymetric filters were applied to eliminate sounding outliers. Predicted tidal information was merged into the processed file (SXP) during this conversion, however final tidal corrections were applied later in the processing flow. Bathymetric filtering typically included low amplitude (100%), range (0-4m), box (3-50m depth, 1.5-75m horizontal), median (window size 5), alongtrack 1 (depth difference of 5-m, window size 5-m, and learn rate of 0.7), alongtrack 2 (depth difference of 1.5-m, window size 1m, and learn rate of 0.9), and mean filters (0.25m). These represent the typical parameters used for the majority of the survey but slight adjustments were required for some areas. This process step and all subsequent process steps were performed by the same person - Seth Ackerman. Person who carried out this activity:
    Seth Ackerman
    U.S. Geological Survey
    Geologist
    384 Woods Hole Rd.
    Woods Hole, MA
    USA

    508-548-8700 x2315 (voice)
    508-457-2310 (FAX)
    sackerman@usgs.gov
    Date: 2013 (process 2 of 6)
    2. CARIS processing for USGS field activity 2012-024-FA: A new CARIS HIPS project (ver. 8.0) was created for this field activity with projection information set to Universal Transverse Mercator (UTM) Zone 18, WGS84. Each SWATHPlus processed file (sxp) was imported to the new CARIS project using the Import/Conversion Wizard. A 2-meter resolution Bathymetric and Statistical Error (BASE) Surface was created from the files for each Julian day. The BASE surface for each day was reviewed for any inconsistencies or data anomalies. Navigation was reviewed and edited as needed using the navigation editor tool. Beam-to-beam slopes and across track angle filters were applied to the soundings line by line. The refraction editor was used to adjust sound speed values in areas where velocimeter data did not adequately correct depth profiles obviously influenced by local anomalies in speed of sound through the water column. Preliminary processing was done during the survey and additional processing was done post-survey with CARIS HIPS and SIPS versions 8.0, 8.1 and 9.0. This process step was done between 2012 and 2013.
    Date: 2013 (process 3 of 6)
    3. Prepare and apply RTK Tide data for USGS field activity 2012-024-FA: A tidal correction file (new_tide_MLLW_offest_REMOVED_edited.tid) was created during post-processing by applying a one-minute moving average filter to an offset value created by adding the RTK tide data recorded in the "TID" message string to the "K" value found in the "KTC" message of the raw HYPACK navigation files. This was necessary because, as described above, HYPACK was erroneously setup to reference the soundings to the MLLW datum from the WGS-84 ellipsoid. Applying the RTK tide offset and removing the "K" value leaves the sounding at the NAVD88 datum. Using a Perl script called tides_hypack2caris_v1.pl, the TID and KTC messages from device 2 (DEV 2; which was the NovAtel DL-V3 GPS receiver) in the raw HYPACK files were extracted and parsed. The combined tide and datum corrections now in the .tid file were loaded and applied to the soundings line by line in CARIS, resulting in tide corrected bathymetric values referenced to NAVD88. Each line was re-merged and the preliminary BASE surfaces were recomputed to incorporate the new tide information. Additional swath editing was done in CARIS using the swath and area based editors to remove any additional inconsistencies and minimize survey artifacts. This process step was done between 2012 and 2013. Data sources produced in this process:
    • new_tide_MLLW_offest_REMOVED_edited.tid
    Date: 2017 (process 4 of 6)
    4. Final BASE surface creation and export: A single BASE surface was created for the entire survey area utilizing all the quality bathymetric soundings data from the survey. An interpolation algorithm was run to fill small gaps between lines. The final surface was then exported from CARIS (ver. 9.1) as a 32-bit GeoTIFF and as 32-bit hillshaded GeoTIFF image. Except for setting the vertical exaggeration to 3x, the default hillshade settings (altitude/elevation = 45, azimuth = 45) were used to create the hillshaded GeoTIFF image. Data sources produced in this process:
    • Bathymetric images (Gridded bathymetric GeoTIFF image - 2012-024-FA_Bathymetry2m_NAVD88.tif and depth-colored bathymetric shaded-relief image with 3x vertical exaggeration - 2012-024-FA_Bathymetry2m_NAVD88_GeoTIFF3x.tif)
    Date: 09-Aug-2017 (process 5 of 6)
    5. A world file with the same prefix file name and .tfw extension was created in ArcMap version 10.3.1 using EXPORT RASTER WORLD FILE tool. Data sources produced in this process:
    • 2012-024-FA_Bathymetry2m_NAVD88_GeoTIFF3x.tfw
    • 2012-024-FA_Bathymetry2m_NAVD88.tfw
    Date: 08-Sep-2020 (process 6 of 6)
    Added keywords section with USGS persistent identifier as theme keyword. Person who carried out this activity:
    U.S. Geological Survey
    Attn: VeeAnn A. Cross
    Marine Geologist
    384 Woods Hole Road
    Woods Hole, MA

    508-548-8700 x2251 (voice)
    508-457-2310 (FAX)
    vatnipp@usgs.gov
  3. What similar or related data should the user be aware of?

How reliable are the data; what problems remain in the data set?

  1. How well have the observations been checked?
  2. How accurate are the geographic locations?
    USGS Field Activity 2012-024-FA: Navigation for SWATHplus-M system was acquired with a Coda Octopus F180 Real-time Kinematic Global Positioning System (RTK-GPS); which is accurate to less than 1 meter (typically on the order of centimeters) horizontally. The SWATHplus-M transducers were mounted on a rigid pole on the bow of the R/V Rafael. The RTK-GPS antenna was located on the same pole approximately 2.48 m above the sea surface. Horizontal sounding positions with offsets adjustments were recorded to raw sonar data files (SXR) via SWATHplus acquisition software (version 3.07.17.00).
  3. How accurate are the heights or depths?
    USGS Field Activity 2012-024-FA: Vertical accuracy of the raw data based on system specifications may approximate 1% of water depth. In the Connecticut River survey area, 1% of the water depth (1-16 meters) translates to a vertical accuracy range of 1-16 centimeters. However, overall vertical accuracies on the order of 50-cm or better are assumed based on the following considerations: The Coda Octopus F180 Attitude and Positioning system, used to correct for vessel roll, pitch, heave, and yaw, has a theoretical vertical accuracy of a few mm. Tidal offsets were originally corrected to MLLW using Real-Time Kinematic GPS (RTK-GPS) heights in the HYPACK navigation software during surveying. RTK corrections were acquired from a subscription service called Keynet GPS, using a GNSS internet modem that connected to the network station in Middletown, CT to receive correction values which were applied in HYPACK. The final vertical data presented here are NAVD88 heights, which was achieved by removing the "K" value (height of the geoid above the chart datum) during the process of applying tide correction in the CARIS HIPS/SIPS processing software (see process steps).
    USGS field tests (unpublished) using submerged targets suggest that the vertical accuracy of the RTK-GPS tidal correction is less than 30cm. Refraction artifacts were minimized by acquiring a range of sound velocity profiles with a hand-casted AML Oceanographic SV Plus V2 (Applied Microsystems) sound velocimeter (for the duration of survey 2012-024-FA). Sound velocity data are entered into the SWATHPlus acquisition software to model the sound velocity structure of the water column. Gridding algorithms and cell sizes for these data could introduce errors as great as 3m along the edges of the data, but gridding-induced errors are likely much smaller (less than 20-cm) for most of the survey area. Changes in ship draft due to water and fuel usage were not considered.
  4. Where are the gaps in the data? What is missing?
    Nearly all quality main survey line bathymetric data (generally surveyed parallel to the riverbank) that were collected within the survey area from the mouth of Connecticut River up river to near Essex, CT were incorporated in this bathymetric surface.
    Tielines and transit lines were typically excluded from this bathymetric surface, especially if equal or higher quality main survey line data were available. Any tieline and transit line data would be used to verify tide corrections during post-processing. Data from the patch test lines and line 1 (collected in Long Island Sound, not in the river) was imported but not processed and is therefore excluded from these rasters. Time gaps occurred during this field activity where surveying was stopped due to equipment problems (Tuesday 18Sept; JD262).
  5. How consistent are the relationships among the observations, including topology?
    This bathymetric surface represents interpolated data at 2-meter per pixel resolution. Bathymetric data were processed to account for gaps that occurred along-track and between adjacent lines. Quality control and data processing were conducted to remove spurious points and reduce speed of sound artifacts (refraction). Soundings from the surveys were processed and edited using Computer Aided Resource Information System (CARIS) Hydrographic Information Processing System (HIPS; vers. 8.0, 8.1, 9.0 and 9.1). Although the soundings were edited, small data spikes may still exist. While much effort was devoted to cleaning the data and minimizing survey artifacts, some artifacts may still be seen in the final gridded bathymetric surface including an along track artifact at nadir (the ship track) and at the far edges of a survey line where adjacent swaths overlap. These artifacts are especially noticeable in areas of little local relief.

How can someone get a copy of the data set?

Are there legal restrictions on access or use of the data?
Access_Constraints: None
Use_Constraints:
These data are NOT to be used for navigation. Mariners should refer to the appropriate nautical chart. Public domain data from the U.S. Government are freely redistributable with proper metadata and source attribution. Please recognize the U.S. Geological Survey as the originator of the dataset.
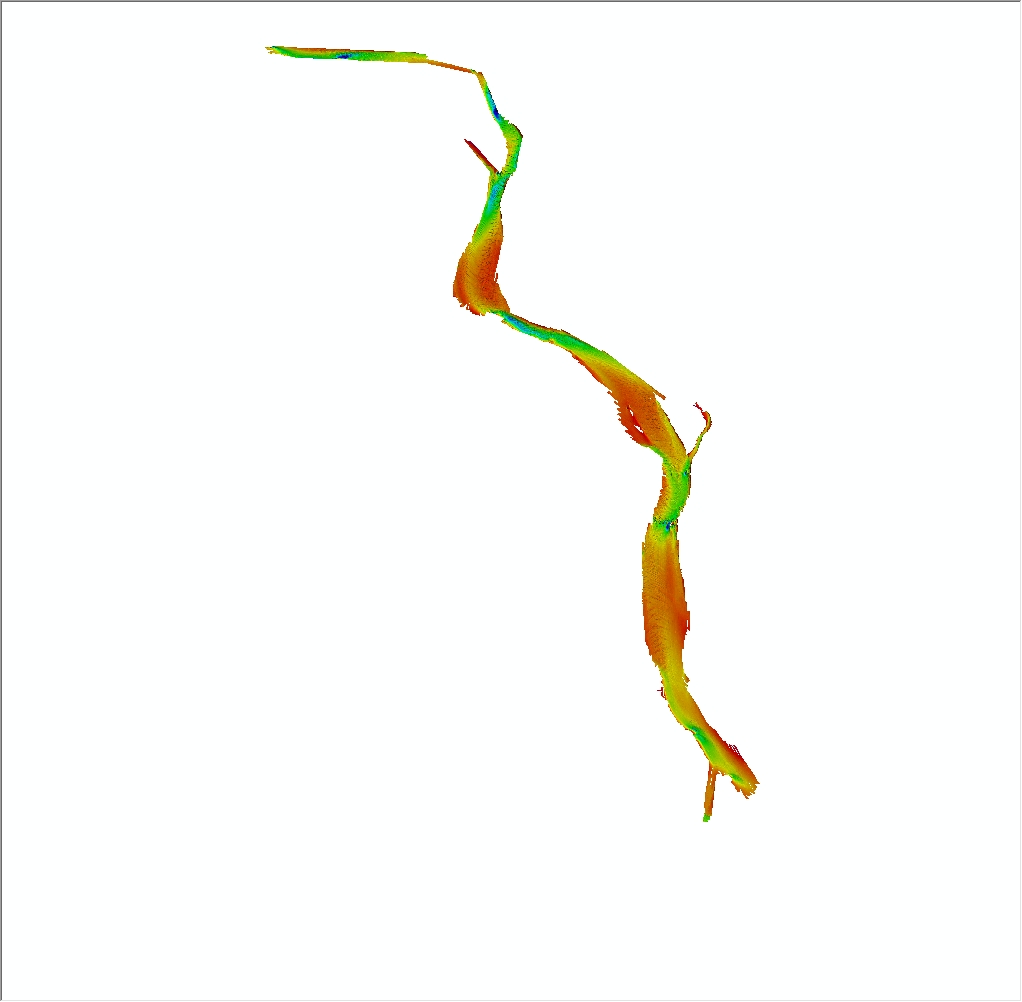
  1. Who distributes the data set? (Distributor 1 of 1)
    Seth Ackerman
    U.S. Geological Survey
    Geologist
    384 Woods Hole Rd.
    Woods Hole, MA
    USA

    508-548-8700 x2315 (voice)
    508-457-2310 (FAX)
    sackerman@usgs.gov
  2. What's the catalog number I need to order this data set? USGS data release 2012-024-FA backscatter imagery from the Connecticut River (2013-003-FA_Bathymetry2m.zip). The zip file contains a folder with the 32-bit floating point GeoTIFF image (2012-024-FA_Bathymetry2m_NAVD88.tif) with a world file (2012-024-FA_Bathymetry2m_NAVD88.tfw). A depth-colored hillshade bathymetry 32-bit (4 8-bit channels RGBA) GeoTIFF image (2012-024-FA_Bathymetry2m_NAVD88_GeoTIFF3x.tif) with a world file (2012-024-FA_Bathymetry2m_NAVD88_GeoTIFF3x.tfw) and metadata files in standard formats are also included in the zip file. The pixel values in the depth-colored hillshade bathymetry image DO NOT correspond to depths. The pixel values of the 32-bit floating point GeoTIFF image are depth values.
  3. What legal disclaimers am I supposed to read?
    Neither the U.S. Government, the Department of the Interior, nor the USGS, nor any of their employees, contractors, or subcontractors, make any warranty, express or implied, nor assume any legal liability or responsibility for the accuracy, completeness, or usefulness of any information, apparatus, product, or process disclosed, nor represent that its use would not infringe on privately owned rights. The act of distribution shall not constitute any such warranty, and no responsibility is assumed by the USGS in the use of these data or related materials. Any use of trade, product, or firm names is for descriptive purposes only and does not imply endorsement by the U.S. Government.
  4. How can I download or order the data?
  5. What hardware or software do I need in order to use the data set?
    The ZIP file contains a 32-bit Floating Point GeoTIFF image with a world file. To utilize these data an image processing or GIS software package capable of viewing a 32-bit floating point GeoTIFF image. Standard image viewing software cannot translate a 32-bit floating point GeoTIFF image. The depth-colored hillshade GeoTIFF image is a 32-bit (4 8-bit channels RGBA) which can be viewed in any image processing or GIS software package capable of viewing a 32-bit GeoTIFF image.

Who wrote the metadata?

Dates:
Last modified: 08-Sep-2020
Metadata author:
Seth Ackerman
U.S. Geological Survey
Geologist
384 Woods Hole Rd.
Woods Hole, MA
USA

508-548-8700 x2315 (voice)
508-457-2310 (FAX)
sackerman@usgs.gov
Metadata standard:
FGDC Content Standards for Digital Geospatial Metadata (FGDC-STD-001-1998)

This page is <https://cmgds.marine.usgs.gov/catalog/whcmsc/field_activities/2012_024_fa/2012-024-FA_Bathymetry2m_NAVD88.faq.html>
Generated by mp version 2.9.50 on Tue Sep 21 18:20:14 2021