Online Links:
Online Links:
| Value | Definition |
|---|---|
| 3 | Sediment entirely or partially analyzed, processed, or visually described by USGS Woods Hole scientists; most samples analyzed in the USGS Woods Hole Sediment Laboratory. |
| Range of values | |
|---|---|
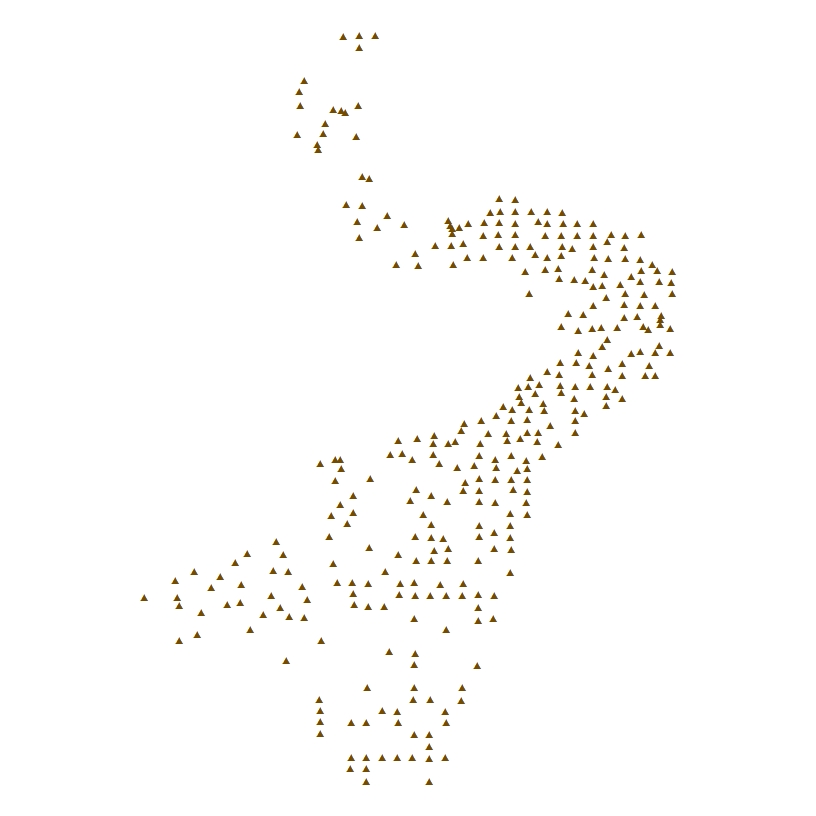
| Minimum: | 42.29698500 |
| Maximum: | 42.87339500 |
| Units: | decimal degrees |
| Resolution: | 0.00000001 |
| Range of values | |
|---|---|
| Minimum: | -70.90712670 |
| Maximum: | -70.49860330 |
| Units: | decimal degrees |
| Resolution: | 0.00000001 |
| Range of values | |
|---|---|
| Minimum: | 11.0 |
| Maximum: | 87.3 |
| Units: | meters |
| Resolution: | 0.1 |
| Range of values | |
|---|---|
| Minimum: | 0 |
| Maximum: | 0 |
| Units: | centimeters |
| Range of values | |
|---|---|
| Minimum: | 2 |
| Maximum: | 2 |
| Units: | centimeters |
| Range of values | |
|---|---|
| Minimum: | 8 |
| Maximum: | 8 |
| Units: | months |
| Resolution: | 1 |
| Range of values | |
|---|---|
| Minimum: | 21 |
| Maximum: | 27 |
| Units: | days |
| Resolution: | 1 |
| Range of values | |
|---|---|
| Minimum: | 2012 |
| Maximum: | 2012 |
| Units: | years |
| Resolution: | 1 |
| Range of values | |
|---|---|
| Minimum: | 11 |
| Maximum: | 11 |
| Units: | months |
| Resolution: | 1 |
| Range of values | |
|---|---|
| Minimum: | 28 |
| Maximum: | 28 |
| Units: | days |
| Resolution: | 1 |
| Range of values | |
|---|---|
| Minimum: | 2012 |
| Maximum: | 2012 |
| Units: | years |
| Resolution: | 1 |
| Range of values | |
|---|---|
| Minimum: | 16.7942 |
| Maximum: | 246.6600 |
| Units: | grams |
| Resolution: | 0.0001 |
| Range of values | |
|---|---|
| Minimum: | 0 |
| Maximum: | 74.51 |
| Units: | percent |
| Resolution: | 0.01 |
| Range of values | |
|---|---|
| Minimum: | 5.39 |
| Maximum: | 99.69 |
| Units: | percent |
| Resolution: | 0.01 |
| Range of values | |
|---|---|
| Minimum: | 0.18 |
| Maximum: | 70.51 |
| Units: | percent |
| Resolution: | 0.01 |
| Range of values | |
|---|---|
| Minimum: | 0.08 |
| Maximum: | 34.49 |
| Units: | percent |
| Resolution: | 0.01 |
| Value | Definition |
|---|---|
| CLAYEY SILT | Silt less than 75 percent and equal to or greater than 50 percent, clay greater than sand, and sand less than 20 percent. |
| GRAVEL | Gravel equal to or greater than 50 percent. |
| GRAVELLY SEDIMENT | Gravel equal to or greater than 10 percent, but less than 50 percent. |
| MUD | Mud (silt plus clay) equal to or greater than 50 percent based on visual observation. |
| SAND | Sand equal to or greater than 75 percent. |
| SAND SILT CLAY | Clay, sand, and silt greater than 20 percent each. |
| SANDY SILT | Silt less than 75 percent and equal to or greater than 50 percent, sand greater than clay, and clay less than 20 percent. |
| SILTY SAND | Sand less than 75 percent and equal to or greater than 50 percent, silt greater than clay, and clay less than 20 percent. |
| Range of values | |
|---|---|
| Minimum: | -4.20 |
| Maximum: | 7.34 |
| Units: | phi |
| Resolution: | 0.01 |
| Range of values | |
|---|---|
| Minimum: | -2.37 |
| Maximum: | 7.06 |
| Units: | phi |
| Resolution: | 0.01 |
| Range of values | |
|---|---|
| Minimum: | 0.44 |
| Maximum: | 4.65 |
| Units: | phi |
| Resolution: | 0.01 |
| Range of values | |
|---|---|
| Minimum: | -0.45 |
| Maximum: | 5.30 |
| Units: | unitless |
| Resolution: | 0.01 |
| Range of values | |
|---|---|
| Minimum: | -1.44 |
| Maximum: | 144.45 |
| Units: | unitless |
| Resolution: | 0.01 |
| Range of values | |
|---|---|
| Minimum: | 0 |
| Maximum: | 0 |
| Units: | percent |
| Resolution: | 0.01 |
| Range of values | |
|---|---|
| Minimum: | 0 |
| Maximum: | 62.49 |
| Units: | percent |
| Resolution: | 0.01 |
| Range of values | |
|---|---|
| Minimum: | 0 |
| Maximum: | 26.13 |
| Units: | percent |
| Resolution: | 0.01 |
| Range of values | |
|---|---|
| Minimum: | 0 |
| Maximum: | 29.58 |
| Units: | percent |
| Resolution: | 0.01 |
| Range of values | |
|---|---|
| Minimum: | 0 |
| Maximum: | 40.11 |
| Units: | percent |
| Resolution: | 0.01 |
| Range of values | |
|---|---|
| Minimum: | 0.01 |
| Maximum: | 41.54 |
| Units: | percent |
| Resolution: | 0.01 |
| Range of values | |
|---|---|
| Minimum: | 0.02 |
| Maximum: | 81.40 |
| Units: | percent |
| Resolution: | 0.01 |
| Range of values | |
|---|---|
| Minimum: | 0.10 |
| Maximum: | 61.82 |
| Units: | percent |
| Resolution: | 0.01 |
| Range of values | |
|---|---|
| Minimum: | 0.12 |
| Maximum: | 74.09 |
| Units: | percent |
| Resolution: | 0.01 |
| Range of values | |
|---|---|
| Minimum: | 0.02 |
| Maximum: | 92.53 |
| Units: | percent |
| Resolution: | 0.01 |
| Range of values | |
|---|---|
| Minimum: | 0.04 |
| Maximum: | 18.99 |
| Units: | percent |
| Resolution: | 0.01 |
| Range of values | |
|---|---|
| Minimum: | 0.03 |
| Maximum: | 18.06 |
| Units: | percent |
| Resolution: | 0.01 |
| Range of values | |
|---|---|
| Minimum: | 0.05 |
| Maximum: | 29.21 |
| Units: | percent |
| Resolution: | 0.01 |
| Range of values | |
|---|---|
| Minimum: | 0.05 |
| Maximum: | 27.05 |
| Units: | percent |
| Resolution: | 0.01 |
| Range of values | |
|---|---|
| Minimum: | 0.04 |
| Maximum: | 18.67 |
| Units: | percent |
| Resolution: | 0.01 |
| Range of values | |
|---|---|
| Minimum: | 0.02 |
| Maximum: | 10.59 |
| Units: | percent |
| Resolution: | 0.01 |
| Range of values | |
|---|---|
| Minimum: | 0.02 |
| Maximum: | 5.23 |
| Units: | percent |
| Resolution: | 0.01 |
Online Links:
Online Links:
Online Links:
Online Links:
Online Links:
Online Links:
| Access_Constraints | None |
|---|---|
| Use_Constraints | Public domain data from the U.S. Government are freely redistributable with proper metadata and source attribution. Please recognize the U.S. Geological Survey as the originator of the dataset. |
| Data format: | The zip file contains a shapefile and CSV file of sediment sample locations and grain-size analysis collected by the U.S. Geological Survey Woods Hole Coastal and Marine Science Center and Massachusetts Office of Coastal Zone Management in Ipswich Bay and Massachusetts Bay, Massachusetts, in 2012 and the associated metadata. in format Shapefile (version Esri ArcGIS 10.3.1) Shapefile Size: 0.2 |
|---|---|
| Network links: |
https://cmgds.marine.usgs.gov/data/field-activity-data/2012-035-FA/data/samples/2012-035-FA_samples.zip https://doi.org/10.5066/P924M8R1 https://cmgds.marine.usgs.gov/data/field-activity-data/2012-035-FA/ |
| Data format: | The zip file contains a shapefile and CSV file of the sediment sample locations and grain-size analysis collected by the U.S. Geological Survey Woods Hole Coastal and Marine Science Center and Massachusetts Office of Coastal Zone Management in Ipswich Bay and Massachusetts Bay, Massachusetts, in 2012 and the associated metadata. in format CSV (version Microsoft Excel 2016 for Mac) Comma Separated Value (CSV) text file Size: 0.2 |
|---|---|
| Network links: |
https://cmgds.marine.usgs.gov/data/field-activity-data/2012-035-FA/data/samples/2012-035-FA_samples.zip https://doi.org/10.5066/P924M8R1 https://cmgds.marine.usgs.gov/data/field-activity-data/2012-035-FA/ |