Online Links:
Online Links:
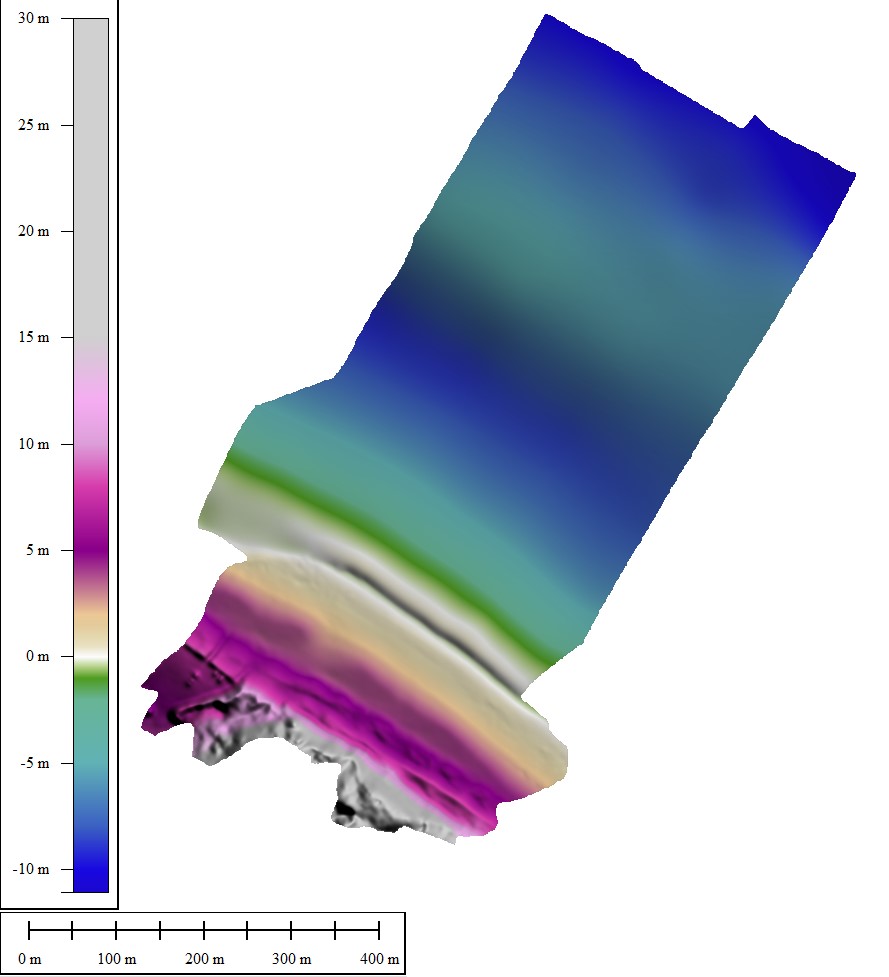
| Range of values | |
|---|---|
| Minimum: | -11.081 |
| Maximum: | 30.017 |
| Units: | meters |
Online Links:
| Access_Constraints | None |
|---|---|
| Use_Constraints | Public domain data from the U.S. Government are freely redistributable with proper metadata and source attribution. Although these data have been processed successfully on a computer system at the U.S. Geological Survey (USGS), no warranty expressed or implied is made regarding the display or utility of the data for other purposes, nor on all computer systems, nor shall the act of distribution constitute any such warranty. The USGS or the U.S. Government shall not be held liable for improper or incorrect use of the data described and/or contained herein. Not for navigational use. Please recognize the U.S. Geological Survey (USGS) as the source of this information. |
| Data format: | File containing 32-bit floating point GeoTIFF representing a topobathy model of Head of the Meadow Beach, MA in February 2021. in format GeoTIFF (version 1.0.0) 32-bit floating point GeoTIFF format Size: 5.82 |
|---|---|
| Network links: |
https://cmgds.marine.usgs.gov/data/field-activity-data/2021-014-FA/data/Topobathy/Topobathy/2021014FA_Truro_topobathy_1m.tif https://cmgds.marine.usgs.gov/data/field-activity-data/2021-014-FA https://doi.org/10.5066/P9D94NZ3 |