Interpretation of the Surficial Geology in the Pulley Ridge Study Area (PULLEY_INTERP.SHP)

Metadata also available as - [Outline] - [Parseable text] - [XML]

Frequently anticipated questions:


What does this data set describe?

Title:
Interpretation of the Surficial Geology in the Pulley Ridge Study Area (PULLEY_INTERP.SHP)
Abstract:
Pulley Ridge is a series of drowned barrier islands that extends almost 200 km in 60-100 m water depths. This drowned ridge is located on the Florida Platform in the southeastern Gulf of Mexico about 250 km west of Cape Sable, Florida. This barrier island chain formed during the initial stage of the Holocene marine transgression. These islands were then submerged and left abandoned near the outer edge of the Florida Platform. The southern portion of Pulley Ridge hosts zooxanthellate scleractinian corals, green, red and brown macro algae, and a mix of deep and typically shallow-water tropical fishes. This reef community is in unusually deep water, and its extent and the controls on its distribution were unknown. To address these questions scientists from the U.S. Geological Survey Coastal and Marine Geology Program in cooperation with scientists from the University of South Florida Department of Marine Sciences have completed a detailed mapping of the southernmost 35 km of Pulley Ridge. The area was mapped using multibeam bathymetry, sidescan-sonar imagery, and high-resolution seismic-reflection profiling to define the geologic framework on which the reef is established. Submersible dives, remotely operated vehicle (ROV) transects, and transects of bottom photographs and video were collected to identify the corals and to map their distribution. This extensive suite of data has been compiled and preliminary analysis of the data suggests that the reefs are not tied to the ridge system, but instead are more broadly distributed. Whether reef distribution is controlled by oceanographic conditions or by subtle differences in the substrate that overlies the barrier island system is unclear, and are topics of continued research.
  1. How might this data set be cited?
    Twichell, David C., 2005, Interpretation of the Surficial Geology in the Pulley Ridge Study Area (PULLEY_INTERP.SHP): Open-File Report 2005-1089, U.S. Geological Survey, Coastal and Marine Geology Program, Woods Hole Coastal and Marine Science Center, Woods Hole, MA.

    Online Links:

    This is part of the following larger work.

    Cross, VeeAnn A., Twichell, David C., Halley, Robert B., Ciembronowicz, Kate T., Jarrett, Bret D., Hammar-Klose, Erika S., Hine, Al C., Locker, Stan D., and Naar, Dave F., 2005, GIS Compilation of Data Collected from the Pulley Ridge Deep Coral Reef Region: Open-File Report 2005-1089, U.S. Geological Survey, Reston, VA.

    Online Links:

  2. What geographic area does the data set cover?
    West_Bounding_Coordinate: -83.768420
    East_Bounding_Coordinate: -83.599513
    North_Bounding_Coordinate: 24.996035
    South_Bounding_Coordinate: 24.665195
  3. What does it look like?
    http://woodshole.er.usgs.gov/pubs/of2005-1089/htmldocs/icons/interp_bg.jpg (JPEG)
    Image showing extent and coverage of data layer.
  4. Does the data set describe conditions during a particular time period?
    Calendar_Date: 2004
    Currentness_Reference:
    publication date
  5. What is the general form of this data set?
    Geospatial_Data_Presentation_Form: vector digital data
  6. How does the data set represent geographic features?
    1. How are geographic features stored in the data set?
      This is a Vector data set. It contains the following vector data types (SDTS terminology):
      • G-polygon (41)
    2. What coordinate system is used to represent geographic features?
      Horizontal positions are specified in geographic coordinates, that is, latitude and longitude. Latitudes are given to the nearest 0.000001. Longitudes are given to the nearest 0.000001. Latitude and longitude values are specified in Decimal degrees. The horizontal datum used is North American Datum of 1983.
      The ellipsoid used is Geodetic Reference System 80.
      The semi-major axis of the ellipsoid used is 6378137.000000.
      The flattening of the ellipsoid used is 1/298.257222.
  7. How does the data set describe geographic features?
    pulley_interp
    Information unavailable from original metadata. (Source: Information unavailable from original metadata.)
    FID
    Internal feature number. (Source: ESRI) Sequential unique whole numbers that are automatically generated.
    Shape
    Feature geometry. (Source: ESRI) Coordinates defining the features.
    ID
    Computer generated polygon ID number. (Source: Software.)
    ValueDefinition
    0Information unavailable from original metadata.
    INTERP
    Interpretation of the seafloor based on the sidescan-sonar mosaic. (Source: Scientist - David C. Twichell) character set
    Entity_and_Attribute_Overview:
    The Interp attribute definitions are as follows: terraces: Alternating linear bands of high and low backscatter on the sidescan-sonar imagery. The high-backscatter stripes are interpreted to be reflections off rock surfaces while the low-backscatter stripes are either shadows cast by the terraces or areas where fine-grained sediment has covered parts of the terraces. The bathymetry shows that the terraces occur along the flanks of the narrow ridge that marks the crest of the ridge. Video observations show outcrops of hardgrounds in these areas. high-backscatter: The sidescan-sonar images were smoothed in PCI with a 7x7 average filter, and the areas with values mostly between 117 and 225 were mapped as areas of high backscatter. video observations indicate that these areas are a mix of exposed hardgrounds, carbonate rubble, and deep-water coral. broad lines: The sidescan sonar image shows subtle variations in backscatter intensity that coincide with low-relief ridges on the multibeam bathymetry. depression-large: Sub-circular depressions show on the multibeam bathymetry that have 30-200 m diameters and are less than 3 m deeper than the surrounding seafloor. Many of these depressions have low-backscatter floors on the sidescan-sonar imagery. Video observations indicate that the floors of these depressions are fine sand. mottled-mod: The sidescan-sonar image shows a mottled seafloor of moderate and low-backscatter patches that have dimensions of 50-200 m. The average backscatter values on the filtered image for these areas are mostly 110-120. mod-backscatter: More uniform in backscatter intensity than the mottled-moderate backscatter regions. These areas occur mostly around the edges of the ridge where the seafloor is smoother than it is on the ridge itself. Video observations from these areas show a sandy seafloor with some carbonate cobbles, but the cobbles are not as concentrated as they are on the ridge. mottled-low: Low backscatter areas that are interrupted by sub-circular moderate backscatter patches that are 20-100 m in diameter. The moderate backscatter patches commonly have a pit or mound near their centers. The background in these areas mostly has a DN value less than 100. The multibeam bathymetry shows that the seafloor in these areas is smooth, and video observations indicate that the seafloor is somewhat sandier than other parts of the study area. low-backscatter: Areas with a smooth seafloor with a low-backscatter (DN less than 105) appearance. the only part of the study area with this appearance is in the southernmost part of the area beyond the shelf on the uppermost slope.
    Entity_and_Attribute_Detail_Citation: U.S. Geological Survey

Who produced the data set?

  1. Who are the originators of the data set? (may include formal authors, digital compilers, and editors)
    • David C. Twichell
  2. Who also contributed to the data set?
  3. To whom should users address questions about the data?
    David C. Twichell
    U.S. Geological Survey
    Oceanographer
    384 Woods Hole Rd.
    Woods Hole, MA
    USA

    (508) 548-8700 x2266 (voice)
    (508) 457-2310 (FAX)
    dtwichell@usgs.gov

Why was the data set created?

Polygon shapefile indicating the interpretation of the sidescan-sonar mosaic.

How was the data set created?

  1. From what previous works were the data drawn?
  2. How were the data generated, processed, and modified?
    Date: Unknown (process 1 of 5)
    Sidescan-sonar image mosaics were enhanced within PCI Geomatics software, using a linear stretch mapping the values between 80 and 140 across the entire 8-bit range (0-255). In addition, a 7x7 average filter was applied to smooth the images.
    Date: 08-Nov-2016 (process 2 of 5)
    Edits to the metadata were made to fix any errors that MP v 2.9.34 flagged. This is necessary to enable the metadata to be successfully harvested for various data catalogs. In some cases, this meant adding text "Information unavailable" or "Information unavailable from original metadata" for those required fields that were left blank. Other minor edits were probably performed (title, publisher, publication place, etc.). The link to the larger work citation in the Identification_Information section had to be fixed. Added the pubs url online link to the data in the distribution section. Minor fixes to the attribute format for some attributes were needed. Add the keyword interpretation. The metadata date (but not the metadata creator) was edited to reflect the date of these changes. The metadata available from a harvester may supersede metadata bundled within a download file. Compare the metadata dates to determine which metadata file is most recent. Person who carried out this activity:
    U.S. Geological Survey
    Attn: VeeAnn A. Cross
    Marine Geologist
    384 Woods Hole Road
    Woods Hole, MA

    508-548-8700 x2251 (voice)
    508-457-2310 (FAX)
    vatnipp@usgs.gov
    Date: 20-Jul-2018 (process 3 of 5)
    USGS Thesaurus keywords added to the keyword section. Person who carried out this activity:
    U.S. Geological Survey
    Attn: VeeAnn A. Cross
    Marine Geologist
    384 Woods Hole Road
    Woods Hole, MA

    508-548-8700 x2251 (voice)
    508-457-2310 (FAX)
    vatnipp@usgs.gov
    Date: 18-Nov-2019 (process 4 of 5)
    Crossref DOI link was added as the first link in the metadata. Person who carried out this activity:
    U.S. Geological Survey
    Attn: VeeAnn A. Cross
    Marine Geologist
    384 Woods Hole Road
    Woods Hole, MA

    508-548-8700 x2251 (voice)
    508-457-2310 (FAX)
    vatnipp@usgs.gov
    Date: 08-Sep-2020 (process 5 of 5)
    Added keywords section with USGS persistent identifier as theme keyword. Person who carried out this activity:
    U.S. Geological Survey
    Attn: VeeAnn A. Cross
    Marine Geologist
    384 Woods Hole Road
    Woods Hole, MA

    508-548-8700 x2251 (voice)
    508-457-2310 (FAX)
    vatnipp@usgs.gov
  3. What similar or related data should the user be aware of?

How reliable are the data; what problems remain in the data set?

  1. How well have the observations been checked?
  2. How accurate are the geographic locations?
  3. How accurate are the heights or depths?
  4. Where are the gaps in the data? What is missing?
    Information unavailable from original metadata.
  5. How consistent are the relationships among the observations, including topology?
    Information unavailable from original metadata.

How can someone get a copy of the data set?

Are there legal restrictions on access or use of the data?
Access_Constraints None.
Use_Constraints Public domain data from the U.S. Government are freely redistributable with proper metadata and source attribution. Please recognize the U.S. Geological Survey (USGS) as the source of this information.
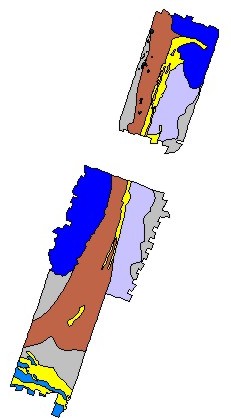
  1. Who distributes the data set? (Distributor 1 of 1)
    David C. Twichell
    U.S. Geological Survey
    Oceanographer
    384 Woods Hole Rd.
    Woods Hole, MA
    USA

    (508) 548-8700 x2266 (voice)
    (508) 457-2310 (FAX)
    dtwichell@usgs.gov
  2. What's the catalog number I need to order this data set? Downloadable Data
  3. What legal disclaimers am I supposed to read?
    Although these data have been used by the U.S. Geological Survey (USGS), U.S. Department of the Interior (DOI), no warranty expressed or implied is made by the U.S. Geological Survey as to the accuracy of the data. The act of distribution shall not constitute any such warranty, and no responsibility is assumed by the USGS in the use of these data or related materials.
    Any use of trade, product, or firm names is for descriptive purposes only and does not imply endorsement by the U.S. Government.
  4. How can I download or order the data?
  5. What hardware or software do I need in order to use the data set?
    These data are available in Environmental Systems Research Institute (ESRI) shapefile format. The user must have ArcGIS or ArcView 3.0 or greater software to read and process the data file. In lieu of ArcView or ArcGIS, the user may utilize another GIS application package capable of the importing data. A free data viewer, arcexplorer, capable of displaying the data is available from ESRI at www.esri.com.

Who wrote the metadata?

Dates:
Last modified: 18-Mar-2024
Metadata author:
VeeAnn A. Cross
U.S. Geological Survey
Marine Geologist
384 Woods Hole Rd.
Woods Hole, MA
USA

(508) 548-8700 x2251 (voice)
(508) 457-2310 (FAX)
whsc_data_contact@usgs.gov
Contact_Instructions:
The metadata contact email address is a generic address in the event the person is no longer with USGS. (updated on 20240318)
Metadata standard:
FGDC Content Standards for Digital Geospatial Metadata (FGDC-STD-001-1998)

This page is <https://cmgds.marine.usgs.gov/catalog/whcmsc/open_file_report/ofr2005-1089/pulley_interp.shp.faq.html>
Generated by mp version 2.9.51 on Mon Mar 25 16:05:23 2024